| Issue |
A&A
Volume 524, December 2010
|
|
|---|---|---|
| Article Number | L2 | |
| Number of page(s) | 4 | |
| Section | Letters | |
| DOI | https://doi.org/10.1051/0004-6361/201015738 | |
| Published online | 22 November 2010 | |
Letter to the Editor
Li – O anti-correlation in NGC 6752: evidence for Li-enriched polluting gas ⋆
1
National Astronomical Observatories, Chinese Academy of
Science,
20a Datun road, Chaoyang District,
Beijing,
PR China
e-mail: This email address is being protected from spambots. You need JavaScript enabled to view it.
2
ESO – European Southern Observatory, Karl-Schwarzschild-Strasse 2, 85748
Garching bei München,
Germany
e-mail:This email address is being protected from spambots. You need JavaScript enabled to view it.
3
GEPI, Observatoire de Paris, CNRS, Université Paris Diderot,
Place Jules
Janssen, 92190
Meudon,
France
4
Istituto Nazionale di Astrofisica, Osservatorio Astronomico di
Trieste, via Tiepolo 11, 34143
Trieste,
Italy
5
Istituto Nazionale di Astrofisica, Osservatorio Astronomico di
Padova, Vicolo dell’Osservatorio, Padova, Italy
Received: 10 September 2010
Accepted: 24 October 2010
Abstract
Context. Elemental correlations and anti-correlations are known to be present in globular clusters (GCs) owing to pollution by CNO cycled gas. Because of its fragility Li is destroyed at the temperature at which the CNO cycling occurs, and this makes Li a crucial study for the nature of the contaminating stars.
Aims. We observed 112 un-evolved stars at the Turnoff of the NGC 6752 cluster with FLAMES at the VLT to investigate the presence and the extent of a Li-O correlation. This correlation is expected if there is a simple pollution scenario.
Methods. Li (670.8 nm) and O triplet (771 nm) abundances are derived in NLTE. All stars belong to a very narrow region of the color-magnitude diagram, so they have similar stellar parameters (Teff, log g).
Results. We find that O and Li correlate, with a high statistical significance that confirms the early results for this cluster. At first glance this is what is expected if a simple pollution of pristine gas with CNO cycled gas (O-poor, Li-poor) occurred. The slope of the relationship, however, is about 0.4, and differs from unity by over 7σ. A slope of one is the value predicted for a pure contamination model.
Conclusions. We confirm an extended Li-O correlation in non evolved stars of NGC 6752. At the same time the characteristic of the correlation shows that a simple pollution scenario is not sufficient to explain the observations. Within this scenario the contaminant gas must have been enriched in Li. This would rule out massive stars as main polluters, and favor the hypothesis that the polluting gas was enriched by intermediate or high-mass AGB stars, unless the former can be shown to be able to produce Li. According to our observations, the fraction of polluting gas contained in the stars observed is a considerable fraction of the stellar mass of the cluster.
Key words: stars: abundances / stars: late-type / globular clusters: individual: NGC 6752
Based on observations collected at the ESO VLT. Programme –81.D-0287.
© ESO, 2010
1. Introduction
Among the light elements Li is special, because Li is produced in the Big Bang nucleosynthesis, enriched during the Galaxy evolution and destroyed in the stellar interior.
After the pioneering works with 4 m class telescopes (Pasquini & Molaro 1996, 1997; Castilho et al. 2000), the study of Li in globular clusters (GC) has received a tremendous boost with 8 m telescopes (Boesgaard et al. 1998; Thévenin et al. 2001; Bonifacio et al. 2002, 2007; Pasquini et al. 2004), and, with the advent of multi object spectrographs, many un-evolved and evolved stars have been observed for Li in the nearest GCs (Korn et al. 2007; Lind et al. 2009; González Hernández et al. 2009; D’Orazi & Marino 2010; D’Orazi et al. 2010; Monaco et al. 2010).
This work shall concentrate on the GC chemical inhomogeneities. Chemical inhomogeneities in globular clusters have been known for almost 50 years (Harding 1962) and Li may represent a key element in distinguishing between the possible mechanisms causing them.
Historically, the first NTT observations of two Turn-Off (TO) stars in the metal rich, chemically inhomogeneous GC 47 Tuc did not show any difference in their Li content, even though one star was CN rich and the other CN poor (Pasquini & Molaro 1997). An early claim made by Boesgaard et al. (1998) of Li inhomogeneity in M 92 has been questioned on the basis of a more realistic treatment of the errors (Bonifacio 2002). This situation has dramatically changed after the analysis of nine TO stars in NGC 6752, because for the first time strong Li variations were detected among these stars, and in addition they were anti-correlating with Na abundances; for seven stars an O measurement was also possible, showing a possible O-Li correlation (Pasquini et al. 2005) .
It has been firmly established that chemical inhomogeneities in GC bring the signatures of CNO cycling, but all the possible reactions that involve the CNO cycle occur at temperatures well above 10 million degrees. At these temperatures, proton captures have destroyed all Li; the reaction destroying Li is indeed already very effective at 2.5 MK and has an extremely high power with temperature. The discovery of Li variations in NGC 6752 and their possible anticorrelation with processed material, but with the important detail that Li is still detected in the stars with the lowest O abundances, therefore suggests that the stars have been enriched by processed gas, possibly produced by the AGB stars in their H-burning shell phase. At these temperatures also the full CNO cycling takes place, and oxygen is expected to be burnt. Indeed, an oxygen-sodium anticorrelation is observed in this cluster (Gratton et al. 2001; Carretta et al. 2007). We note that the NGC 6752 TO stars have metallicity ([Fe/H] ~ –1.4) and effective temperatures (Teff ~ 6300 K) hot enough that they should be considered bona fide Spite plateau stars (Spite & Spite 1982), for which internal Li depletion is excluded on the basis of standard models. If we were able to establish on a quantitative basis the existence of the expected Li-O correlation, we could quantitatively test the predictions of the main existing scenarios: these stars are the components of a second generation of low-mass stars in the cluster, which formed from the ejecta either of intermediate mass stars expelled during the AGB phase, as proposed by D’Antona et al. (2002), or by material processed by massive stars (Decressin et al. 2007).
We are, on the other hand, conscious that not all clusters may have gone through the same formation process. NGC 6397 is showing so far a puzzling behavior: in this cluster Li is almost constant in the observed TO stars and at the Spite plateau level, except for a mild decrease with decreasing effective temperature (González Hernández et al. 2009), while some stars show up to 0.6 dex difference in their O abundance (Pasquini et al. 2004). O-poor-Li-rich stars have a puzzle in the pollution scenario, and only the production during the AGB phase would at least qualitatively explain it.
In a simple self-pollution scheme Li is a powerful discriminator, and it becomes even more powerful when used in conjunction with O, (rather than Na or N) because both elements are destroyed in the full CNO cycle. For a given fraction of destroyed O at least the same fraction of Li must have beendestroyed.
2. Observations and analysis
The observations were obtained with FLAMES and the GIRAFFE spectrograph located at the VLT Kueyen (Pasquini et al. 2003). The Li observations were obtained in ESO Period 73 and the O IR triplet observations in ESO period 75 for the same stars. The resolving power and S / N ratio obtained were of R ~ 17000, S / N ~ 80−100 for the Li (607.8 nm) region, and for O I (777.1–777.5 nm), R ~ 18400 and S / N ~ 40−50.
Targets were selected on the basis of their magnitudes and color and on their distance from the cluster center. The BV photometry is based on the data collected in the framework of the EIS Pre-Flames survey (Momany et al. 2001). The magnitudes were extracted with DAOPHOT and calibrated against the Stetson photometric sequence present in the same field. The following selection criteria were used photometrically: stars must be in the TO region with a magnitude range 17.0 < V < 17.3 and color range 0.42 < (B − V) < 0.46; spatially, in a radius 4 < r < 9 arcmin from the center of the cluster in order to limit the effect of crowding and background light contamination. Furthermore, each selected star has been visually inspected to guarantee the absence of nearby bright objects within 5 arcsec. With this restricted limit in magnitudes and colors the physical parameters (Teff, log g ) of the targets are very similar. This shall ensure that the large chemical abundance differences observed cannot be attributed to different stellar parameters. The color-magnitude diagram of NGC 6752 highlighting the selected stars is shown in Fig. 1. The standard deviation in (B − V) color of our sample is 0.008 mag, consistent with our error estimate of 0.01 mag. We adopted a reddening E(B − V) = 0.04 mag (Harris 1996) and computed effective temperatures from the IRFM based calibration of González Hernández & Bonifacio (2009). The mean effective temperature of our sample is 6353 K with a standard deviation of 38 K. As discussed above, this is entirely accounted for by the photometric error. We thus assumed all stars to have this temperature. For the surface gravity we assumed log g = 4.0.
Li and O triplet equivalent widths were then measured by fitting Gaussian profiles. The Li abundances were computed with the fitting function of Sbordone et al. (2010), which is a result of the NLTE synthesis and 3D hydrodynamical models of the CIFIST grid Ludwig et al. (2009). Unfortunately a similar fitting function for the O triplet is not yet available. We therefore computed the NLTE O abundances with the Kiel code (Steenbock & Holweger 1984), a model atmosphere, computed with the Linux version (Sbordone et al. 2004) of the ATLAS 9 code (Kurucz 1993, 2005), no overshooting and the 1 kms-1 opacity distributions functions of Castelli & Kurucz (2003), and the model atom described in Paunzen et al. (1999). The collisions with neutral H are treated in an approximate way (see Steenbock & Holweger 1984), and we adopted a scaling factor of 1/3 as recommended by Caffau et al. (2008). The only O i line that could be safely measured was the 777.1 nm line, the strongest of the triplet. If the other lines of the triplet could also be measured they implied oxygen abundances that could disagree by as much as 0.5 dex from the strongest line. We therefore believe it is safer and more homogeneous to derive oxygen abundances only from this line. We adopt the solar abundances of Caffau et al. (2010).
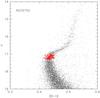 |
Fig. 1 Color–magnitude diagram of NGC 6752. The target stars are highlighted. Note the restricted range in magnitudes. |
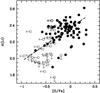 |
Fig. 2 Li vs. O abundance for the observed stars. |
It has long been known that the behavior of the O i permitted triplet lines is a challenge to our comprehension. For example, Spite & Spite (1991) compared the oxygen abundances derived from the triplet and from the forbidden [O i] lines in LTE, finding discrepancies between 0.35 dex and 0.75 dex. We cannot use the [O i] lines because they are not covered by our spectra. And the lines should have equivalent widths (EWs) of less than 0.1 pm, which is beyond the measurement capabilities for stars of this magnitude with VLT. However, García Pérez et al. (2006) have studied in detail a sample of bright subgiant stars and compared the oxygen abundances derived from different indicators, including the O i triplet, computed in NLTE, and the [O i]. They found on average an offset of 0.19 dex, the triplet yielding a higher abundance. It is likely that other effects, such as granulation, are the cause of this discrepancy, and work is in progress to address this with CO5BOLD hydrodynamical models (Ludwig et al. 2009). For the purpose of this letter we stress that only the relative oxygen abundances are relevant. The narrow range in effective temperature and surface gravity covered by our sample strongly argues in favor of the notion that the observed variations in EWs of the O I lines are caused by oxygen abundance rather than to other effects.
The errors on both Li and O are dominated by errors in effective temperature and in equivalent width measurement, because the errors due to surface gravity and microturbulence are negligible with respect to the former. We adopt an error of 100 K on the effective temperatures, which corresponds roughly to the semi-dispersion in the effective temperatures determined for our sample. The errors on equivalent widths were estimated with Cayrel’s formula (Cayrel 1988). The total error on abundance is obtained by summing under quadrature the errors associated to effective temperature and equivalent width. These amount to 0.14 dex for oxygen and 0.09 dex for lithium (with opposite sign for the two elements).
Our results are displayed in Fig. 2; the stars for which both oxygen and lithium could be measured are shown as filled symbols. Open symbols with arrows are for the stars for which one or both measures are upper limits. We have 77 measurements of both elements, for 25 stars lithium is measured, but oxygen is not, for 4 stars oxygen is measured and lithium is not, finally for 6 stars neither element could be measured. This makes a total of 112 measurements and upper limits.
The visual impression is that of a real correlation between the abundances of oxygen and lithium, as found by Pasquini et al. (2005), albeit in presence of a large scatter. This is indeed confirmed by the statistical analysis of the data. If we confine the sample to the 77 stars for which both elements are measured, the non-parametric test of Kendall’s τ tells us that there is a 98% probability that the two are positively correlated. To see if the upper limits may also bring some information we used survival statistics, as provided by asurv Rev 1.21 (Lavalley et al. 1992). The generalized version of Kendall’s τ (Brown et al. 1974), as described by Isobe et al. (1986) provides a probability of correlation of 99.7%, reflecting the fact that the upper limits are mostly found along the correlation at low values of A(Li) and [O/Fe].
After establishing that there exists a correlation between [O/Fe] and A(Li), one may venture to perform parametric fits. A least-square fit using errors in both variables provides a slope of 0.40 with an error of 0.08 and an intercept of 2.37 dex with an error of 0.01 dex. This slope corresponds roughly to what would have been guessed by eye and is shown as a dotted line in Fig. 2. What is interesting is that the root mean square deviation about this relation is 0.12 dex, which is even slightly lower than the sum under quadrature of the errors on oxygen and lithium. This strongly suggests that in reality there is a very tight relation between [O/Fe] and A(Li) and that the observed scatter is only due to observational errors.
The slope of the relationship is important because, as mentioned in the introduction, the simple pollution scheme by CNO processed gas implies that Li and O shall diminish at least at the same rate. Therefore the slope should be one. This is clearly not the case, and the formal slope found by our fit is smaller, in fact a slope of unity is at over 7σ from our best-fit value, therefore the case for a slope of one can be ruled out with very high confidence. We stress that this result does not depend on the unique effective temperature adopted for all stars; the same result is found when adopting a different temperature scale (based on Hα wings, Shen et al. 2010, in prep.).
3. Discussion
We can confirm in this study a Li-O correlation for NGC 6752. Such a neat correlation (together with the Li-Na anticorrelation) is not observed in NGC 6397 ([Fe/H] = –2.03; Gratton et al. 2001) and 47Tuc ([Fe/H] = –0.64; Carretta et al. 2004), the other two clusters observed in a similar way. The correlation of NGC 6752 is close to what one would expect if a pollution scheme was at work. If O decreases by 0.8 dex without Li – enriched polluting material, then Li must decrease by at least the same quantity. Because we observe less Li depletion than O depletion, some Li must be produced by the contaminating stars, i.e. the polluting material cannot be Li-free.
Another evidence for this conclusion is given by the observations of O-poor – Li-rich stars in NGC 6397 (Pasquini et al. 2004). The most recent FLAMES results (D’Orazi et al. 2010) show very large variations of Na and O for stars with the same Li abundances, pointing again to a polluting material with Li content. Our sample also shows in Fig. 2 a fairly large spread of O abundance for the same Li and suggests the presence of O-poor – Li-rich stars, but only for one star the deviation from the linear relationship is statistically significant. If the presence of O-poor – Li-rich stars were to be confirmed by higher S / N ratio observations, this would provide strong constraints on the maximum Li abundance in the ejecta. It is interesting to note that the Li enrichment is in general not so extreme as to destroy the general relationship, but the polluting gas should not have been homogeneous and well mixed in the whole cluster. Not all stars are in fact affected in the same way: only for a considerable fraction of them (5–10% in our sample), on the other hand, the gas polluting these stars should have been very Li-rich. If we consider a star depleted by 0.7 dex in O, this implies a percentage of polluted gas of 80% and only 20% of pristine one.
The star with the highest lithium abundance has a value that is consistent with the prediction of the standard Big Bang nucleosynthesis and the measurement of the baryonic density of the WMAP satellite (Cyburt et al. 2008). We believe this to be fortuitous, because we are invoking Li-polluted material to have contributed to the atmospheres of the studied stars and we are also stating that nothing can be firmly said on the “pristine” abundances of the elements affected by pollution. Although in general we may expect the Li content to be lower than the original value, there is no strong reason to say that, occasionally, it may not be higher, at least until the properties of the polluting stars are firmly established.
One problem pointed out in several occasions for the formation from AGB ejecta is that the amount of “polluted” material required is huge, and from our sample we can confirm that from the oxygen data of NGC 6752 the amount of polluted gas is comparable to half of the gas that formed the observed stars (Shen et al. 2010, in prep.). This can be seen in Fig. 2: in this scheme, all stars with [O/Fe] < ~ 0.0 are composed by at least half of the ejected material. This would pose serious constraints on the cluster IMF. Our sample should be unbiased as far as pollution is concerned, so it should represent the average chemical distribution of the cluster.
We believe that any single pollution-dilution scheme we assumed could be too simplistic, and that the formation scenario was likely more complex.
Acknowledgments
Z.X.S. acknowledges Chinese NSFC Grant 10903012.
References
- Boesgaard, A. M., Deliyannis, C. P., Stephens, A., & King, J. R. 1998, ApJ, 493, 206 [NASA ADS] [CrossRef] [Google Scholar]
- Bonifacio, P. 2002, A&A, 395, 515 [NASA ADS] [CrossRef] [EDP Sciences] [Google Scholar]
- Bonifacio, P., Pasquini, L., Spite, F., et al. 2002, A&A, 390, 91 [NASA ADS] [CrossRef] [EDP Sciences] [Google Scholar]
- Bonifacio, P., Pasquini, L., Molaro, P., et al. 2007, A&A, 470, 153 [NASA ADS] [CrossRef] [EDP Sciences] [Google Scholar]
- Brown, B. J. Jr., Hollander, M., & Korwar, R. M. 1974, Nonparametric Tests of Independence for Censored Data, with Applications to Heart Transplant Studies, fromReliability and Biometry, ed. F. Proschan, & R. J. Serfling (SIAM: Philadelphia), 327 [Google Scholar]
- Caffau, E., Ludwig, H.-G., Steffen, M., et al. 2008, A&A, 488, 1031 [CrossRef] [EDP Sciences] [Google Scholar]
- Caffau, E., Ludwig, H.-G., Steffen, M., Freytag, B., & Bonifacio, P. 2010, Sol. Phys., 66 [Google Scholar]
- Castelli, F., & Kurucz, R. L. 2003, IAU Symp., ed. N. Piskunov, W. W. Weiss, & D. F. Gray, 20P [arXiv:astro-ph/0405087v1] [Google Scholar]
- Carretta, E., Gratton, R. G., Bragaglia, A., Bonifacio, P., & Pasquini, L. 2004, A&A, 416, 925 [NASA ADS] [CrossRef] [EDP Sciences] [Google Scholar]
- Carretta, E., Bragaglia, A., Gratton, R. G., Lucatello, S., & Momany, Y. 2007, A&A, 464, 927 [NASA ADS] [CrossRef] [EDP Sciences] [Google Scholar]
- Castilho, B. V., Pasquini, L., Allen, D. M., et al. 2000, A&A, 361, 92 [NASA ADS] [Google Scholar]
- Cayrel, R. 1988, in The impact of very high S / N spectroscopy on Stellar Physics, ed. G. Cayrel de Strobel, & M. Spite (Kluwer), Proc. IAU Symp., 132, 345 [Google Scholar]
- Cyburt, R. H., Fields, B. D., & Olive, K. A. 2008, J. Cosmology Astropart. Phys., 11, 12 [Google Scholar]
- D’Antona, F., Caloi, V., Montalban, J., et al. 2002, A&A 395, 69 [Google Scholar]
- D’Antona, F., & Ventura, P. 2010, Proc. IAU Symp., 268, ed. C. Charbonnel, et al., 395 [Google Scholar]
- Decressin, T., Meynet, G., Charbonnel, C., et al. 2007, A&A, 464, 1029 [NASA ADS] [CrossRef] [EDP Sciences] [Google Scholar]
- D’Orazi, V., & Marino, A. F. 2010, ApJ, 716, L166 [NASA ADS] [CrossRef] [Google Scholar]
- D’Orazi, V., Lucatello, S., Gratton, R., et al. 2010, ApJ, 713, L1 [NASA ADS] [CrossRef] [Google Scholar]
- García Pérez, A. E., Asplund, M., Primas, F., Nissen, P. E., & Gustafsson, B. 2006, A&A, 451, 621 [NASA ADS] [CrossRef] [EDP Sciences] [MathSciNet] [Google Scholar]
- González Hernández, J. I., & Bonifacio, P. 2009, A&A, 497, 497 [NASA ADS] [CrossRef] [EDP Sciences] [Google Scholar]
- González Hernández, J. I., Bonifacio, P., Caffau, E., et al. 2009, A&A, 505, L13 [NASA ADS] [CrossRef] [EDP Sciences] [Google Scholar]
- Gratton, R. G., Bonifacio, P., Bragaglia, A., et al. 2001, A&A, 369, 87 [NASA ADS] [CrossRef] [EDP Sciences] [Google Scholar]
- Harding, G. A. 1962, Observatory, 82, 205 [Google Scholar]
- Harris, W. E. 1996, AJ, 112, 1487 http://physwww.physics.mcmaster.ca/~harris/mwgc.dat [NASA ADS] [CrossRef] [Google Scholar]
- Isobe, T., Feigelson, E. D., & Nelson, P. I. 1986, ApJ, 306, 490 [NASA ADS] [CrossRef] [Google Scholar]
- Korn, A. J., Grundahl, F., Richard, O., et al. 2007, ApJ, 671, 402 [NASA ADS] [CrossRef] [Google Scholar]
- Kurucz, R. 1993, ATLAS9 Stellar Atmosphere Programs and 2 km s-1 grid. Kurucz CD-ROM No. 13 (Cambridge, Mass.: Smithsonian Astrophysical Observatory), 13 [Google Scholar]
- Kurucz, R. L. 2005, MSAIS, 8, 14 [NASA ADS] [Google Scholar]
- Lavalley, M. P., Isobe, T., & Feigelson, E. D. 1992, BAAS, 24, 839 [Google Scholar]
- Lind, K., Primas, F., Charbonnel, C., Grundahl, F., & Asplund, M. 2009, A&A, 503, 545 [NASA ADS] [CrossRef] [EDP Sciences] [MathSciNet] [Google Scholar]
- Ludwig, H.-G., Caffau, E., Steffen, M., et al. 2009, Mem. Soc. Astron. Italiana, 80, 711 [Google Scholar]
- Momany, Y., Vandame, B., Zaggia, S., et al. 2001, A&A, 379, 436 [NASA ADS] [CrossRef] [EDP Sciences] [Google Scholar]
- Monaco, L., Bonifacio, P., Sbordone, L., Villanova, S., & Pancino, E. 2010, A&A, 519, L3 [NASA ADS] [CrossRef] [EDP Sciences] [Google Scholar]
- Pasquini, L., & Molaro, P. 1996, A&A, 307, 761 [NASA ADS] [Google Scholar]
- Pasquini, L., & Molaro, P. 1997, A&A, 319, 593 [NASA ADS] [Google Scholar]
- Pasquini, L., Alonso, J., Avila, G., et al. 2003, SPIE, 4841, 1682P [Google Scholar]
- Pasquini, L., Bonifacio, P., Randich, S., et al. 2004, A&A, 426, 651 [NASA ADS] [CrossRef] [EDP Sciences] [Google Scholar]
- Pasquini, L., Bonifacio, P., Molaro, P., et al. 2005, A&A, 441, 549 [NASA ADS] [CrossRef] [EDP Sciences] [Google Scholar]
- Paunzen, E., Kamp, I., Iliev, I. Kh., et al. 1999, A&A, 345, 597 [NASA ADS] [Google Scholar]
- Sbordone, L., Bonifacio, P., Castelli, F., & Kurucz, R. L. 2004, MSAIS, 5, 93 [Google Scholar]
- Sbordone, L., Bonifacio, P., Caffau, E., et al. 2010, A&A, 522, A26 [NASA ADS] [CrossRef] [EDP Sciences] [Google Scholar]
- Spite, F., & Spite, M. 1982, A&A, 115, 357 [NASA ADS] [Google Scholar]
- Spite, M., & Spite, F. 1991, A&A, 252, 689 [NASA ADS] [Google Scholar]
- Steenbock, W., & Holweger, H. 1984, A&A, 130, 319 [NASA ADS] [Google Scholar]
- Thévenin, F., Charbonnel, C., de Freitas Pacheco, J. A., et al. 2001, A&A, 373, 905 [NASA ADS] [CrossRef] [EDP Sciences] [Google Scholar]
All Figures
|
Fig. 1 Color–magnitude diagram of NGC 6752. The target stars are highlighted. Note the restricted range in magnitudes. |
| In the text | |
|
Fig. 2 Li vs. O abundance for the observed stars. |
| In the text | |
Current usage metrics show cumulative count of Article Views (full-text article views including HTML views, PDF and ePub downloads, according to the available data) and Abstracts Views on Vision4Press platform.
Data correspond to usage on the plateform after 2015. The current usage metrics is available 48-96 hours after online publication and is updated daily on week days.
Initial download of the metrics may take a while.