| Issue |
A&A
Volume 523, November-December 2010
|
|
|---|---|---|
| Article Number | A11 | |
| Number of page(s) | 16 | |
| Section | Galactic structure, stellar clusters and populations | |
| DOI | https://doi.org/10.1051/0004-6361/201015395 | |
| Published online | 10 November 2010 | |
Open clusters towards the Galactic centre: chemistry and dynamics
A VLT spectroscopic study of NGC 6192, NGC 6404, NGC 6583⋆,⋆⋆
1
INAF – Osservatorio Astrofisico di Arcetri, Largo E. Fermi 5, 50125
Firenze, Italy
e-mail: This email address is being protected from spambots. You need JavaScript enabled to view it.
;
randich;@arcetri.astro.it; This email address is being protected from spambots. You need JavaScript enabled to view it.
2
Departamento de Astronomía y Astrofísica, Pontificia Universidad
Católica de Chile, Av. Vicuna
Mackenna 4860, Casilla 306, Santiago 22, Chile
e-mail: This email address is being protected from spambots. You need JavaScript enabled to view it.
3
ESO, Alonso de Cordova 3107, Vitacura,
Santiago de Chile,
Chile
e-mail: This email address is being protected from spambots. You need JavaScript enabled to view it.
; This email address is being protected from spambots. You need JavaScript enabled to view it.
4
Department of Theoretical Physics and Astrophysics, Faculty of
Science, Masaryk University, Kotlářská 2, 611
37
Brno, Czech
Republic
5
Dipartimento di Astronomia, Universitá di Padova,
Vicolo Osservatorio 3,
35122
Padova,
Italy
6
Dipartimento di Fisica, Universitá di Perugia,
via Pascoli, 06123
Perugia,
Italy
e-mail: This email address is being protected from spambots. You need JavaScript enabled to view it.
; This email address is being protected from spambots. You need JavaScript enabled to view it.
7
Istituto Nazionale di Fisica Nucleare, sezione di
Perugia, via
Pascoli, 06123
Perugia,
Italy
Received:
14
July
2010
Accepted:
18
August
2010
Abstract
Context. In the framework of the study of the Galactic metallicity gradient and its time evolution, we present new high-resolution spectroscopic observations obtained with FLAMES and the fiber link to UVES at VLT of three open clusters (OCs) located within ~7 kpc from the Galactic centre (GC): NGC 6192, NGC 6404, NGC 6583. We also present new orbit determination for all OCs with Galactocentric distances (RGC) ≤ 8 kpc and metallicity from high-resolution spectroscopy.
Aims. We aim to investigate the slope of the inner disc metallicity gradient as traced by OCs and to discuss its implication for the chemical evolution of our Galaxy.
Methods. We have derived memberships of a group of evolved stars for each clusters, obtaining a sample of 4, 4, and 2 member stars in NGC 6192, NGC 6404, and NGC 6583, respectively. Using standard LTE analysis we derived stellar parameters and abundance ratios for the iron-peak elements Fe, Ni, Cr, and for the α-elements Al, Mg, Si, Ti, Ca. We calculated the orbits of the OCs currently located within 8 kpc from the GC, and discuss their implication on the present-time radial location.
Results. The average metallicities of the three clusters are all oversolar: [Fe/H] = + 0.12 ± 0.04 (NGC 6192), + 0.11 ± 0.04 (NGC 6404), + 0.37 ± 0.03 (NGC 6583). They are in qualitative agreement with their Galactocentric distances, because they are all internal OCs, and expected to be more metal rich than the solar neighbourhood. The abundance ratios of the other elements over iron [X/Fe] are consistent with solar values.
Conclusions. The clusters we have analysed confirm, together with other OC and Cepheid data, a steep gradient in the inner disc, a signature of an evolutionary rate that is different from the one in the outer disc.
Key words: Galaxy: abundances / Galaxy: evolution / open clusters and associations: individual: NGC 6192 / open clusters and associations: individual: NGC 6404 / open clusters and associations: individual: NGC 6583
Based on observations obtained at the ESO Based on spectroscopic optical observations made with ESO telescope VLT, program: ID: 083.D-0682, Title: The Galactic radial metallicity gradient in the inner disc.
Tables A.1 to A.4 are only available in electronic form at the CDS via anonymous ftp to cdsarc.u-strasbg.fr (130.79.128.5) or via http://cdsarc.u-strasbg.fr/viz-bin/qcat?J/A+A/523/A11
© ESO, 2010
1. Introduction
Theoretical models of chemical evolution allow us to understand the processes involved in the formation and evolution of galaxies, and in particular of the Milky Way (MW). They depend on many variables, which include the star-formation rate (SFR), the initial mass function (IMF), radial inflows and outflows of primordial and/or pre-enriched gas, the star-formation law and possible thresholds in the gas density for the formation of stars. To decrease the number of degrees of freedom they need many strong observational constraints, such as those provided by the radial metallicity gradient and its evolution with time.
In spite of many observational and theoretical efforts, various questions remain open even in our Galaxy, where plenty of observations based on 8m-class telescopes of stellar populations of different ages are available. We are far from obtaining a firm result about the shape of the metallicity gradient in particular in the inner disc and at large Galactocentric distances, and about its time evolution.
Contrasting results about the time evolution appear from the comparison of abundances of planetary nebulae of different ages (cf. Maciel et al. 2007; Stanghellini & Haywood 2010), Cepheids (e.g., Pedicelli et al. 2009; Andriewsky et al. 2002), HII regions (e.g., Rood et al. 2007) and blue supergiant stars (e.g., Luck et al. 1989; Daflon & Cunha 2004).
In this framework, the determination of the chemical composition of stars belonging to open clusters (OCs) probably represents the best tool to study the behaviour of iron and other elements across the Galactic disc. Open clusters are indeed populous, coeval groups of stars with a similar chemical composition; they are located all over the Galactic disc and span large ranges of ages and metallicities; furthermore, the estimate of their age and distance is affected by much smaller uncertainties than those of field stars.
The first determination of the Galactic metallicity gradient with the use of OC metallicities was performed by Janes (1979). He based his study on a sample of OCs covering the Galactocentric distance (RGC) range 8 − 14 kpc and on metallicities ([Fe/H]) estimated from photometry, deriving a gradient of −0.075 ± 0.034 dex kpc-1. Several subsequent studies were performed with a variety of techniques and larger samples of clusters (Friel & Janes 1993; Friel 1995; Twarog et al. 1997; Carraro et al. 1998; Friel et al. 2002; Chen et al. 2003), all agreeing on a negative slope between −0.07 and −0.1 dex kpc-1.
More recently, with the advent of high-resolution spectrographs on 8m-class telescopes, it has become possible to derive more secure [Fe/H] estimates, and also to extend metallicity determinations to OCs in the outer disc, beyond 15 kpc from the Galactic centre (Carraro et al. 2004; Carretta et al. 2004; Yong et al. 2005; Sestito et al. 2006, 2008). These studies have confirmed the steep slope in the gradient for 7 kpc < RGC < 11 kpc and have shown that the distribution becomes flatter for Galactocentric distances (RGC) above 11 − 12 kpc (cf. Magrini et al. 2009, hereafter M09, but see Pancino et al. 2010 for a different view).
However, in spite of the significant progresses so far achieved, a very interesting radial region, RGC < 7 kpc, has been neglected during the past spectroscopic studies of OCs. This radial region is particularly interesting because from Cepheid metallicities, several authors (e.g., Andrievsky et al. 2002; Luck et al. 2006; Pedicelli et al. 2009) have shown that there is yet another change of slope of the gradient. From ~4 to ~7 − 8 kpc (values vary slightly in different papers) the gradient is much steeper than in the outer regions. The value of the slope of the very inner (RGC < 7 kpc) gradient for iron varies from −0.13 to −0.15 dex kpc-1. The questions are whether this holds true also for OCs, whether this change of slope is time-dependent (and OCs can tell us this because they span a large age range), and where the metallicity stops increasing because of the Galactic bulge. So far only one cluster at a distance from the GC less than 7 kpc has an available metallicity determination (M11, RGC = 6.86 kpc, age = 200 Myr, [Fe/H] = +0.17 – Gonzales & Wallerstein 2000).
Several studies and chemical evolution models have tried to explain the changes of slope in the abundance gradient, among them, e.g. i) the study of dynamical effects of corotation resonance (located close to the solar Galactocentric distance) by Lépine et al. (2003) which is assumed to be the main cause of the formation of the bimodal radial distribution of metallicity; ii) the model by M09 in which the inner disc is formed inside-out by the rapid dynamical collapse of the halo and the outer disc is formed at a lower rate, from a “reservoir” of gas; iii) the model by Colavitti et al. (2009) where the inside-out disc formation and the density threshold for star-formation are both necessary ingredients to reproduce the change of slope; iv) the model by Fu et al. (2009) where the star-formation efficiency is inversely proportional to the distance from the galaxy centre.
The predictions of these models are also different concerning the inner gradient. They all reproduce one or several changes of slope in radial gradient but at different RGC: for example, the model adopted in the study by Lépine et al. (2003) has a flattening of the gradient for RGC > R⊙, while the model by M09 produces a gradient with an outer plateau (RGC > 11 − 12 kpc), and a very steep gradient for RGC < 7 kpc. Finally, the best model by Colavitti et al. (2009) has a more pronounced gradient in the inner disc for RGC < 7 − 8 kpc, while the models by Fu et al. (2009) show a change of slope in the inner Galaxy for RGC < 2 − 3 kpc.
The aim of this paper is to extend the sample of OCs at RGC < 7 kpc, thus providing constraints suitable to distinguish the roles of different model parameters in inducing changes into the chemical gradient and its slope such as, e.g., the importance the dynamical collapse of the halo in the inner regions with respect to the accretion owing to infall from the intergalactic medium and from mergers.
The present paper is structured as follows: in Sect. 2 the three OCs under analysis are presented. In Sect. 3 we describe the observations and data reduction. In Sect. 4 we show the abundance analysis, while in Sect. 5 we present our results and compare them with the inner disc giant stars. In Sect. 6 we discuss their implication in the shape of the metallicity gradient and in the chemical evolution of the Galaxy. In Sect. 7 we present orbit calculations and their consequences for the metallicity gradient. Finally, in Sect. 8 we give our summary and conclusions.
2. Target clusters
Our sample includes three of the most internal open clusters (age ≤ 1 Gyr), whose evolved stars can be studied with a ground-based 8m-class telescope. They are NGC 6192, NGC 6404, and NGC 6583.
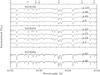 |
Fig. 1 Region of the normalized spectra of member stars in NGC 6192, NGC 6404, NGC 6583. |
Several photometric studies of NGC 6192 exist in the literature. These studies derived different reddening values though, consequently, there are discrepancies in ages and distances. The reddening values in the literature range from E(B − V) = 0.26 (Kilambi & Fitzgerald 1983; King 1987) to 0.68 (Kjeldsen & Frandsen 1991), with the most recent estimate by Paunzen et al. (2003) giving E(B − V) = 0.54. The related estimates of age range from ~ 1 Gyr to 0.09 Gyr, and those for the distance to the Sun from ~ 1 kpc to 1.7 kpc. Paunzen et al. (2003) also estimated the metallicity of the cluster: [Fe/H] = −0.10 ± 0.09. Loktin et al. (2001) revised the original data of Kjeldsen & Frandsen (1991), and determined a reddening of E(B − V) = 0.64, a distance of 1.5 kpc and an age of 0.13 Gyr. Five stars of NGC 6192 (Nos. 9, 45, 91, 96 and 137) have CORAVEL radial velocities in the narrow range −8.8 kms-1 < Vr < − 6.4 kms-1, therefore appearing to be red giant members of NGC 6192 (Clarìa et al. 2006). Clarìa et al. (2006) also estimated the age (0.18 Gyr), the distance (1.5 kpc), and the DDO abundance index finding a cluster metallicity [Fe/H] = +0.29 ± 0.06.
The clusters NGC 6404 and NGC 6583 have been studied by Carraro et al. (2005) with CCD photometry. From isochrone fitting they derived the main parameters of the two clusters. They found that NGC 6404 is 0.5 Gyr old and located at a distance of 1.7 kpc from the Sun towards the Galactic Centre direction, while NGC 6583 is 1.0 Gyr old and at 2.1 kpc. The E(B − V) values are 0.92 ± 0.05 and 0.51 ± 0.05 for NGC 6404 and NGC 6583, respectively. For both clusters, solar metallicity isochrones provide a reasonable fit across the whole CMDs. No radial velocities are available for the stars of these clusters.
In Table 1 we report the cluster parameters and references. We also calculated the Galactocentric distance, RGC, adopting a distance of the Sun from the Galactic centre of 8.5 kpc.
Cluster parameters from the literature.
3. Observations and data reduction
The three OCs were all observed with the multi-object instrument FLAMES on VLT/UT2 (ESO, Chile; Pasquini et al. 2000). The fibers with UVES allowed us to obtain high-resolution spectra (R = 47000), for Red Giant Branch (RGB) stars, for red supergiant stars and for stars in the clump. The clusters were observed in service mode in April, July, and August 2009, using a single configuration for each cluster. The cross disperser CD3 was used, resulting in a wavelength range ~ 4750 − 6800 Å. A log of observations (date, centre of field, date, observing time of each exposure, grating, number of exposures, number of stars) is given in Table 2. The spectra were reduced by ESO personnel using the dedicated pipeline. We analysed the 1-d, wavelength-calibrated spectra using standard IRAF1 packages and the spectre package by Sneden et al. (Fitzpatrick & Sneden 1987). One fiber for configuration was used to register the sky value, but the correction was negligible. In Fig. 1 we show a region of the spectra of stars in NGC 6192, NGC 6404, NGC 6583 (only member stars, see below). In Figs. 2 − 4 we present the colour − magnitude diagrams of the three clusters. The stars observed spectroscopically are marked with filled (red) circles. Stars that turned out to be non-members are also marked with a cross.
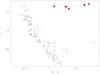 |
Fig. 2 Colour–magnitude diagram of NGC 6192. The observed stars are marked with (red) filled circles. Stars that turned out to be non-members are also marked with a cross. The photometry is from Clarìa et al. (2006). |
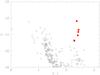 |
Fig. 3 Colour–magnitude diagram of NGC 6404. Symbols as in Fig. 2. The photometry is from Carraro et al. (2005). |
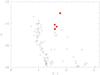 |
Fig. 4 Colour–magnitude diagram of NGC 6583. Symbols as in Fig. 2. The photometry is from Carraro et al. (2005). |
Log of the observations.
First of all, we measured the radial velocities (RVs) using rvidlines on several tens of metallic lines on the individual spectra. Using the RVs measured on the single lines, the task rvidlines produces an average radial velocity with its rms dispersion. We measured the radial velocity of each star on each individual spectrum, correcting them for the contribution of the different heliocentric velocities during each night of observations. The uncertainty associated to the RVs of each star, corrected for the heliocentric component, is obtained from the rms value, after averaging estimates from different exposures; it turns out to be 0.5 km s-1.
Finally we combined the spectra obtained during the different exposures with the task scombine.
In Tables 3 − 5 we show the available photometry of the observed stars, the signal-to-noise ratio (S / N), the RVs, corrected for the heliocentric velocity, and the membership derived on the basis of the RVs (M stands for “member”, NM for “non member”). For NGC 6192 the identification numbers and UBV magnitudes were taken from Claría et al. (2006), for NGC 6404 and NGC 6583 the ID numbers and VI photometry are from Carraro et al. (2005). For all clusters the JHK photometry is from the 2MASS catalogue (Skrutskie et al. 2006). There are previous radial velocity measurements for the evolved stars of NGC 6192 (Clarìa et al. 2006). We found good agreement with their values. Their average velocity for five member stars, including two binary stars (No. 91 and 96) is −7.7 ± 0.38 km s-1. The average velocity of our member sample is −8.9 ± 0.7 km s-1, in good agreement with the average velocity computed for the same stars using the Clarìa et al.’s measurements, −8.4 ± 0.5 km s-1.
Data of observed stars in NGC 6192.
Data of observed stars in NGC 6404.
Data of observed stars in NGC 6583.
Previous radial velocity measurements are not available for NGC 6404 and NGC 6583. From our spectroscopy, the average velocities of member stars are 10.6 ± 1.1 km s-1 (4 stars) and −3.0 ± 0.4 km s-1 (2 stars) form NGC 6404 and NGC 6583, respectively.
For our analysis below, we therefore exclude stars Nos. 4 and 274 of NGC 6192, No. 72 of NGC 6404, and Nos. 12 and 82 of NGC 6583 on the basis of their non-membership.
4. Abundance analysis
The method of analysis is very similar to that adopted in the papers by Randich et al. (2006) and Sestito et al. (2006, 2008), based on measured equivalent width (EWs) and on the use of the code MOOG. In this paper the analysis of chemical abundances was carried out with the version 2002 of the spectral programme MOOG (Sneden 1973) and using model atmospheres by Kurucz (1993). Like all the commonly used spectral analysis codes, MOOG performs a local thermodynamic equilibrium (LTE) analysis.
4.1. Line list and equivalent widths
Spectral lines to be used for the analysis of Fe i, Fe ii and other elements (Mg, Al, Si, Ca, Ti, Cr, Ni) both in the Sun and in our giant stars were selected from the line list of Gratton et al. (2003) and Randich et al. (2006). The total list includes 161 and 14 features for Fe i and Fe ii, respectively, and several features of Al i, Mg i, Ca i, Si i, Ti i, Cr i, Ni i. In order to have a strictly differential analysis, we selected the same spectral range for the Sun and for our giant stars.
We used the task eq in SPECTRE to normalize small portions of the spectrum (~40 Å) and to interactively measure the EWs of the spectral lines by a Gaussian fitting. Strong lines (EW > 150 mÅ) have been discarded, because they could be saturated and they are critically sensitive to the microturbulence value, thus a more detailed treatment of damping would be necessary to fit their line wings. We also discarded faint lines with EW < 20 mÅ because of the large uncertainties in their measurements. The values of EWs are available in electronic Tables A.1−A.3, where the first two columns list the wavelengths and element, and the others show the corresponding EW for each star.
4.2. Atomic parameters and solar analysis
We adopted the oscillator strengths (log gf) of Sestito et al. (2006), except for those of Al obtained by Randich et al. (2006) from inverse solar analysis. Radiative and Stark broadening are treated in a standard way in MOOG. We used the Unsöld (1955) approximation for collisional broadening because this choice does not affect the differential analysis with respect to the Sun as discussed by Paulson et al. (2003). In addition, very strong lines that are most affected by the treatment of damping have been excluded from our analysis. The major difference with the previous studies of Sestito and collaborators is indeed in the different treatment of damping. Here we have chosen a more homogeneous treatment for all lines using the Unsöld approximation with respect to the procedure by Sestito et al., who adopted two different types of damping coefficients, those of Barklem et al. (2000), when available, otherwise the coefficients of Unsöld, multiplied by an enhancement factor. In order to check the compatibility of the two approaches, we considered the EWs of two stars in NGC 6253 (No. 023498 and 024707 in Table 4 of Sestito et al. 2007) with stellar parameters similar to those of our stars. We recalculated [Fe/H] using our procedure, finding for No. 023498 and No. 024707 the [Fe/H] values + 0.30 and + 0.40, respectively. They compare well with the values quoted in the original paper, i.e., + 0.32 and + 0.39, respectively.
The first step is to derive the solar abundances of Fe and other elements, in order to fix the zero points of the abundance scale to minimize errors in the results. The solar spectrum was obtained with the same UVES setup of our observations. The line list for the Sun is available in electronic form (Table A.4). The table includes wavelengths, name of the element, the excitation potential EP, log gf, and measured EW in the solar spectrum. We computed the elemental abundances for the Sun by adopting the following effective temperature, surface gravity, and microturbulence velocity: Teff = 5770 K, log g = 4.44, and ξ = 1.1 km s-1. In our analysis neither log n(Fe i) vs. EW nor log n(Fe i) vs. EP show any trend, implying that both the assumed microturbulence and effective temperature are correct. log n(Fe i) and log n(Fe ii) are consistent within the errors, indicating also a correct choice of the gravity value. Output solar abundances are listed in Table 6 together with those from Anders & Grevesse (1989) which are used as input in MOOG. Our Fe i abundance is slightly lower than that measured by Anders & Grevesse (1989). The origin of this discrepancy is probably due to the adopted log gf, but it would not affect the remainder of the analysis because it is strictly differential.
4.3. Stellar parameters
We initially estimate effective temperatures (Teff) and gravities from photometry. We used the B − V and V − K vs. Teff calibrations by Alonso et al. (1999) for the RGB stars of NGC 6192, whereas we used V − K vs. Teff calibrations by Levesque et al. (2006) for the post-RGB stars of NGC 6404 and NGC 6583. Surface gravities were derived using the expression  where M is the mass and Mbol the bolometric magnitude (with Mbol ⊙ = 4.72), Teff is derived as described above (with Teff ⊙ = 5770 K), and log g⊙ = 4.44. The apparent magnitudes are transformed into absolute magnitudes using the distances and reddening values in Table 1. The bolometric corrections to be applied to MV in order to obtain Mbol are taken from Alonso et al. (1999) for giant stars and from Levesque et al. (2006) for post-RGB stars. The masses were derived from the isochrones of Girardi et al. (2000) using the estimated ages of each cluster (see Table 1). They are: 4.1 M⊙ for NGC 6192 (age ~ 0.18 Gyr), 3.0 M⊙ for NGC 6404 (age ~ 0.5 Gyr), 2.0 M⊙ for NGC 6583 (age ~ 1 Gyr).
The photometric Teff and log g values are the starting values. For NGC 6192, where two photometric estimates of Teff are available, we used their average as initial value. We optimised their values during the spectral analysis, employing the driver abfind in moog to compute Fe abundances for the stars: the final Teff estimate was chosen in order to eliminate possible trends in [Fe/H] vs. EP. The surface gravity was optimised by assuming the ionization equilibrium condition, i.e. log n(Fe ii) = log n(Fe i). Then, if necessary Teff was re-adjusted in order to satisfy both the ionization and excitation equilibria. The other stellar parameter is the microturbulence ξ, which was optimized by minimizing the slope of the relationship between Fe i/H and the observed EWs.
The abundance values for each line were determined with the measured EWs and stellar parameters listed in Table 7. Final abundances for each star and each element were determined as the mean abundance from the different lines. Because of the large number of lines available, a 1σ clipping was performed for iron as the first step before the optimisation of the stellar parameters. As already mentioned, [Fe/H] and [X/Fe] ratios for each star were determined differentially with respect to the solar abundances listed in Table 6.
Photometric and spectroscopic stellar parameters and [Fe/H] abundances.
The derived photometric and spectroscopic stellar parameters are shown in Table 7: Col. 1 presents the star ID, Cols. 2−4 the photometric Teff and log g values, and Cols. 5−7 the spectroscopic Teff, log g and ξ estimates. Finally, we present in Cols. 8 − 9 the iron abundance and its dispersion are shown, whereas in Col. 10 the number of Fe i and Fe ii, in parenthesis, lines available for the spectroscopic analysis.
For NGC 6192 we found a reasonable agreement between the photometric and spectroscopic parameters, while for NGC 6404 and NGC 6583 the differences are important. This discrepancy is derived from the large uncertainty on the reddening value and on the distance, due to the location of these clusters towards the GC. Indeed, as far as Teff estimates of these two clusters are concerned, we note that in order to satisfy the excitation equilibrium we had to consider Teff values higher than those derived from the photometric relations (see as an example Fig. 5). These differences can be reduced by assuming slightly higher values of the reddening with respect to those measured by Carraro et al. (2005) through a photometric analysis. For both clusters, a value of ΔAV higher than the one quoted in Table 1 by 0.60 would reduce the difference among photometric and spectroscopic Teff. The remaining differences in surface gravities can be attributed to several factors, such as errors in distance moduli.
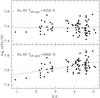 |
Fig. 5 log n(Fe/H) vs. E.P. for star No. 40 in NGC 6404 with two Teff: 4060 K as derived from photometry and 4250 K as derived from the fulfillment of excitation equilibrium with the spectroscopic analysis with MOOG. The two continuous lines are the mean least-square fits to the data performed by MOOG. |
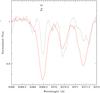 |
Fig. 6 Region of the normalized spectra of member stars in NGC 6404 centred in the [FeII] line at 6369.45 Å. The continuous (red) spectrum is of star No. 5, which has a very low gravity, while the dotted line is the spectrum of star No. 45 in NGC 6192, which has similar temperature and metallicity, but higher gravity. |
4.3.1. Evolved stars in NGC 6404 and NGC 6583
The criterion of selection of evolved stars to be spectroscopically investigated is based on their location in the colour − magnitude diagram. Because of different distance and reddening of the three clusters we did not select stars in the same evolutionary phase in the three OCs. In particular, the high reddening towards NGC 6404 and NGC 6583 did not allow us to observe red clump giant stars, which lie at V > 16. The evolved stars we have selected in NGC 6404 and NGC 6583 for our spectroscopic analysis (see Figs. 3 and 4) are indeed in a later evolutionary stage with respect to the RGB phase, moving towards the asymptotic giant branch phase. The most extreme example is star No. 5 in NGC 6404 (in the colour − magnitude diagram of Fig. 3 this is the star with the lowest V magnitude). This star has an extremely low surface gravity combined with a high effective temperature. To show the reliability of our surface gravity measurement we plot in Fig. 6 a portion of the normalized spectra located around a Fe ii line of star No. 5 of NGC 6404 and of a star with a similar effective temperature, but with higher gravity, No. 45 in NGC 6192. The EWs of Fe ii lines are inversely related to the surface gravity, thus lower gravity implies larger EWs of Fe ii. This is the case for star No. 5. which shows very strong Fe ii lines, for which we measured log g = 1 (see Table 7). Also the high microturbulence of star No. 5 (2.6 km s-1) agrees with its advanced evolutionary phase, which is comparable with the microturbulence of red supergiant stars ( ~ 3 km s-1, cf. Davies et al. 2009).
4.4. Error evaluation
As is usually done, we considered three sources of errors in our analysis: i) errors in measurements of the EWs; ii) errors in atomic parameters; iii) errors due to uncertainties in stellar parameters.
We estimated the errors in the following way. We consider the standard deviation (σ1) around the mean abundance derived by individual lines as representative of the errors in EWs. We show the rms uncertainties in Table 7 for Fe i and Fe ii and in Table 9 for the other elements. We consider as negligible the errors in atomic parameters because they are minimized by the differential analysis performed with respect to the Sun. We estimated internal errors due to uncertainties in stellar parameters (σ2) by varying each parameter separately, while leaving the other two unchanged. Following the error analysis by Randich et al. (2006), we assumed random uncertainties of ± 70 K, ± 0.15 km s-1, and ± 0.25 dex in Teff, ξ and log g, respectively. We varied the stellar parameters of the warmest and coolest stars of our sample, No. 46 of NGC 6583, and No. 40 of NGC 6404, respectively. The variations in the abundance ratios due to changes in the stellar parameters are shown in Table 8. Then we assumed the maximum variation reported in Table 8 for each element as an estimate of the error owing to the uncertainties on the stellar parameters.
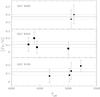 |
Fig. 7 [Fe/H] versus the effective temperature in the studied member stars of the three clusters: NGC 6583 (filled triangles), NGC 6404 (filled circles), NGC 6192 (filled squares). |
Random errors owing to uncertainties in stellar parameters.
5. Results
5.1. Iron
[Fe/H] abundances and rms values for the sample stars are listed in Cols. 8 and 9 of Table 7, while in Fig. 7 we show [Fe/H] as a function of the effective temperature. No notable trends of [Fe/H] as a function of Teff are present. The average metallicities for the three clusters are listed in Table 7. They are all oversolar: [Fe/H]= + 0.12 ± 0.04 (NGC 6192), + 0.11 ± 0.04 (NGC 6404), + 0.37 ± 0.03 (NGC 6583).
Because our sample is made of OCs from the inner Galaxy, they are expected to be richer in metals than the solar neighbourhood, so that the estimated metallicities are qualitatively agree with their Galactocentric distances.
5.2. Other elements
The [X/Fe] ratios for Mg, Al, Si, Ca, Ti (α-elements), Cr and Ni (iron-peak elements) are listed in Table 9. The number of lines available for each element in each star is shown in parenthesis. Because of the very few lines available for Mg and Al, we computed their ratios over iron line by line, and then calculated the average. Errors on [X/Fe] values are the quadratic sum of the error σ1 for [Fe/H] and [X/H] values.
Mean abundance ratios [X/Fe] together with 1-σ standard deviations are listed at the end of each group of stars in Table 9. No evident trends of [X/Fe] ratios with [Fe/H] are present. NGC 6404 shows a larger scatter than the other clusters owing to the lower S / N of its spectra. The ratios of α-elements to Fe are close to solar in the sample clusters, with the exception of [Ca/Fe] in NGC 6192, which is slightly lower than the solar value, ~ −0.2. Also the Fe-peak elements are solar, with [Cr/Fe] slightly below zero for NGC 6404 (~ −0.2). The cluster NGC 6404 shows a larger scatter than the other clusters owing to the lower S/N of its spectra.
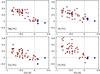 |
Fig. 8 α- elements Mg, Ca, Si, Ti over Fe ratios of our target clusters (big blue filled pentagon) with the same ratios recently measured by Bensby et al. (2010) for inner disc giants (small red filled circles). |
[X/Fe] abundances and averages. Errors are the quadratic sum of σ1 on [X/H] and on [Fe/H].
In Fig. 8 we compare the α-elements Mg, Ca, Si, and Ti over Fe ratios of our target clusters with the same ratios recently measured by Bensby et al. (2010) for inner disc giants. The latter are located at Galactocentric distances of 4 − 7 kpc, which is consistent with the range spanned by our targets. The three clusters represent the metal-rich extension of the mean trend of field giants, but they do follow the trend quite smoothly. Only the most metal-rich cluster, NGC 6583, is possibly slightly over-enhanced in Ca and Ti. We interpret this behaviour as evidence that clusters and field stars belong to the same population, i.e., they have formed in the same, though extended, star-formation episode. Note that the field stars in Bensby et al. (2010) are on average more evolved (mean log g = 1.5) than our cluster stars, therefore they are presumably slightly older, which is consistent with the higher metallicity of the (younger) cluster stars.
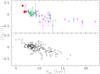 |
Fig. 9 Iron gradient: OCs of different ages (top panel) and Cepheids (bottom panel). Empty circles (green) are OCs with age ≤ 0.8 Gyr, triangles (blue) with 0.8 Gyr < age ≤ 4 Gyr, and squares (magenta) with age > 4 Gyr. The three large filled circles (red) are the data presented in this paper. The black small empty circles in the lower panel are [Fe/H] of Cepheids by Pedicelli et al. (2009). |
6. The metallicity gradient of open clusters
The radial metallicity gradient preserves the signature of the processes of galaxy formation and evolution. Open clusters are among the best Galactic stellar populations to study its shape and are unique tools to investigate its time evolution. For this purpose, a large sample of homogeneous data in terms of metallicity, age, and distance is necessary. In this respect, our starting point is the database of OCs by M09, which is a collection of elemental abundances, ages, and distances derived by several authors with high-resolution spectroscopy. In the database, the RGC were taken from Friel et al. (1995, 2002, 2006) or calculated using the cluster distance given in the original papers and a solar Galactocentric distance of 8.5 kpc, consistent with Friel et al. works. The ages for the clusters older than 0.5 − 0.6 Gyr were calculated in an homogeneous way using the morphological age indicator δV (Phelps et al. 1994) and the metallicity-dependent calibration of Salaris et al. (2004). For the younger clusters, M09 used the most recent age determinations available in the literature, such as those obtained with the lithium-depletion boundary method. We updated the database of M09 with the latest high-resolution spectroscopic observations and with the results of the present work. The ages of the new clusters (only those older than ~0.6 Gyr) have been recomputed homogeneously using the same method adopted by M09. For most of the sample clusters δV is available from the literature; when it was unavailable, we obtained this quantity from available colour − magnitude diagrams.
From the literature we included seven young clusters, namely NGC 6281 (0.3 Gyr), NGC 3532 (0.35 Gyr), IC 2714 (age ~ 0.4 Gyr), NGC 2099 (0.4 Gyr), NGC 6633 (0.45 Gyr), NGC 1883 (0.65 Gyr), IC 4756 (0.79 Gyr), and seven intermediate-age clusters NGC 5822 (1.16 Gyr), NGC 1817 (1.12 Gyr), Cr 110 (1.0 Gyr), Tombaugh 2 (2.13 Gyr), NGC 6939 (2.05 Gyr), NGC 2158 (1.9 Gyr), and NGC 2420 (2.2 Gyr), and one old cluster Be 39 (7 Gyr). Abundance determinations are from Smiljanic et al. (2009) (IC 2714, IC 4756, NGC 3532, NGC 6281, NGC 6633), Jacobson et al. (2009) (NGC 1817, NGC 1883), Villanova et al. (2010) (To 2), Pace et al. (2010) (NGC 5882), Pancino et al. (2010) (Cr 110, NGC 2099, NGC 2420), Friel et al. (2010) (Be 39). We also updated the M09 database with the results by Friel et al. (2010) for Be 31. The clusters NGC 6404 and NGC 6192 are too young to be calibrated with the Salaris et al.’s relationship, while the age of NGC 6583, the oldest cluster of our sample, computed with the morphological age indicator δV is ~ 1 Gyr, in agreement with the age given by Carraro et al. (2005) with isochrone fitting.
6.1. The inner gradient
The behaviour of the metallicity gradient in the inner part of the Galactic disc (RGC < 8 kpc) is still an open issue. The inner part of the disc is of paramount importance because it connects the chemistry of the disc with that of the bulge.
Several studies identified one or more changes of slope in the [Fe/H] radial distribution. For OCs, Twarog et al. (1997) firstly identified a break in the [Fe/H] radial distribution of their cluster sample at RGC ~ 10 kpc and this was recognized as the first indication of a transition between the inner and outer Milky Way discs (cf. Friel et al. 2010). The occurrence of a steepening of the metallicity gradient in the inner disc with respect to the outer regions was also suggested by Andrievsky et al. (2002) who found two changes of slope in the radial gradient at RGC ~ 11 − 12 kpc and RGC ~ 7 kpc using Cepheid abundances. The large compilation of Cepheid data by Pedicelli et al. (2009) shows instead a smooth and steady increase in the slope for RGC < 8 kpc, without any further steepening towards the GC. They found an iron gradient in the inner disc (RGC < 8 kpc) more than a factor of three steeper (−0.130 ± 0.015 dex kpc-1) than in the outer disc ( − 0.042 ± 0.004 dex kpc-1). Neither the metallicity gradients of planetary nebulae (PNe), nor the one of the HII regions show any evident steepening in the inner regions (cf. Stanghellini & Haywood 2010; Deharveng 2000). For the PNe and HII regions, gradients of oxygen and other α-element (i.e. S/H, Ne/H, Ar/H) were derived instead of that of iron; thus a direct comparison is more difficult. In addition, few of these objects have been studied at RGC > 15 kpc.
In Fig. 9 we compare the iron gradient of OCs with that of Cepheids (data from Pedicelli et al. 2009) in the radial range 4 kpc < RGC < 23 kpc. First of all, the metallicity scales of the two populations agree very well. The gradients of young OCs and of Cepheids compare very well in the whole radial range. A weighted mean least-square fit of the whole sample of young OCs (age ≤ 0.8 Gyr) gives for RGC ≤ 8 kpc a slope of − 0.137 ± 0.041 dex kpc-1 and for RGC > 8 kpc − 0.033 ± 0.005 dex kpc-1, which agree with the values − 0.130 ± 0.015 dex kpc-1 and − 0.042 ± 0.004 dex kpc-1 of Pedicelli et al. (2009). The main differences between young (Cepheids and young OCs) and old (intermediate-age and old OCs) stellar populations reside in the outer disc, where several old and intermediate-age clusters are observed. Their radial metallicity distribution becomes flat at large Galactocentric radii, while this effect is not appreciable in the young populations owing to the lack of measurements.
Both populations show a clear steepening of the gradient at similar values of RGC. However, because of the high dispersion at each RGC, it is difficult to identify the exact radius where the change of slope happens.
As described in the Introduction, several chemical evolution models can reproduce changes of slope in the abundance gradient (e.g., Lepine et al. 2003, M09; Colavitti et al. 2009; Fu et al. 2009) with different assumptions and hypothesis. Without entering into the model details, the observational evidence of a steeper inner gradient suggests that the inner disc has evolved at a different rate with respect to the outer disc. Many reasons can be at the origin of this; among others we recall the predominance of the halo collapse in the inner disc, the effect of the corotation resonance, the existence of density threshold in star-formation, and/or radial varying star-formation efficiency. Combinations of these causes are also likely to operate together. However, before a definitive interpretation in terms of models could be given, the data still demand more investigations and analysis. For example, there is still very little information about the possible azimuthal variations of the gradient (e.g., Luck et al. 2006; Stanghellini & Haywood 2010).
6.2. The time-evolution of the inner gradient
In Fig. 10 we show the iron gradient in the very inner regions, between 0 and 8 kpc form the GC. For RGC < 4 kpc OC and Cepheid metallicities are not available, and we do not show metallicity measurements for the disc populations because of the difficulty to distinguish between disc and bulge stars. We compare the inner gradient traced by young populations, such as Cepheids and young clusters, with the gradient of older OCs. The [Fe/H] gradient of young clusters agrees with the Cepheid one, as expected for populations with similar ages and both NGC 6192 and NGC 6404 agree perfectly with respect to the average abundance of Cepheids.
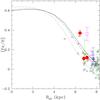 |
Fig. 10 Disc inner gradient (0 kpc < RGC < 8 kpc). Symbols for OCs and Cepheids are as in Fig. 9. We show also the model curves of M09 at different epochs: present-time (continuous line), 2 Gyr ago (dashed curve), 6 Gyr ago (dotted curve). |
On the other hand, the [Fe/H] values of some old and intermediate-age OCs are surprisingly higher than for younger clusters; this is true in particular for the two innermost intermediate-age/old OCs: NGC 6583 (from this paper) and NGC 6253 (Sestito et al. 2007). The predictions of ‘classical’ evolution models for the Galactic disc, assuming that the disc itself is formed by the collapse of the halo (with one or more processes of infall) and radial mixing is not considered, are in this respect well known. They imply that at each radius the metallicity increases with time, so that the older the population considered, the lower the metallicity.
This is shown in Fig. 10 for the chemical evolution model by M09 (see also, e.g., several cases of the two-infall model shown in Fig. 11 by Chiappini et al. 2001). The M09’s model reproduces only the disc evolution and does not include the bulge. The three curves represent the iron gradient predicted by the model at three different epochs in the Galaxy lifetime (present-time, 2 Gyr ago, 6 Gyr ago). For RGC ≥ 4 kpc the iron abundance decreases as the Galactocentric radius increases; at a given radius the metallicity at early epochs is lower than at present. Only in the very inner region, RGC < 3 kpc, the gradient at early epochs and the gradient at present time are inverted, i.e. old population are slightly metal richer than young ones. This is due to the almost complete conversion of the gas into stars already at early epochs, and to the subsequent dilution at recent times with gas expelled during the final phases of low-mass star evolution.
One could imagine to change the model parameters in order to move the Galactocentric radius of the point of inversion of the metallicity gradient, and to reproduce the high metallicity of some of the old and intermediate-age clusters in the inner Galaxy. The model parameter that governs the position of the crossing-point is primarily the scale-length of the infall law (see M09 for detail). Varying the scale-length of the exponential law driving the infall of gas from the halo, we can produce a more or less extended inner metallicity plateau. However, reasonable values of the scale-length can vary the location only from ~ 2 to ~ 4 kpc form the GC, and cannot reproduce the position in the [Fe/H] versus RGC plot of clusters like NGC 6583 and NGC 6253.
The location of these two clusters needs different explanations, such as a different place of birth with respect to their present-time location or an incorrect (over-estimated) distance estimates. Non-circular orbits and/or radial migration of populations (stars, but also gas) can explain the large scatter of [Fe/H] at each radius and at each age in the Galactic disc (see, e.g., the chemical evolution model of Schönrich & Binney 2009). Indeed, not only clusters, but also field stars could have significantly non-circular orbits orbits, with apocentric and pericentric distances differing by more than ~ 1 kpc. To verify this hypothesis, we have analysed the orbits of the complete sample of inner disc OCs.
7. The orbits of the inner OCs
In this section we describe the results of orbit calculations for a sample of inner-disc clusters. Firstly, we illustrate how absolute proper motion components are derived, and then we calculate clusters’ orbits adopting a variety of Galactic potential models. The main aim is to investigate whether, for clusters located inside the solar ring, the bar can significantly affect their orbit or not. For this result, among the various models, we will focus only on the bar-less Allen & Santillan (1991) model and the Ferrers n = 2 model (Binney & Tremaine 2008), which has the maximum bar strength. Finally, we will use the orbital parameters to address the effect of the orbital motion on the chemical evolution of these clusters. This exercise is a classical one. Examples are in Carraro & Chiosi (1994), while open cluster orbits have been calculated several times in the past (see e.g. Bellini et al. 2010; or Carraro et al. 2006, for recent examples). However, in all past cases, no effect of the bar could be seen because of the mean large distance of the clusters from the GC and the relatively small sphere of influence of the bar. For the clusters under analysis here, no previous attempts have been done to derive their orbits.
7.1. Proper motion components
In order to obtain the clusters’ mean absolute proper motion components and membership probabilities we took proper motion data (and associated uncertainties) of individual stars from the UCAC3 catalogue (Zacharias et al. 2010). Here we briefly recall the basics of the method. The interested reader can find all details in Jilkova et al. (in prep.).
The basic method to segregate cluster and field stars with proper motion distributions was described a long time ago by Sanders (1971). The fundamental assumption of this model is that proper motions are distributed according to circular or elliptical bi-variate normal distributions for cluster and for field stars, respectively. A maximum likelihood principle is then used to determine the distributions’ parameters. Zhao & He (1990) later improved the method by weighting proper motion components with observational uncertainties.
We devised the nine parametric models starting from the description by Wu et al. (2002), but keeping the dispersion of the circular Gaussian distribution of clusters stars as zero. Therefore the width of the distribution is given only by the observed errors of proper motions (see also the discussion in Balaguer-Núñez et al. 2004).
From the UCAC3 catalogue we selected only those stars with measurements of their proper motions and errors, and employed the 2MASS photometry as an additional check. The choice of the sample radius around each cluster centre was made individually for each cluster, taking into account the suggestions by Sanchez et al. (2010). To minimize the influence of possible outliers, we firstly considered all the stars belonging to one population with a single bivariate normal distribution. Secondly we used only stars with both components of proper motion within the 3-σ interval. Then we restricted the range of the sample to | μ | < 30 mas/yr. For this sample the two-distributions analysis was done. The solution of maximum-likelihood equations was found by a non-linear least squares minimization procedure.
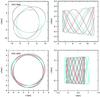 |
Fig. 11 Orbit computation for two clusters, NGC 3690 and NGC 6583, for the bar-less Allen & Santillan (1991) model (red), and the Ferrers n = 2 model (green). |
Once the membership probabilities from pure proper motion data were obtained, the CMDs using the 2MASS J magnitudes vs. (J − H) colour indexes were inspected for the stars with a cluster membership probability higher than 90%. For some clusters the additional magnitude constraint was used to eliminate field stars, and the parameters of the new distribution were iteratively obtained. For more details and a comparison with previously derived UCAC2 proper motions, see Jilkova et al. (in prep.). In Table 10 we give the identification name of the clusters, their equatorial coordinates (RA, Dec), their Galactic coordinates (l and b), their distances from the Sun, their average radial velocities, proper motion in mas/yr (μα and μδ), locations in the Galactic system (X,Y,Z), radial velocity components (U,V,W), and finally age and metallicity [Fe/H].
7.2. Orbit computation
With absolute proper motions, radial velocities, and heliocentric distances of clusters we calculated their Galactic orbits. We assumed the heliocentric distances with 10% errors and derived three sets of initial conditions for each cluster. The initial conditions were calculated following the procedure by Johnson & Soderblom (1987). We adopted the solar motion components with respect to LSR as (U,V,W) = (11.1,12.4,7.25) km s-1 from Schönrich et al. (2010). We also used a right-handed coordinate system where U is positive in the direction to the GC, the rotation velocity of the LSR of 220 km s-1, and the Galactocentric distance of the Sun is 8.5 kpc.
Parameters of the OCs located within ~ 8 kpc from the GC.
For the Galactic potential we adopted the axisymmetric time-independent model by Allen & Santillan (1991) and also considered an influence of the Galactic bar. For the latter we used a Ferrers potential (n = 2) of inhomogeneous triaxial ellipsoids (Pfenniger 1984). The characteristics of the bar model are: i) the bar length of 3.14 kpc; ii) axial ratios 10:3.75:2.56; iii) a mass of 9.0 × 10¹⁰ M⊙; iv) an angular speed of 60 km s-1/kpc: and v) an initial angle with respect to Sun-GC direction of 20°. We used the same parameter values as Pichardo et al. (2004) or Allen et al. (2008) for their more sophisticated models of the Galactic bar. For the axisymmetric background potential we kept the Allen & Santillan (1991) model, except for the mass of the bulge of 4.26 × 10⁹ Modot (the bar replaces 70% of bulge mass).
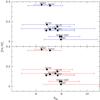 |
Fig. 12 Epicyclic variation of the radial position of the considered OCs. In this plot we show the results from orbit calculations for the bar-less Allen & Santillan model (upper panel) and for the bar Ferrers model (lower panel). |
The integration routine uses a Runge-Kutta forth order integrator (Press et al. 1992). The relative change in the Jacobi constant is of the order of 10-9 to 10-10. We integrated the orbits backwards in time over the intervals corresponding to the age of the clusters. For each orbit we give the most relevant orbital parameters (mean peri- and apo-galacticon, maximum height from the plane, eccentricity, and birthplace) in Table 11. Errors associated to each of these values are computed averaging the values obtained by running orbit calculations with three different distances.
In Fig. 11 we show as an illustration the orbit computation for two clusters, NGC 3690 and NGC 6583, for the bar-less Allen & Santillan (1991) model (red), and the Ferrers n = 2 model (green), to show a case where the bar does not have any influence (NGC 3690) and a case where the bar slightly affects the orbit (NGC 6583).
In Fig. 12 we show the effect of the OC orbital motion on their radial position. For each cluster a horizontal bar shows the epicyclical variation from the apogalacticon to the perigalacticon. For some clusters with eccentric orbits large variations of their radial positions up to about 4 kpc are allowed during their lifetime.
Output of the orbit calculation for the bar-less Allen & Santillan model (upper section of the table) and the n = 2 Ferrers bar model (lower section of the table).
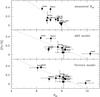 |
Fig. 13 Inner metallicity gradient of OCs with: measured Galactocentric distances (upper panel), radial position at the time of birth of the clusters, from orbit calculations for the bar-less Allen & Santillan model (middle panel), and from orbit calculations for the n = 2 Ferrer bar (lower panel). The dotted lines are average least-squared fits. |
7.3. The influence of orbits on the shape of the gradient
The most interesting quantity in order to derive the original shape of the metallicity gradient is the cluster birthplace. We have computed it integrating the orbits up to the epoch of birth of each cluster (see Table 10). The birthplaces, computed with the maximum age (Age + ΔAge) and with the minimum age (Age − ΔAge) are shown in Table 11. We have assumed that ΔAge is ~ 10%. The uncertainty due to the error on the cluster distance is estimated integrating the cluster’s orbit with three different distances, RGC, RGC ± ΔRGC, and it is represented by the errors on birthplaces in Table 11.
In Fig. 13 we show the metallicity gradient computed with three different sets of radial positions: i) the measured RGC; ii) the radial positions at the time of birth of the clusters from orbit calculations assuming the bar-less Allen & Santillan model; and iii) the RGC birthplace from orbit calculations with the n = 2 Ferrers bar model. From Figs. 12 and 13 we test our initial hypothesis of a different place of birth with respect to their present-time location of NGC 6253 and NGC 6583 and we check how much the present-time shape of the gradient is affected by cluster orbital motion. The initial radial position of some clusters differs remarkably from their present-time position. In particular, for the clusters closer to the GC, whose orbits might be affected by the presence of a bar, the choice of a model with or without bar is important to derive their birthplaces.
The cluster NGC 6253 has a quite eccentric orbit and its radial position ranges from the perigalacticon ~ 5.4 kpc to the apogalacticon ~ 8 kpc, both with bar and bar-less models (see also Fig. 11). With an age estimate of ~ 4.5 ± 0.5 Gyr, the birthplace of this cluster would be ~6 kpc with the bar model or ~ 7 kpc with the bar-less model, hence moved inward with respect to its present-time location. However, the age of NGC 6253 is particularly uncertain: Piatti et al. (1998) found an age of 5 ± 1.5 Gyr, Twarog et al. (2003) derived 3 ± 0.5 Gyr, and Bragaglia & Tosi (2006) indicated an age of ~ 3 Gyr. The uncertainty on the age impacts on the position of the cluster along the orbit and might allow an even more internal birthplace, up to ~ 5.4 kpc (the perigalacticon), as expected from its high metallicity.
NGC 6583 is younger than NGC 6253, with an age of ~ 1 Gyr, thus the propagated uncertainty owing to age determinations on its birthplace is smaller. In addition, the orbit of NGC 6583 is quite circular, with an epicyclic variation of ~ 1 kpc. With both Galactic potential models, the birthplace of NGC 6583 is expected to have a small variation with respect to its present-time location. Thus NGC 6583 is really a high-metallicity cluster located at about RGC = 6.4 kpc.
Weighted linear fits of the gradient slope are shown in Fig. 13 for the RGC, for birthplaces computed either with bar-less or with bar models. The gradient with measured RGC has a steep slope driven by the position of NGC 6253. The three slopes are − 0.177 ± 0.034 dex kpc-1, − 0.110 ± 0.026 dex kpc-1, − 0.114 ± 0.021 dex kpc-1, respectively. We excluded NGC 3690 from the fits because its birthplace is in a different radial region where the gradient changes its slope, becoming flatter. The inner gradient appears more defined and agrees better with Cepheids data ( − 0.130 ± 0.015 dex kpc-1, cf. Pedicelli et al. 2009) when we consider the initial radial position of each cluster, in particular for the birthplaces computed with the bar model.
Thus, concluding, the knowledge of OC orbits is an important tool to derive correctly the shape and slope of the metallicity gradient. Even if statistically the effect might be marginal (see also, e.g., Wu et al. 2009), the determination of clusters’ orbits and birthplaces is important to clarify the position of some “anomalous” clusters, such as NGC 6253, or to confirm their position, as for NGC 6583.
8. Summary and conclusions
We have presented new high-resolution spectroscopic observations of evolved stars in three OCs located between 6 and 7 kpc from the GC (NGC 6192, NGC 6404, NGC 6583) together with orbit computations for the complete sample of clusters with RGC < 8 kpc and available high-resolution spectroscopy. The UVES observations allow us to extend the sample of clusters studied in the inner Galactic disc and to discuss the shape of the metallicity gradient in this radial region.
The main results we have obtained are:
-
i)
from radial velocity analysis, we obtained the membership ofevolved stars finding four members in NGC 6192,four in NGC 6404, and two inNGC 6583;
-
ii)
from their high-resolution spectra and standard LTE analysis, we derived stellar parameters and abundance ratios of the iron-peak elements Fe, Ni, Cr, and of the α-elements Al, Mg, Si, Ti, Ca. Their average metallicities are [Fe/H] = + 0.12 ± 0.04 (NGC 6192), + 0.11 ± 0.04 (NGC 6404), + 0.37 ± 0.03 (NGC 6583) and [X/Fe] are consistent with solar values. In addition, we have compared our results with abundance ratios of inner disc giant stars, finding a good agreement;
-
iii)
the clusters we have analysed, together with other OC and Cepheid data, confirm a steep gradient in the inner disc, a signature of a different evolutionary rate with respect to the outer disc.
-
iv)
we found that at a given radius the metallicity of some intermediate-age and old clusters in this radial region is higher than that of young clusters (this is true in particular for NGC 6583 and NGC 6253). For the first time, we have coupled metallicity studies with dynamics, computing the orbits of inner disc OCs and, from them, the birthplaces of the OCs with RGC < 8 kpc. We have found that there is a high probability that NGC 6253 had more internal value of RGC than shown by its present position; this would reconcile its high metallicity with its present-time radial location. NGC 6583 has instead a higher probability to be born close to its present-time position, and thus to be the most internal and metal-rich cluster cluster studied;
-
v)
the gradients computed using the cluster birthplaces instead of their present RGC distances do not yield significantly different values for the final slopes. However, we found a better agreement with the Cepheid inner gradient slope and a higher correlation when we consider the birthplaces instead of the present-time RGC.
IRAF is distributed by the National Optical Astronomy Observatory, which is operated by the Association of Universities for Research in Astronomy (AURA) under cooperative agreement with the National Science Foundation.
Acknowledgments
We thank an anonymous referee for her/his careful reading and useful comments. We thank Silvia Pedicelli for her help with the Cepheid data-set. L.M. is supported by the PRIN “Astroarcheologia galattica: la via locale per la cosmologia”, P.I. Francesca Matteucci. M.Z. is supported by the FONDAP centre for Astrophysics 15010003, the BASAL centre for Astrophysics and Associated Technologies ATA PFB-06, Fondecyt Regular 1085278 and the MIDEPLAN Milky Way Millennium Nucleus P07-021-F.
References
- Allen, C., & Santillan, A. 1991, Rev. Mex. Astron. Astrofis., 22, 255 [NASA ADS] [Google Scholar]
- Allen, C., Moreno, E., & Pichardo, B. 2008, ApJ, 674, 237 [NASA ADS] [CrossRef] [Google Scholar]
- Alonso, A., Arribas, S., & Martínez-Roger, C. 1999, A&AS, 140, 261 [NASA ADS] [CrossRef] [EDP Sciences] [Google Scholar]
- Anders, E., & Grevesse, N. 1989, Geochim. Cosmochim. Acta, 53, 197 [Google Scholar]
- Andrievsky S., Kovtyukh, V. V., Luck, R. E., et al., 2002, A&A, 381, 32 [NASA ADS] [CrossRef] [EDP Sciences] [Google Scholar]
- Balaguer-Núñez, L., Jordi, C., Galadí-Enríquez, D., & Zhao, J. L. 2004, A&A, 426, 819 [NASA ADS] [CrossRef] [EDP Sciences] [Google Scholar]
- Barklem, P. S., Piskunov, N., & O’Mara, B. J. 2000, A&AS, 142, 467 [NASA ADS] [CrossRef] [EDP Sciences] [MathSciNet] [PubMed] [Google Scholar]
- Bellini, A., Bedin, L. R., Pichardo, B., et al. 2010, A&A, 513, A51 [NASA ADS] [CrossRef] [EDP Sciences] [Google Scholar]
- Bensby T., Alves-Brito A., Oey, M.S., Yong D., & Meléndez J. 2010, A&A, 516, L13 [NASA ADS] [CrossRef] [EDP Sciences] [Google Scholar]
- Binney, J., & Tremaine, S. 2008, Galactic Dynamics: Second Edition, by James Binney and Scott Tremaine. ISBN 978-0-691-13026-2 (HB) (Princeton, NJ USA: Princeton University Press) [Google Scholar]
- Bragaglia, A., & Tosi, M. 2006, AJ, 131, 1544 [NASA ADS] [CrossRef] [Google Scholar]
- Carraro, G., & Chiosi, C. 1994, A&A, 288, 751 [NASA ADS] [Google Scholar]
- Carraro, G., Ng, Y. K., & Portinari, L. 1998, MNRAS, 296, 1045 [NASA ADS] [CrossRef] [Google Scholar]
- Carraro, G., Bresolin, F., & Villanova, S. 2004, AJ, 128, 1676 [NASA ADS] [CrossRef] [Google Scholar]
- Carraro, G., Méndez, R. A., & Costa, E. 2005, MNRAS, 356, 647 [NASA ADS] [CrossRef] [Google Scholar]
- Carraro, G., Villanova, S., Demarque, P., et al. 2006, ApJ, 643, 1151 [Google Scholar]
- Carretta, E., Bragaglia, A., Gratton, R. G., et al. 2004, A&A, 422, 951 [NASA ADS] [CrossRef] [EDP Sciences] [Google Scholar]
- Chen, L., Hou, J. L., Wang, J. J., et al. 2003, AJ, 125, 1397 [NASA ADS] [CrossRef] [Google Scholar]
- Chiappini, C., Matteucci, F., Romano, D., et al. 2001, ApJ, 554, 1044 [NASA ADS] [CrossRef] [Google Scholar]
- Clariá, J. J., Mermilliod, J.-C., Piatti, A. E., & Parisi, M. C. 2006, A&A, 453, 91 [NASA ADS] [CrossRef] [EDP Sciences] [Google Scholar]
- Colavitti, E., Cescutti, G., Matteucci, F., & Murante, G. 2009, A&A, 496, 429 [NASA ADS] [CrossRef] [EDP Sciences] [Google Scholar]
- Daflon, S., & Cunha, K. 2004, ApJ, 617, 1115 [NASA ADS] [CrossRef] [Google Scholar]
- Davies, B., Origlia, L., Kudritzki, R.-P., et al. 2009, ApJ, 696, 2014 [NASA ADS] [CrossRef] [Google Scholar]
- Deharveng, L., Peña, M., Caplan, J., & Costero, R. 2000, MNRAS, 311, 329 [NASA ADS] [CrossRef] [Google Scholar]
- Fitzpatrick, M. J., & Sneden, C. 1987, BAAS, 19, 1129 [Google Scholar]
- Friel, E.D. 1995, ARA&A, 33, 381 [NASA ADS] [CrossRef] [Google Scholar]
- Friel, E. D. 2006, in Chemical Abundances and Mixing in Stars in the Milky Way and its Satellites, ed. S. Randich & L. Pasquini, ESO Astrophysic Symposia (Springer-Verlag), 24, 3 [Google Scholar]
- Friel, E.D., & Janes, K. A. 1993, A&A, 267, 75 [NASA ADS] [Google Scholar]
- Friel, E.D., Janes, K. A., Tavarez, M., et al. 2002, AJ, 124, 2693 [NASA ADS] [CrossRef] [Google Scholar]
- Friel, E. D., Jacobson, H. R., & Pilachowski, C. A. 2010, AJ, 139, 1942 [NASA ADS] [CrossRef] [Google Scholar]
- Fu, J., Hou, J. L., Yin, J., & Chang, R. X. 2009, ApJ, 696, 668 [NASA ADS] [CrossRef] [Google Scholar]
- Girardi, L., Bressan, A., Bertelli, G., & Chiosi, C. 2000, A&AS, 141, 371 [Google Scholar]
- Gonzales, G., & Wallerstein, G. 2000, PASP, 112, 1081 [NASA ADS] [CrossRef] [Google Scholar]
- Gratton, R. G., Carretta, E., Claudi, R., Lucatello, S., & Barbieri, M. 2003, A&A, 404, 187 [NASA ADS] [CrossRef] [EDP Sciences] [Google Scholar]
- Kilambi, G. C., & Fitzgerald, M. P. 1983, Bull. Astron. Soc. India, 11, 226 [Google Scholar]
- King, D. J. 1987, The Observatory, 107, 107 [NASA ADS] [Google Scholar]
- Kurucz, R. L. 1993, VizieR Online Data Catalog, 6039, [Google Scholar]
- Kjeldsen, H., & Frandsen, S. 1991, A&AS, 87, 119 [NASA ADS] [Google Scholar]
- Jacobson, H. R., Friel, E. D., & Pilachowski, C. A. 2009, AJ, 137, 4753 [NASA ADS] [CrossRef] [Google Scholar]
- Johnson, D. R. H., & Soderblom, D. R. 1987, AJ, 93, 864 [NASA ADS] [CrossRef] [Google Scholar]
- Janes, K.A. 1979, ApJS, 39, 135 [NASA ADS] [CrossRef] [Google Scholar]
- Lépine, J. R. D., Acharova, I. A., & Mishurov, Y. N. 2003, ApJ, 589, 210 [NASA ADS] [CrossRef] [Google Scholar]
- Levesque, E. M., Massey, P., Olsen, K. A. G., et al. 2006, ApJ, 645, 1102 [NASA ADS] [CrossRef] [Google Scholar]
- Loktin, A. V., Gerasimenko, T. P., & Malysheva, L. K. 2001, Astron. Astrophys. Trans., 20, 607 [NASA ADS] [CrossRef] [Google Scholar]
- Luck, R. E., & Bond, H. E. 1989, ApJS, 71, 559 [NASA ADS] [CrossRef] [Google Scholar]
- Luck R., Kovtyukh V., & Andrievsky S., 2006, AJ, 132, 902 [NASA ADS] [CrossRef] [Google Scholar]
- Maciel, W. J., Quireza, C., & Costa, R. D. D. 2007, A&A, 463, L13 [NASA ADS] [CrossRef] [EDP Sciences] [Google Scholar]
- Magrini, L., Sestito, P., Randich, S., & Galli, D. 2009, A&A, 494, 95 [NASA ADS] [CrossRef] [EDP Sciences] [Google Scholar]
- Pace, G., Danziger, J., Carraro, G., et al. 2010, A&A, 515, A28 [NASA ADS] [CrossRef] [EDP Sciences] [Google Scholar]
- Pancino, E., Carrera, R., Rossetti, E., & Gallart, C. 2010, A&A, 511, A56 [NASA ADS] [CrossRef] [EDP Sciences] [Google Scholar]
- Paulson, D. B., Sneden, C., & Cochran, W. D. 2003, AJ, 125, 3185 [NASA ADS] [CrossRef] [Google Scholar]
- Paunzen, E., Maitzen, H. M., Rakos, K. D., & Schombert, J. 2003, A&A, 403, 937 [NASA ADS] [CrossRef] [EDP Sciences] [Google Scholar]
- Pedicelli, S., Bono, G., Lemasle, B., et al. 2009, A&A, 504, 81 [NASA ADS] [CrossRef] [EDP Sciences] [Google Scholar]
- Pfenniger, D. 1984, A&A, 134, 373 [NASA ADS] [Google Scholar]
- Phelps, R. L., Janes, K. A., & Montgomery, K. A. 1994, AJ, 107, 1079 [NASA ADS] [CrossRef] [Google Scholar]
- Piatti, A. E., Clariá, J. J., Bica, E., Geisler, D., & Minniti, D. 1998, AJ, 116, 801 [NASA ADS] [CrossRef] [Google Scholar]
- Pichardo, B., Martos, M., & Moreno, E. 2004, ApJ, 609, 144 [NASA ADS] [CrossRef] [Google Scholar]
- Press, W. H., Teukolsky, S. A., Vetterling, W. T., & Flannery, B. P. 1992 (Cambridge: University Press), 2nd edn. [Google Scholar]
- Randich, S., Sestito, P., Primas, F., Pallavicini, R., & Pasquini, L. 2006, A&A, 450, 557 [NASA ADS] [CrossRef] [EDP Sciences] [Google Scholar]
- Rood, R. T., Quireza, C., Bania, T. M., Balser, D. S., & Maciel, W. J. 2007, From Stars to Galaxies: Building the Pieces to Build Up the Universe, 374, 169 [NASA ADS] [Google Scholar]
- Salaris, M., Weiss, A., & Percival, S. M. 2004, A&A, 414, 163 [NASA ADS] [CrossRef] [EDP Sciences] [Google Scholar]
- Sánchez, N., Vicente, B., & Alfaro, E. J. 2010, A&A, 510, A78 [NASA ADS] [CrossRef] [EDP Sciences] [Google Scholar]
- Sanders, W. L. 1971, A&A, 14, 226 [NASA ADS] [Google Scholar]
- Schönrich, R., Binney, J., & Dehnen, W. 2010, MNRAS, 403, 1829 [NASA ADS] [CrossRef] [Google Scholar]
- Sestito, P., Bragaglia, A., Randich, S., et al. 2006, A&A, 458, 121 [NASA ADS] [CrossRef] [EDP Sciences] [Google Scholar]
- Sestito, P., Randich, S., & Bragaglia, A. 2007, A&A, 465, 185 [NASA ADS] [CrossRef] [EDP Sciences] [Google Scholar]
- Sestito, P., Bragaglia, A., Randich, S., et al. 2008, A&A, 488, 943 [NASA ADS] [CrossRef] [EDP Sciences] [Google Scholar]
- Skrutskie, M. F., Curti, R. M., Stiening, R., et al. 2006, AJ, 131, 1163 [NASA ADS] [CrossRef] [Google Scholar]
- Smiljanic, R., Gauderon, R., North, P., et al. 2009, A&A, 502, 267 [NASA ADS] [CrossRef] [EDP Sciences] [Google Scholar]
- Stanghellini, L., & Haywood, M. 2010, ApJ, 714, 1096 [NASA ADS] [CrossRef] [Google Scholar]
- Twarog, B. A., Ashman, K. M., Anthony-Twarog, B. J., et al. 1997, AJ, 114, 2556 [NASA ADS] [CrossRef] [Google Scholar]
- Twarog, B. A., Anthony-Twarog, B. J., & De Lee, N. 2003, AJ, 125, 1383 [NASA ADS] [CrossRef] [Google Scholar]
- Unsöld, A. 1955 (Berlin: Springer), 2. Aufl. [Google Scholar]
- Villanova, S., Randich, S., Geisler, D., Carraro, G., & Costa, E. 2010, A&A, 509, A102 [NASA ADS] [CrossRef] [EDP Sciences] [Google Scholar]
- Wu, Z. Y., Tian, K. P., Balaguer-Núñez, L., et al. 2002, A&A, 381, 464 [NASA ADS] [CrossRef] [EDP Sciences] [Google Scholar]
- Wu, Z.-Y., Zhou, X., Ma, J., & Du, C.-H. 2009, MNRAS, 399, 2146 [NASA ADS] [CrossRef] [Google Scholar]
- Yong, B. A., Ashman, K. M., Anthony-Twarog, B. J., et al. 2005, AJ, 530, 597 [NASA ADS] [CrossRef] [Google Scholar]
- Zacharias, N., Finch, C., Girard, T., et al. 2010, AJ, 139, 2184 [NASA ADS] [CrossRef] [Google Scholar]
- Zhao, J. L., & He, Y. P. 1990, A&A, 237, 54 [NASA ADS] [Google Scholar]
All Tables
[X/Fe] abundances and averages. Errors are the quadratic sum of σ1 on [X/H] and on [Fe/H].
Output of the orbit calculation for the bar-less Allen & Santillan model (upper section of the table) and the n = 2 Ferrers bar model (lower section of the table).
All Figures
|
Fig. 1 Region of the normalized spectra of member stars in NGC 6192, NGC 6404, NGC 6583. |
| In the text | |
|
Fig. 2 Colour–magnitude diagram of NGC 6192. The observed stars are marked with (red) filled circles. Stars that turned out to be non-members are also marked with a cross. The photometry is from Clarìa et al. (2006). |
| In the text | |
|
Fig. 3 Colour–magnitude diagram of NGC 6404. Symbols as in Fig. 2. The photometry is from Carraro et al. (2005). |
| In the text | |
|
Fig. 4 Colour–magnitude diagram of NGC 6583. Symbols as in Fig. 2. The photometry is from Carraro et al. (2005). |
| In the text | |
|
Fig. 5 log n(Fe/H) vs. E.P. for star No. 40 in NGC 6404 with two Teff: 4060 K as derived from photometry and 4250 K as derived from the fulfillment of excitation equilibrium with the spectroscopic analysis with MOOG. The two continuous lines are the mean least-square fits to the data performed by MOOG. |
| In the text | |
|
Fig. 6 Region of the normalized spectra of member stars in NGC 6404 centred in the [FeII] line at 6369.45 Å. The continuous (red) spectrum is of star No. 5, which has a very low gravity, while the dotted line is the spectrum of star No. 45 in NGC 6192, which has similar temperature and metallicity, but higher gravity. |
| In the text | |
|
Fig. 7 [Fe/H] versus the effective temperature in the studied member stars of the three clusters: NGC 6583 (filled triangles), NGC 6404 (filled circles), NGC 6192 (filled squares). |
| In the text | |
|
Fig. 8 α- elements Mg, Ca, Si, Ti over Fe ratios of our target clusters (big blue filled pentagon) with the same ratios recently measured by Bensby et al. (2010) for inner disc giants (small red filled circles). |
| In the text | |
|
Fig. 9 Iron gradient: OCs of different ages (top panel) and Cepheids (bottom panel). Empty circles (green) are OCs with age ≤ 0.8 Gyr, triangles (blue) with 0.8 Gyr < age ≤ 4 Gyr, and squares (magenta) with age > 4 Gyr. The three large filled circles (red) are the data presented in this paper. The black small empty circles in the lower panel are [Fe/H] of Cepheids by Pedicelli et al. (2009). |
| In the text | |
|
Fig. 10 Disc inner gradient (0 kpc < RGC < 8 kpc). Symbols for OCs and Cepheids are as in Fig. 9. We show also the model curves of M09 at different epochs: present-time (continuous line), 2 Gyr ago (dashed curve), 6 Gyr ago (dotted curve). |
| In the text | |
|
Fig. 11 Orbit computation for two clusters, NGC 3690 and NGC 6583, for the bar-less Allen & Santillan (1991) model (red), and the Ferrers n = 2 model (green). |
| In the text | |
|
Fig. 12 Epicyclic variation of the radial position of the considered OCs. In this plot we show the results from orbit calculations for the bar-less Allen & Santillan model (upper panel) and for the bar Ferrers model (lower panel). |
| In the text | |
|
Fig. 13 Inner metallicity gradient of OCs with: measured Galactocentric distances (upper panel), radial position at the time of birth of the clusters, from orbit calculations for the bar-less Allen & Santillan model (middle panel), and from orbit calculations for the n = 2 Ferrer bar (lower panel). The dotted lines are average least-squared fits. |
| In the text | |
Current usage metrics show cumulative count of Article Views (full-text article views including HTML views, PDF and ePub downloads, according to the available data) and Abstracts Views on Vision4Press platform.
Data correspond to usage on the plateform after 2015. The current usage metrics is available 48-96 hours after online publication and is updated daily on week days.
Initial download of the metrics may take a while.