| Issue |
A&A
Volume 523, November-December 2010
|
|
|---|---|---|
| Article Number | A43 | |
| Number of page(s) | 6 | |
| Section | Astrophysical processes | |
| DOI | https://doi.org/10.1051/0004-6361/201014443 | |
| Published online | 16 November 2010 | |
Testing Newtonian gravity in the low acceleration regime with globular clusters: the case of ω Centauri revisited⋆
1
Instituto de astrofísica de canarias, c/via Lactea s/n, San Cristobal de la Laguna
38205, Spain
e-mail: This email address is being protected from spambots. You need JavaScript enabled to view it.
2
INAF, Osservatorio astronomico di Padova,
vicolo Osservatorio 5,
Padova,
Italy
Received:
16
March
2010
Accepted:
20
June
2010
Abstract
Context. Stellar kinematics in the external regions of globular clusters can be used to probe the validity of Newton’s law in the low acceleration regimes without the complication of non-baryonic dark matter. Indeed, in contrast to the case of galaxies, in globular clusters a systematic deviation of the velocity dispersion profile from the expected Keplerian falloff would be indicative of a breakdown of Newtonian dynamics rather than the existence of dark matter.
Aims. We perform a detailed analysis of the velocity dispersion in the globular cluster ω Centauri to determine whether it decreases monotonically with distance as expected within the framework of Newtonian dynamics, or whether it converges toward a constant value as recent works suggest.
Methods. We combine measurements from two previous studies to almost double the data available at large radii, to better constrain the velocity dispersion profile in the low acceleration regime.
Results. We found the inner region of ω Centauri is clearly rotating, while the rotational velocity tends to vanish, being consistent with no rotation at all in the external regions. The cluster velocity dispersion at large radii from the center is found to clearly deviate from the Newtonian prediction.
Conclusions. We conclude that there are strong similarities between globular clusters and elliptical galaxies, for in both classes of objects the velocity dispersion tends to remain constant at large radii. In the case of galaxies, this is ascribed to the existence of a massive halo of dark matter, which is physically unlikely in the case of globular clusters. This similarity, if confirmed, is best explained by a breakdown of Newtonian dynamics below a critical acceleration.
Key words: gravitation / globular clusters: general / globular clusters: individual:ωCentauri
Tables 2 and 3 are only available in electronic form at http://www.aanda.org
© ESO, 2010
1. Introduction
A fundamental aspect of our knowledge of the Universe concerns the existence of non-baryonic dark matter (DM), which is assumed to represent about 20% of the total energy budget of the Universe. Signatures of DM are found in galaxies and cluster of galaxies by means of its dynamical effects and gravitational lensing. While DM appears in wildly variable quantities and distributions among different types of objects, it appears to exhibit systematic (but not yet understood) behaviors (cf. Gentile et al. 2009; and Donato et al. 2009). The most remarkable (e.g., Binney 2004) is that DM is needed to reconcile the observations with the expectations of Newtonian dynamics when and only when the acceleration of gravity goes below a critical value, a0 ~ 1.2 × 10⁻⁸ cm s-2 (Begeman et al. 1991).
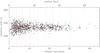 |
Fig. 1 The distribution of radial velocities from Sollima et al. (2009) (points) as a function of distance from the cluster center. The sample of Scarpa et al. (2003b) (crosses), limited to the region 20 < R < 30 arcmin, almost doubles the number of points in the region where a < a0. The vertical (dotted) lines indicate the limits of bins containing 100 points each (beside the last one that contains only 13 points). The average radial velocity within each bin (large open squares) is very stable with no indication of peculiar trends. The uncertainty in the average is smaller than the size of the symbols. |
This led to the suggestion that Newtonian dynamic might not be applicable below this acceleration threshold. The most successful proposal of this type, known as MOND (Milgrom 1983), can reproduce the rotation curves of spiral galaxies and many other dynamical properties of galaxies without assuming that DM exists (McGaugh & de Block 1998; Mortlock & Turner 2001; see Sanders & McGaugh 2002, for a review). This hypothesis, however, has so many serious consequences for standard physics (e.g. Milgrom 2010, for a review) that as many tests as possible should be carried out to verify it. Experiments can be performed in the laboratory or by studying astrophysical systems where DM is absent. A first pioneering study along this line focused on the dynamics of the external regions of globular clusters, the largest virialized structures that do not contain significant amounts of DM. Measurements of the velocity dispersion in the outskirts of ω Centauri (Scarpa et al. 2003a,b) showed a clear flattening of the velocity dispersion profile starting at the radius where the cluster’s internal acceleration of gravity is ~a0, with no evidence of the expected Keplerian falloff. This replicate the behavior observed in elliptical galaxies (e.g. Carollo et al. 1995), which has been explained by invoking the presence of large amounts of DM. This result was then extended to other 6 globular clusters (Scarpa et al. 2003a,b, 2004a,b, 2007a,b, 2010), showing that the behavior seen in ω Cen is not a peculiar property of this cluster.
Given the relevance of this result, the dynamics of ω Cen were carefully reconsidered by Sollima et al. (2009, S09, hereafter). Based on the analysis of a new large dataset of radial velocity measurements, it was claimed that the velocity dispersion decreases monotonically with radius, in agreement with Newtonian predictions, but in clear contrast to the claim by Scarpa et al. (2003b, SMG hereafter). We reconsider here the data presented by S09. Our reanalysis is performed on the joint S09 and SMG radial velocity data set. In both works, the selection criteria for cluster member identification was basically the same (a selection based on position in the color magnitude diagram combined with a cut in radial velocity), ensuring that the whole dataset is homogeneous.
2. Radial velocity measurements for ω Centauri
Located at 6.4 kpc from the Galactic center (Harris 1996), ω Cen is the most massive and luminous globular cluster of the Milky Way. It is sufficiently massive to contain more than one stellar population, as indicated by helium abundance variations (Norris 2004; Piotto et al. 2005) and its peculiar position in the size-luminosity plane (Mackey & van der Bergh 2005). It has been also argued that ω Cen may not be a genuine globular cluster but the nuclear remnant of a dwarf galaxy that merged in the past with the Milky Way (e.g., Bellazzini et al. 2008).
Among the earliest dynamical studies of ω Cen relevant to this work, Meylan & Mayor (1986) discussed the radial velocities of 318 cluster members, covering the cluster out to 22 arcmin from the center. Comparing these data to the velocity dispersion derived from proper motion data for several thousand stars (van Leeuwen et al. 2000), it was possible to demonstrate (Scarpa et al. 2003b) that the velocity ellipsoid is isotropic. This was a very important result for our purposes because at large radii only the velocity dispersion along the line of sight can be measured.
Assuming for the cluster a total absolute magnitude of MV = −10.29, distance of 5.5 kpc1, and mass-to-light ratio M / L = 1 in solar units, the acceleration is a0 at r0 ~ 22.3 arcmin. Thus to extend the results presented by Meylan & Mayor (1986) to radii where the acceleration goes below a0, SMG obtained radial velocity measurements for 75 cluster members in the region 20 < r < 30 arcmin. The full list of radial velocities obtained by SMG was not published at that time, thus is given in Table 2. Details of the observations and analysis of individual measurements are reported in SMG. The work by SMG, while confirming the results by Meylan and Mayor in the region of overlap, showed that the velocity dispersion did not decrease with distance beyond r ~ 20 arcmin.
A comprehensive study of this cluster was then presented in van de Ven et al. (2006), discussing both proper motions and radial velocities. The data, however, covered the cluster only up to 20 arcmin from the center. The velocity dispersion profile was found to be fully consistent with earlier determinations.
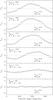 |
Fig. 2 Rotation (in km s-1) of ω Cen in 6 annular regions at increasing distance from the center. The number of stars in each region and the radial distance limits (in arcmin) are shown. The formal value of the maximum velocity, Vmax, and the position angle, are derived from the best fit sinusoidal model (solid line). Vmax is given in km s-1 and the position angle in degrees from north toward east. |
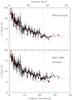 |
Fig. 3 Plot of 125 velocity dispersion profiles, each one obtained with a different binning of the data from the S09 sample alone (upper panel), or the combined S09+SMG sample (lower panel). The envelope of all these profiles, rather than the singular points, shows the flattening of the profile beyond r ~ 20 arcmin. The velocity dispersion reported by S09 (red points with error bars) closely follows the center of the envelope. However, the value of σ = 5.2 km s-1 at r = 25.7 arcmin is not representative of the data, being in both cases at the very bottom of the envelope. The vertical line gives the MOND radius, while the horizontal one is only meant to highlight the flattening of the dispersion profile. |
3. The rotation of ω Centauri
ω Cen is one of the most flattened globular clusters known, suggesting it is rapidly rotating. Before discussing the velocity dispersion, it is therefore important to quantify the fraction of the total energy budget of ω Cen that goes into ordered motion. Clear evidence of rotation in the inner regions of the cluster was found by Meylan & Mayor (1986). Using a fraction of the S09 sample, Pancino et al. (2007) measured a maximum rotation of 6.8 km s-1 between 6 and 8 arcmin from the center. Using the large SMG + S09 combined samples, we evaluated the amount of rotation in 6 regions at increasing distance from the center. In each region, we halved the cluster by position angle and computed the mean radial velocity of each half. The difference of these two velocities correspond to twice the rotational velocity. This procedure was applied with steps of 10 degrees in position angle (Fig. 2).
The center of the cluster clearly rotates. In the two innermost bins, the formal value of the maximum rotation velocity is 4.5 km s-1, somewhat lower than quoted by Pancino et al. (2007), with rotation axis position angle of 15 degrees (from North toward East). The rotational velocity begin to decrease at r ~ 10 arcmin, also showing indication of a possible drift of the rotation axis. In the two most external annulus, the rotational velocity is very small, being consistent with no rotation at all in the outermost bin.
In all six regions, the rotational velocity is significantly smaller than the velocity dispersion (see next section), indicating that the amount of energy stored in ordered rotational motion is negligible compared to that of the chaotic motion. Thus, at large radii the velocity dispersion should closely follow a typical Keplerian falloff (unless external effects modify it).
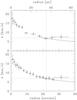 |
Fig. 4 The velocity dispersion profile of ω Cen as obtained considering the combined S09+SMG sample, and two different binning. Top panel: data binned as in S09. Bottom panel: narrower sampling for having one extra bin beyond the MOND radius. Points give the velocity dispersion in km s-1 and its 1σ uncertainty, while the bars in the x direction give the rms of the data in the bin. The vertical dotted line indicates the MOND radius, where the acceleration is a0. The horizontal line is not a fit to the data, but is only meant to highlight the flattening of the dispersion profile. The solid line show a Keplerian fall off. Note that all these data points fall well within the cluster tidal radius (45 arcmin). |
4. The velocity dispersion profile of ω Cen
It is well known that the binning of sparse and non-homogeneously distributed data can produce artificial/spurious trends in binned plots. A bin-independent method of constraining the velocity dispersion is shown in Fig. 3, where we plot on top of each other, 125 velocity dispersion profiles, each one obtained with a different binning.
To create these profiles, we first sorted the data according to increasing distance from the cluster center. We then constructed binned data starting from point number 10, 20, 30, 40, and 50, disregarding the innermost points that are irrelevant to our purposes. The number of points per bin, constant for each profile, was varied from a minimum of 10 to a maximum of 50 points, in steps of 2. This procedure resulted in 125 different combinations of binned profiles. What is relevant to the description of the velocity dispersion profile is the envelope of all the profiles. While the dispersion varies significantly from point to point, the flattening at large radii is evident, both when using data from the S09 sample alone, and the S09+SMG combined samples. The values computed by S09 (see their Table 1) are very close to the center of the envelope, but the point at r = 25.7 (σ = 5.2) is clearly not representative of the data, being at the bottom of the envelope. S09 appear to have made an unfortunate choice of the binning, resulting in an underestimation of the velocity dispersion in the critical region beyond 22 arcmin. It turns out therefore, that both the S09 and the combined S09+SMG data exhibit a clear flattening (at σ ~ 7 km s-1) of the velocity dispersion profile in ω Cen at large radii (r > 20 arcmin).
ω Centauri (NGC 5139) basic properties.
In Fig. 4 we present the velocity dispersion obtained by binning the combined S09+SMG sample with the S09 original binning and a narrower binning that more finely samples the profile. The values corresponding to the latter are reported in Table 3. The expected Keplerian fall off is also shown. This was computed assuming all the cluster mass is contained within the MOND radius, an assumption justified by 95% of the cluster total luminosity being contained within a radius as small as 17 arcmin (Trager et al. 1995). Although the departure of the velocity dispersion profile from the Keplerian fall off is modest, it shows a systematic trend.
5. Discussion
Our analysis of the largest available data set of radial velocities of stars in the
globular cluster ω Cen, indicates that the velocity dispersion at large
radii from the center remains constant with radius (Fig. 4). There is indeed no indication of the decrease of the velocity dispersion
claimed by S09. The flattening begins at r = 20 ± 2 arcmin, where the
Newtonian acceleration of gravity is  cm s-2
in line with the values measured in the other globular clusters studied as part of this
project (Scarpa et al. 2007a, 2010). Here G is the gravitational constant and the
mass M is computed assuming a mass-to-light ratio
M / L = 1 in solar units, and a cluster
total absolute magnitude of MV = −10.29
(Harris 1996), again assuming that all the mass is
contained within the MOND radius, an approximation well within the uncertainties in the
M / L ratio.
cm s-2
in line with the values measured in the other globular clusters studied as part of this
project (Scarpa et al. 2007a, 2010). Here G is the gravitational constant and the
mass M is computed assuming a mass-to-light ratio
M / L = 1 in solar units, and a cluster
total absolute magnitude of MV = −10.29
(Harris 1996), again assuming that all the mass is
contained within the MOND radius, an approximation well within the uncertainties in the
M / L ratio.
Although, because of the still limited statistics a Keplerian falloff at large radii cannot be ruled out in ω Cen, combining the results for all globular clusters studied so far provides mounting evidence that globular clusters dynamically resemble elliptical galaxies (Scarpa et al. 2010). Whether this represents the effect of MOND in a class of objects that do not contain dark matter remains unclear. It has been argued (Baumgardt et al. 2005) that ω Cen is too close to the Milky Way to provide a useful test for MOND. Milgrom (1983) explicitly stated that because of the strong external field of the Milky Way, no deviations from a Keplerian fall off should be observed in ω Cen and, for that matter, in all the other clusters studied so far as part of this project. In contrast, deviations have been observed in all of them (Scarpa et al. 2010).
One might alternatively assume M / L > 1 such that the acceleration remains above the MOND threshold at all radii probed by the data. For instance, Moffat & Toth (2008) obtained assuming M / L = 2.9 and the framework of Newtonian dynamics a reasonable fit to the dispersion profile from SMG. It would be interesting to see whether it remains possible to fit the current data that exhibits an even more marked flattening. We note, however, that the assumptions of M / L significantly larger than 1 is rather controversial, because in the few cases where the present-day mass function of globular clusters has been measured, M / L is found to be even smaller than 1 (De Marchi 1999; Piotto et al. 1997; Andreuzzi et al. 2000).
Irrespective of the correct theoretical interpretation of the flattening of the velocity dispersion profile, we conclude that we have discovered a striking similarity between globular clusters and elliptical galaxies.
Online material
Heliocentric radial velocities for ω Centauri members.
Radial velocity dispersion for ω Centaury.
For consistency we use here a distance of 5.5 kpc as in S09, while in SMG an older value of 5.1 kpc (van Leeuwen et al. 2000) was used.
Acknowledgments
We thank Dr. A. Sollima and collaborators for giving us access to their full data sample. This work was supported by ASI-COFIC contract n. I/016/07/0 “Studi di Cosmologia e Fisica Fondamentale”.
References
- Andreuzzi, G., Buonanno, R., Fusi Pecci, F., Iannicola, G., & Marconi, G. 2000, A&A, 353, 994 [Google Scholar]
- Baumgardt, H., Grebel, E. K., & Kroupa, P. 2005, MNRAS, 359, L1 [NASA ADS] [CrossRef] [Google Scholar]
- Begeman, K. G., Broeils, A. H., & Sanders, R. H. 1991, MNRAS, 249, 523 [NASA ADS] [CrossRef] [Google Scholar]
- Bellazzini, M., Ibata, R. A., Chapman, S. C., et al. 2008, AJ, 136, 1147 [NASA ADS] [CrossRef] [Google Scholar]
- Binney, J. 2004, in Dark Matter in Galaxies, ed. S. D. Ryder, D. J. Pisano, M. A. Walker, & K. C. Freeman, IAU Symp., 220, 3 [Google Scholar]
- Carollo, C. M., de Zeeuw, P. T., van der Marel, R. P., Danziger, I. J., & Qian, E. E. 1995, ApJ, 441, L25 [NASA ADS] [CrossRef] [Google Scholar]
- De Marchi, G. 1999, ApJ, 117, 303 [Google Scholar]
- Donato, F., Gentile, G., Salucci, P., et al. 2009, MNRAS, 397, 1169 [NASA ADS] [CrossRef] [Google Scholar]
- Gentile, G., Famaey, B., Zhao, H., & Salucci, P. 2009, Nature, 461, 627 [NASA ADS] [CrossRef] [PubMed] [Google Scholar]
- Harris, W. E. 1996, AJ, 112, 1487 [NASA ADS] [CrossRef] [Google Scholar]
- Mackey, A. D., & van den Bergh, S. 2005, MNRAS, 360, 631 [NASA ADS] [CrossRef] [Google Scholar]
- McGaugh, S., & de Block, W. J. G. 1998, ApJ, 499, 66 [NASA ADS] [CrossRef] [Google Scholar]
- Meylan, G., & Mayor, M. 1986, A&A, 166, 122 [NASA ADS] [Google Scholar]
- Milgrom, M. 1983, ApJ, 270, 365 [NASA ADS] [CrossRef] [Google Scholar]
- Milgrom, M. 2010, AIP Conf. Proc., 1241, 139 [NASA ADS] [CrossRef] [Google Scholar]
- Moffat, J. W., & Toth, V. T. 2008, ApJ, 680, 1158 [Google Scholar]
- Mortlock, D. J., & Turner, E. L. 2001, MNRAS, 327, 577 [Google Scholar]
- Norris, J. E. 2004, ApJ, 612, L25 [NASA ADS] [CrossRef] [Google Scholar]
- Pancino, E., Galfo, A., Ferraro, F. R., & Bellazzini, M. 2007, ApJ, 661, L155 [NASA ADS] [CrossRef] [Google Scholar]
- Piotto, G., Cool, A. M., & King, I. R. 1997, AJ, 113, 1345 [NASA ADS] [CrossRef] [Google Scholar]
- Piotto, G., Villanova, S., Bedin, L. R., et al. 2005, ApJ, 621, 777 [NASA ADS] [CrossRef] [Google Scholar]
- Sanders, R. H., & McGaugh, S. S. 2002, ARA&A, 40, 263 [NASA ADS] [CrossRef] [Google Scholar]
- Scarpa, R., Marconi, G., & Gilmozzi, R. 2003a, in New Horizons in Globular Cluster Astronomy, ed. G. Piotto, G. Meylan, S. G. Djorgovski, & M. Riello, ASP Conf. Proc., 296, 151 [Google Scholar]
- Scarpa, R., Marconi, G., & Gilmozzi, R. 2003b, A&A, 405, L15 [SMG] [Google Scholar]
- Scarpa, R., Marconi, G., & Gilmozzi, R. 2004a, IAU Symp., 220, 215 [Google Scholar]
- Scarpa, R., Marconi, G., & Gilmozzi, R. 2004b, in Baryons in Dark Matter Halos, ed. R. Dettmar, U. Klein, & P. Salucci, Published by SISSA, Proc. Science, http://pos.sissa.it, 55.1 [Google Scholar]
- Scarpa, R., Marconi, G., Gilmozzi, R., & Carraro, G. 2007a, The Messenger, 128, 41 [Google Scholar]
- Scarpa, R., Marconi, G., Gilmozzi, R., & Carraro, G. 2007b, A&A, 462, L9 [NASA ADS] [CrossRef] [EDP Sciences] [Google Scholar]
- Scarpa, R., Marconi, G., Carraro, G., Falomo, R., & Villanova, S. 2010, A&A, accepted [Google Scholar]
- Sollima, A., Bellazzini, M., Smart, R. L., et al. 2009, MNRAS, 396, 2183 [S09] [NASA ADS] [CrossRef] [Google Scholar]
- Trager, S. C., King, I. R., & Djorgovski, 1995, AJ, 109, 218 [NASA ADS] [CrossRef] [Google Scholar]
- van de Ven, G., van den Bosch, R. C. E., Verolme, E. K., & de Zeeuw, P. T. 2006, A&A, 445, 513 [NASA ADS] [CrossRef] [EDP Sciences] [Google Scholar]
- van Leeuwen, F., Le Poole, R. S., Reijns, R. A., Freeman, K. C., & Zeeuw, P. T. 2000, A&A, 360, 472 [NASA ADS] [Google Scholar]
All Tables
All Figures
|
Fig. 1 The distribution of radial velocities from Sollima et al. (2009) (points) as a function of distance from the cluster center. The sample of Scarpa et al. (2003b) (crosses), limited to the region 20 < R < 30 arcmin, almost doubles the number of points in the region where a < a0. The vertical (dotted) lines indicate the limits of bins containing 100 points each (beside the last one that contains only 13 points). The average radial velocity within each bin (large open squares) is very stable with no indication of peculiar trends. The uncertainty in the average is smaller than the size of the symbols. |
| In the text | |
|
Fig. 2 Rotation (in km s-1) of ω Cen in 6 annular regions at increasing distance from the center. The number of stars in each region and the radial distance limits (in arcmin) are shown. The formal value of the maximum velocity, Vmax, and the position angle, are derived from the best fit sinusoidal model (solid line). Vmax is given in km s-1 and the position angle in degrees from north toward east. |
| In the text | |
|
Fig. 3 Plot of 125 velocity dispersion profiles, each one obtained with a different binning of the data from the S09 sample alone (upper panel), or the combined S09+SMG sample (lower panel). The envelope of all these profiles, rather than the singular points, shows the flattening of the profile beyond r ~ 20 arcmin. The velocity dispersion reported by S09 (red points with error bars) closely follows the center of the envelope. However, the value of σ = 5.2 km s-1 at r = 25.7 arcmin is not representative of the data, being in both cases at the very bottom of the envelope. The vertical line gives the MOND radius, while the horizontal one is only meant to highlight the flattening of the dispersion profile. |
| In the text | |
|
Fig. 4 The velocity dispersion profile of ω Cen as obtained considering the combined S09+SMG sample, and two different binning. Top panel: data binned as in S09. Bottom panel: narrower sampling for having one extra bin beyond the MOND radius. Points give the velocity dispersion in km s-1 and its 1σ uncertainty, while the bars in the x direction give the rms of the data in the bin. The vertical dotted line indicates the MOND radius, where the acceleration is a0. The horizontal line is not a fit to the data, but is only meant to highlight the flattening of the dispersion profile. The solid line show a Keplerian fall off. Note that all these data points fall well within the cluster tidal radius (45 arcmin). |
| In the text | |
Current usage metrics show cumulative count of Article Views (full-text article views including HTML views, PDF and ePub downloads, according to the available data) and Abstracts Views on Vision4Press platform.
Data correspond to usage on the plateform after 2015. The current usage metrics is available 48-96 hours after online publication and is updated daily on week days.
Initial download of the metrics may take a while.