Fig. 4
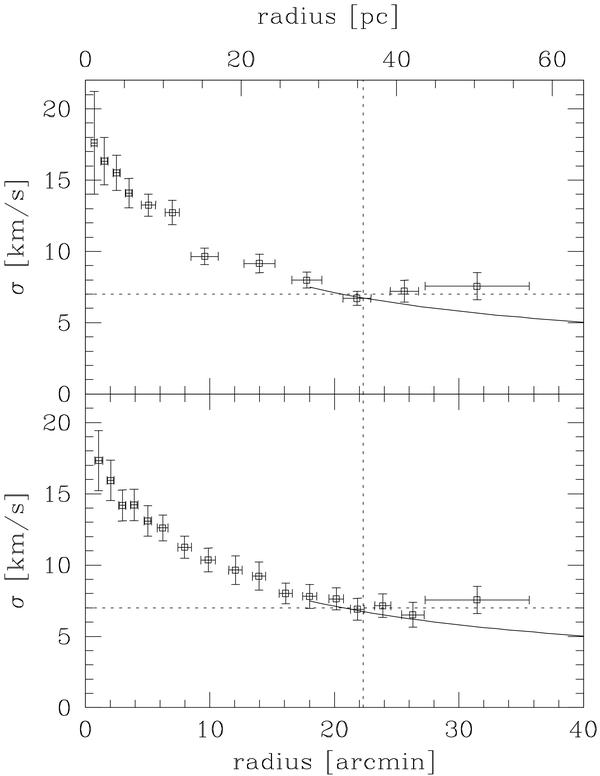
The velocity dispersion profile of ω Cen as obtained considering the combined S09+SMG sample, and two different binning. Top panel: data binned as in S09. Bottom panel: narrower sampling for having one extra bin beyond the MOND radius. Points give the velocity dispersion in km s-1 and its 1σ uncertainty, while the bars in the x direction give the rms of the data in the bin. The vertical dotted line indicates the MOND radius, where the acceleration is a0. The horizontal line is not a fit to the data, but is only meant to highlight the flattening of the dispersion profile. The solid line show a Keplerian fall off. Note that all these data points fall well within the cluster tidal radius (45 arcmin).
Current usage metrics show cumulative count of Article Views (full-text article views including HTML views, PDF and ePub downloads, according to the available data) and Abstracts Views on Vision4Press platform.
Data correspond to usage on the plateform after 2015. The current usage metrics is available 48-96 hours after online publication and is updated daily on week days.
Initial download of the metrics may take a while.