Fig. 1
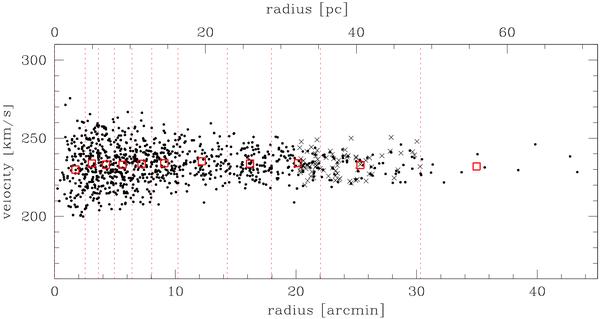
The distribution of radial velocities from Sollima et al. (2009) (points) as a function of distance from the cluster center. The sample of Scarpa et al. (2003b) (crosses), limited to the region 20 < R < 30 arcmin, almost doubles the number of points in the region where a < a0. The vertical (dotted) lines indicate the limits of bins containing 100 points each (beside the last one that contains only 13 points). The average radial velocity within each bin (large open squares) is very stable with no indication of peculiar trends. The uncertainty in the average is smaller than the size of the symbols.
Current usage metrics show cumulative count of Article Views (full-text article views including HTML views, PDF and ePub downloads, according to the available data) and Abstracts Views on Vision4Press platform.
Data correspond to usage on the plateform after 2015. The current usage metrics is available 48-96 hours after online publication and is updated daily on week days.
Initial download of the metrics may take a while.