Fig. 3
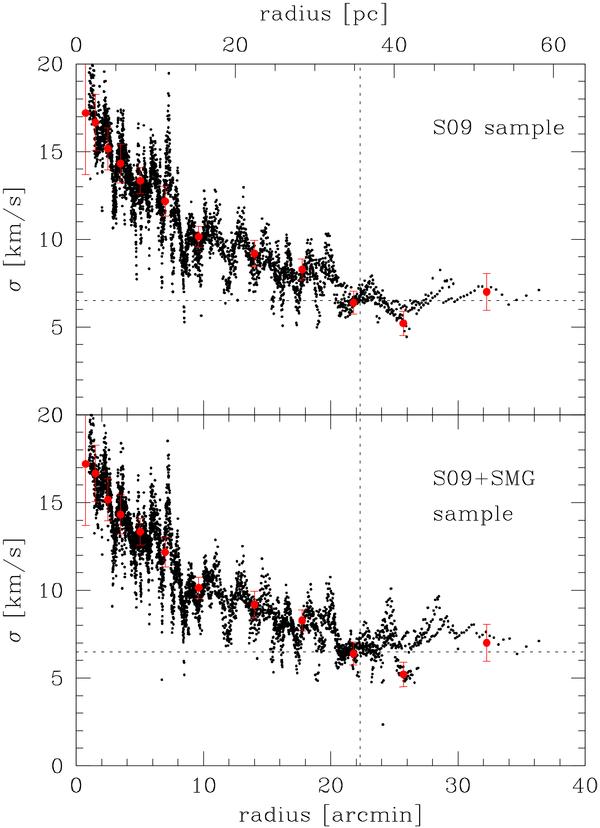
Plot of 125 velocity dispersion profiles, each one obtained with a different binning of the data from the S09 sample alone (upper panel), or the combined S09+SMG sample (lower panel). The envelope of all these profiles, rather than the singular points, shows the flattening of the profile beyond r ~ 20 arcmin. The velocity dispersion reported by S09 (red points with error bars) closely follows the center of the envelope. However, the value of σ = 5.2 km s-1 at r = 25.7 arcmin is not representative of the data, being in both cases at the very bottom of the envelope. The vertical line gives the MOND radius, while the horizontal one is only meant to highlight the flattening of the dispersion profile.
Current usage metrics show cumulative count of Article Views (full-text article views including HTML views, PDF and ePub downloads, according to the available data) and Abstracts Views on Vision4Press platform.
Data correspond to usage on the plateform after 2015. The current usage metrics is available 48-96 hours after online publication and is updated daily on week days.
Initial download of the metrics may take a while.