| Issue |
A&A
Volume 522, November 2010
|
|
|---|---|---|
| Article Number | A9 | |
| Number of page(s) | 13 | |
| Section | Stellar atmospheres | |
| DOI | https://doi.org/10.1051/0004-6361/201014250 | |
| Published online | 26 October 2010 | |
Chromium: NLTE abundances in metal-poor stars and nucleosynthesis in the Galaxy*
1
Max-Planck Institute for Astrophysics,
Karl-Schwarzschild Str. 1
85741
Garching
Germany
e-mail: This email address is being protected from spambots. You need JavaScript enabled to view it.
2
Astronomy Unit, Department of Physics, University of
Trieste, via G.B. Tiepolo
11, 34143
Trieste,
Italy
e-mail: This email address is being protected from spambots. You need JavaScript enabled to view it.
Received:
12
February
2010
Accepted:
13
June
2010
Abstract
Aims. We investigate statistical equilibrium of Cr in the atmospheres of late-type stars to ascertain whether the systematic abundance discrepancy between Cr I and Cr II lines, as often found in previous work, is due to deviations from local thermodynamic equilibrium (LTE). Furthermore, we attempt to interpret the Non-LTE (NLTE) trend of [Cr/Fe] with [Fe/H] using chemical evolution models for the solar neighborhood.
Methods. NLTE calculations are performed for the model of the Cr atom, comprising 340 levels and 6806 transitions in total. We use the quantum-mechanical photoionization cross-sections of Nahar (2009) and investigate the sensitivity of the model to uncertain cross-sections for H I collisions. NLTE line formation is performed for the MAFAGS-ODF model atmospheres of the Sun and 10 metal-poor stars with −3.2 < [Fe/H] < −0.5, and Cr abundances are derived by comparing the synthetic and observed flux spectra.
Results. We achieve good ionization equilibrium of Cr for models with different stellar parameters, if inelastic collisions with H I atoms are neglected. The solar NLTE abundance based on Cr I lines is 5.74 dex with σ = 0.05 dex, which is ~0.1 dex higher than the LTE abundance. For the metal-poor stars, the NLTE abundance corrections to Cr I lines range from + 0.3 to + 0.5 dex. The resulting [Cr/Fe] ratio is roughly solar for the range of metallicities analyzed here, which is consistent with current views on the production of these iron peak elements in supernovae.
Conclusions. The tendency of Cr to become deficient with respect to Fe in metal-poor stars is an artifact caused by the neglect of NLTE effects in the line formation of Cr i, and has no relation to any peculiar physical conditions in the Galactic ISM or deficiencies of nucleosynthesis theory.
Key words: line: formation / line: profiles / Sun: abundances / stars: abundances / nuclear reactions, nucleosynthesis, abundances / Galaxy: evolution
Table 4 is only available in electronic form at http://www.aanda.org
© ESO, 2010
1. Introduction
Abundances of chemical elements in the atmospheres of late-type stars provide key information about Galactic chemical evolution (GCE). Combinations of different elements and the variation in their abundances with metallicity are commonly used to calibrate GCE models and constrain poorly-known parameters, such as star formation history, initial mass function, and efficiency of mixing in the ISM. Since stellar yields are also a part of these models, the abundances can also test the theories of stellar nucleosynthesis and evolution and highlight any of their intrinsic problems.
Abundances are derived by computing line formation for an element under investigation in a given model atmosphere and compare a model spectrum with an observed spectrum. Whereas a poor quality observed spectrum introduces some random noise about the true value of the abundance, major systematic errors are produced by an oversimplified treatment of radiation transfer and convection in stellar atmospheres (Asplund 2005). The assumption of local thermodynamic equilibrium (LTE), which is traditionally used to compute a spectrum in an attempt to avoid numerical difficulties with line formation, breaks down for many species. Minority ions, which constitute at most a few percent of the total element abundance, are particularly affected by NLTE conditions. As a consequence, various abundance indicators of the same element, such as lines of different ionization stages or excitation potentials, often provide discrepant results in 1D LTE analysis. The main concern is that once observations compel us to restrict our analysis to a single indicator, e.g., due to a moderate signal-to-noise ratio or limited spectral range, spurious abundance trends with metallicity are unavoidable.
For Cr, even-Z element of the Fe-group, only LTE calculations have been performed up to now. They have revealed severe problems with modelling the excitation and ionisation balance of Cr in the atmospheres of late-type stars. Systematic differences of 0.1–0.5 dex between abundances based on LTE fitting of the Cr i and Cr ii lines were reported for metal-poor giants and dwarfs (Johnson 2002; Gratton et al. 2003; Lai et al. 2008; Bonifacio et al. 2009). The discrepancies are smaller in the atmospheres with a higher metal content, amounting to ~0.1 dex for Galactic disk stars (Prochaska et al. 2000) and the Sun (Sobeck et al. 2007; Asplund et al. 2009). Following Gratton & Sneden (1991), these offsets are usually attributed to the overionization of Cr i, a typical NLTE phenomenon affecting minority atoms in stellar atmospheres. Alternatively, Bai et al. (2004) suggested an uneven distribution of neutral and ionized Cr in different atmospheric layers, which depends on stellar parameters.
As a result, two views about the evolution of Cr abundances in the Galaxy exist in the literature. The constant [Cr/Fe] with metallicity is derived from the LTE analysis of Cr ii lines (Gratton & Sneden 1991; Bonifacio et al. 2009) that has a simple interpretation in the theory of nucleosynthesis. The Cr is formed with Fe in explosive Si-burning that occurs in supernova (SN) events, and the production ratio Cr/Fe is roughly solar in both SNe II and SNe Ia (Clayton 2003). Thus, using standard prescriptions for Cr nucleosynthesis, most of the GCE models reproduce the flat [Cr/Fe] trend with [Fe/H] (e.g., Timmes et al. 1995; Samland 1998; Goswami & Prantzos 2000).
On the other hand, most LTE analysis of Cr i lines (McWilliam et al. 1995; Cayrel et al. 2004; Cohen et al. 2004) indicate that the [Cr/Fe] ratio steadily declines towards the lowest metallicity. There is no simple explanation for this trend. Some chemical evolution studies have tried to overcome the problem by introducing correction factors to the theoretical SN yields (François et al. 2004; Henry et al. 2010). The assumption of erroneous supernova yields is not unrealistic, given their sensitivity to the details of explosion (Iwamoto et al. 1999; Nakamura et al. 1999). However, to reproduce an approximate trend given by spectroscopic data, arbitrary scaling factors to stellar yields are usually chosen, which lack any physical justification. Recent studies of metal-free massive stars and their nucleosynthesis yields have demonstrated that subsolar Cr/Fe abundance ratios in very metal-poor stars cannot be reproduced by any combination of SN II model parameters (Umeda & Nomoto 2005; Heger & Woosley 2008), especially when other Fe-peak elements are taken into account.
In this paper, we report NLTE abundances of Cr for the Sun and a sample of dwarfs and subgiants with −3.2 ≤ [Fe/H] ≤ −0.5. The atomic model for Cr and details about NLTE calculations are documented in Sect. 2. The statistical equilibrium of Cr under restriction of different stellar parameters in discussed in Sect. 3. In Sect. 4, we present the NLTE analysis of solar Cr i and Cr ii lines and derive the solar Cr abundance. In Sect. 5, we describe the observed spectra, stellar parameters, and present Cr abundances for a sample of metal-poor stars. Finally, in Sect. 6, the revised abundance ratios [Cr/Fe] are compared with the trends predicted by GCE models and some implications for the evolution of Cr in the Galaxy are discussed.
2. The methods
2.1. Statistical equilibrium calculations
Restricted NLTE calculations for Cr were performed with the code DETAIL (Butler & Giddings 1985). In the latest version of the code, radiative transfer is based on the method of accelerated lambda iteration.
The reference atomic model was constructed with 114 levels for Cr i and 225 levels for Cr ii, with energies of 0.01 eV and 1.1 eV below the respective ionization limits, 6.77 eV and 16.49 eV. The model was closed by the Cr iii ground state. The typical separation of fine structure components in Cr i and Cr ii is smaller than 0.1 eV. Hence, we did not include fine structure in statistical equilibrium (SE) calculations. Each term was represented by a single level with a total statistical weight of the term and energy weighted by statistical weights of fine structure components. Transitions are grouped. All transitions with oscillator strengths log gf ≤ −8 and wavelengths λ ≥ 20 000 Å were neglected. As a result, the number of radiatively-allowed transitions was limited to 1590 and 5216 for Cr i and Cr ii, respectively. Level excitation energies and oscillator strengths were taken from the Kurucz online database1, supplemented by the experimental data of Murray (1992). The Grotrian diagram of the Cr i model atom is shown in Fig. 1. The atomic data for some levels, including level designations, statistical weights g, excitation energies Eexc, wavelengths λthr, and cross-sections σthr at ionization thresholds, are given in Table 1.
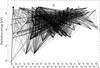 |
Fig. 1 Grotrian diagram of the Cr i model atom. Lines represent allowed transitions included in the model atom. |
The following atomic processes were taken into account in calculations of transition
rates: radiative bound-bound and bound-free transitions, excitation and ionization by
collisions with free electrons, and neutral hydrogen atoms. Scattering processes follow
complete frequency redistribution. Photoionization cross-sections for 49 quintet and
septet states of Cr i were adopted from Nahar
(2009). In these quantum-mechanical calculations, many Cr i states
exhibit prominent resonances, which are due to the photoexcitation of the core,
Cr ii, leading to autoionization. The proper treatment of the latter process,
e.g., transitions to autoionizing states and ionization into excited core states, is not
yet possible with the DETAIL code. Thus, we used partial cross-sections for ionization
into the ground state of Cr ii, which are lower than the total cross-sections at
energies above the first excited state of the core, λ ≤ 1500 Å. This is
a reasonable approximation for cool stellar atmospheres, because temperatures are lower
than those needed for core excitation. We also shifted the cross-sections to the observed
edge energies of Cr i states from the NIST2
database, because the latter are more accurate than the calculated LS term energies from
Nahar (2009). Photoionization from the other
Cr i and Cr ii states was computed with a formula of Kramer (Menzel & Pekeris 1935) corrected for the ion
charge (Rutten 2003) and using the effective
hydrogen-like principle quantum number n*. The use of
effective quantum number increases the cross-sections at the ionization edge for low-lying
levels and reduces them for some levels of high excitation that is more realistic than the
original hydrogenic approximation. The quantum-mechanical cross-section
σQM(ν) for the state
 is
compared with the hydrogenic approximation
σhyd(ν) in Fig. 2. The cross-section at the photoionization edge, as well as the
background, is larger than σhyd(ν). There are
also strong resonances at energies, where the solar atmospheric UV flux is sufficiently
strong to produce the overionization of the state.
Quantum-mechanical cross-sections for the other levels with excitation energies
Eexc ≈ 3–4 eV show a similar behavior. We show in
Sect. 3 that these levels dominate the ionization
balance of Cr i.
is
compared with the hydrogenic approximation
σhyd(ν) in Fig. 2. The cross-section at the photoionization edge, as well as the
background, is larger than σhyd(ν). There are
also strong resonances at energies, where the solar atmospheric UV flux is sufficiently
strong to produce the overionization of the state.
Quantum-mechanical cross-sections for the other levels with excitation energies
Eexc ≈ 3–4 eV show a similar behavior. We show in
Sect. 3 that these levels dominate the ionization
balance of Cr i.
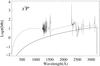 |
Fig. 2 Photoionization
cross-section for the
|
Selected levels of Cr i in the model atom.
At present, there are no experimental and accurate theoretical data for ionization and excitation in Cr i by electron impact, as well as inelastic collisions with H i. Thus, we relied on the commonly-used approximations. Cross-sections for continuum and allowed discrete transitions due to inelastic collisions with H i were computed with the formulae of Drawin (1969). This original recipe was developed for collisions between equal hydrogen-like particles, hence we applied a scaling factor 0 ≤ SH ≤ 5 to the Drawin cross-sections. The final choice of SH is discussed in Sect. 5.2. The rates of allowed and forbidden transitions caused by collisions with electrons were calculated from the formulae of van Regemorter (1962) and Allen (1973), respectively. The accuracy of the electron-impact cross-sections adopted in this work is not better than that for collisions with neutral atoms (Mashonkina 1996). However, the excitation and ionization balance in Cr i/Cr ii, as well as abundances of Cr determined from the lines of both ionization stages, depend only weakly on the exact treatment of inelastic e− collisions. Our calculations show that even in the solar atmosphere the rates of ionization by collisions with H i atoms dominate over the rates of ionization by electrons for the majority of the Cr levels, exceeding the latter by nearly three orders of magnitude for the uppermost levels. Moreover, collisional ionization rates dominate over collisional excitation rates. In the atmospheres of metal-poor stars, where the number density of free electrons is lower than in the Sun, collisional excitation in Cr i is fully controlled by neutral hydrogen.
In addition to the reference atomic model of Cr, which is described above, we constructed several test models. These models were used to investigate how the statistical equilibrium of Cr changes under variations in different atomic parameters, such as the size of the model atom, the cross-sections of collisional and radiative transitions.
2.2. Model atmospheres and spectrum synthesis
To maintain consistency in the abundance calculations, we decided to use the same type of model atmospheres, as employed for the derivation of stellar parameters (see Sect. 5), microturbulence velocities, and metallicites of the objects investigated in this work. These are classical static 1D plane-parallel models MAFAGS-ODF without chromospheres (Fuhrmann et al. 1997). Line blanketing was treated with opacity distribution functions from Kurucz (1992). Convection was taken into account with the mixing-length theory (Böhm-Vitense 1958) and the mixing length was set to 0.5 pressure scale heights. This value was chosen by Fuhrmann et al. (1993) to provide simultaneously the best fitting of Balmer line profiles in the solar flux spectrum with Teff = 5780 K. Barklem et al. (2002) also suggest that the best fit of solar Balmer lines can be achieved with α = 0.5. Stratifications of temperature and pressure in MAFAGS-ODF are similar to those given by other comparable models (see Fig. 15 in Grupp 2004).
The abundances of Cr were computed by a method of spectrum synthesis with the code SIU, kindly provided by T. Gehren (private communication). Standard line broadening mechanisms, including broadening caused by collisions with H i, and radiative and quadratic Stark damping were taken into account (see Sect. 4).
3. Statistical equilibrium of Cr
The departures of atomic level populations  from their LTE values
 are most clearly understood by
inspecting departure coefficients, defined as
are most clearly understood by
inspecting departure coefficients, defined as  . The departure coefficients
for selected Cr i and Cr ii levels calculated for the solar model
atmosphere (Teff = 5780 K, log g = 4.44, [Fe/H]
= 0, ξt = 0.9 km s-1) with different atomic models
are shown as a function of continuum optical depth log τc at 500
nm in Fig. 3. We discuss mainly NLTE effects in
Cr i, because the majority of Cr ii levels remain very close to LTE for
the range of stellar parameters we are interested in. As seen in the Grotrian diagram
(Fig. 1), Cr is a very complex atomic system because
a partially filled 3d electron shell results in a highly complex term structure with many
low-lying and closely-spaced energy levels. Hence, in contrast to simpler atoms such as Li
(Shi et al. 2007, Fig. 2) or Na (Baumueller et al. 1998, Fig. 2), clear isolation of
transitions driving departures from LTE is not trivial. We restrict the discussion of
statistical equilibrium (SE) in Cr to a few simple cases, which are illustrated with a few
levels characteristic of their depth dependency (Fig. 3).
. The departure coefficients
for selected Cr i and Cr ii levels calculated for the solar model
atmosphere (Teff = 5780 K, log g = 4.44, [Fe/H]
= 0, ξt = 0.9 km s-1) with different atomic models
are shown as a function of continuum optical depth log τc at 500
nm in Fig. 3. We discuss mainly NLTE effects in
Cr i, because the majority of Cr ii levels remain very close to LTE for
the range of stellar parameters we are interested in. As seen in the Grotrian diagram
(Fig. 1), Cr is a very complex atomic system because
a partially filled 3d electron shell results in a highly complex term structure with many
low-lying and closely-spaced energy levels. Hence, in contrast to simpler atoms such as Li
(Shi et al. 2007, Fig. 2) or Na (Baumueller et al. 1998, Fig. 2), clear isolation of
transitions driving departures from LTE is not trivial. We restrict the discussion of
statistical equilibrium (SE) in Cr to a few simple cases, which are illustrated with a few
levels characteristic of their depth dependency (Fig. 3).
The NLTE effects in Cr i are similar to those of the other minority atoms with
complex configuration structure in cool stellar atmospheres, such as Fe i,
Mn i, and Co i. Deviations from LTE in Cr i develop in the
layers where the mean intensity Jν exceeds the
Planck function
Bν(Te) over the
bound-free edges of significantly-populated low-lying Cr i levels. Analysis of
radiative rates shows that the overionization is particularly strong from the odd levels
with large photoionization cross-sections, e.g.,
(λthr = 3209 Å, Fig. 2),
 (λthr = 3431 Å), and
  (λthr = 3599 Å). Thus, their
bi drop below unity already at
log τc ~ + 0.3 (Fig. 3a). Overionization affects other low-excitation levels with
Eexc ~2–4 eV, although the net ionization rates are by orders
of magnitude lower than the rates from, e.g., the level. The cross-section
of the ground state
(λthr = 3599 Å). Thus, their
bi drop below unity already at
log τc ~ + 0.3 (Fig. 3a). Overionization affects other low-excitation levels with
Eexc ~2–4 eV, although the net ionization rates are by orders
of magnitude lower than the rates from, e.g., the level. The cross-section
of the ground state  shows a number of
autoionization resonances at λ ≤ 1700 Å, where solar fluxes are too low to
produce significant ionization. The Cr i ground state is underpopulated by means of
resonance transition in the multiplet 4 ( −
shows a number of
autoionization resonances at λ ≤ 1700 Å, where solar fluxes are too low to
produce significant ionization. The Cr i ground state is underpopulated by means of
resonance transition in the multiplet 4 ( −  ),
which is in detailed balance at log τc ≥ −1.5, and by
collisions with the lowest metastable states, which are overionized. The regular behavior of
the departure coefficients for the majority of Cr i levels at
log τc ≥ −2 confirms the dominance of radiative
overionization at these depths with some deviations from relative thermal equilibrium
between low levels (compare levels and
in Fig. 3a) reflecting the non-hydrogenic character of their
photoionization cross-sections. We also performed SE calculations with photoionization
cross-sections for all Cr i levels derived from hydrogenic approximation. In this
case, departure coefficients are homogeneously distributed up to the depths
log τc ~ −1.5 (Fig. 3b), bi being a nearly monotonic
function of the level ionization potential.
),
which is in detailed balance at log τc ≥ −1.5, and by
collisions with the lowest metastable states, which are overionized. The regular behavior of
the departure coefficients for the majority of Cr i levels at
log τc ≥ −2 confirms the dominance of radiative
overionization at these depths with some deviations from relative thermal equilibrium
between low levels (compare levels and
in Fig. 3a) reflecting the non-hydrogenic character of their
photoionization cross-sections. We also performed SE calculations with photoionization
cross-sections for all Cr i levels derived from hydrogenic approximation. In this
case, departure coefficients are homogeneously distributed up to the depths
log τc ~ −1.5 (Fig. 3b), bi being a nearly monotonic
function of the level ionization potential.
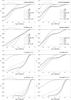 |
Fig. 3 Departure coefficients bi of selected Cr i and Cr ii levels as a function of optical depth at 500 nm. Panels a) to d) present results for the solar model atmosphere. a) The reference model atom with a total of 374 levels constructed as described in Sect. 2.1. Hydrogen collision rates are multiplied by SH = 0.05. Photoionization cross-sections for Cr i are taken from Nahar (2009). b) Same as a), but hydrogenic photoionization cross-sections are used for all levels. c) Same as a), but SH = 0. d) The reduced model atom with a total of 108 levels including the Cr ii ground state, SH = 0.05. e) to h) same as a), but the model atmospheres are taken from the grid with stellar parameters specified in each panel. Note that some levels on the plots are in thermal equilibrium with the other levels. |
Line transitions influence Cr i excitation balance in the outer layers,
log τc ≤ −2, where departure coefficients of the levels
deviate markedly from unity and from each other (Fig. 3a). Pumping by superthermal radiation with
Jν > Bν(Te)
becomes important in the layers, where optical depth in the wings of strong low-excitation
lines drops below unity. Detailed balance in the transitions does not hold and their upper
levels are overpopulated. As soon as line cores form,  , spontaneous transitions
depopulate the upper levels and their bi
steeply decrease. The spectrum of Cr i is represented by a large number of lines in
the near-UV, which are subject to these non-equilibrium excitation effects. The transitions
in the multiplet 4, which sustain thermal equilibrium between and
at
log τc ≥ −1, now go out of the detailed balance and there is
a small net radiative absorption leading to the overpopulation of
(Fig. 3a). At
log τc ~ −3, photon pumping ceases, because in the cores of
the resonance lines ,
hence the departure coeficient of the level drops. The levels
with Eexc ~2.9–3.4 eV are radiatively connected with the
uppermost levels, which are separated by an energy gap ≤ 0.5 eV from the continuum, e.g.
transitions −
, spontaneous transitions
depopulate the upper levels and their bi
steeply decrease. The spectrum of Cr i is represented by a large number of lines in
the near-UV, which are subject to these non-equilibrium excitation effects. The transitions
in the multiplet 4, which sustain thermal equilibrium between and
at
log τc ≥ −1, now go out of the detailed balance and there is
a small net radiative absorption leading to the overpopulation of
(Fig. 3a). At
log τc ~ −3, photon pumping ceases, because in the cores of
the resonance lines ,
hence the departure coeficient of the level drops. The levels
with Eexc ~2.9–3.4 eV are radiatively connected with the
uppermost levels, which are separated by an energy gap ≤ 0.5 eV from the continuum, e.g.
transitions −  with
λ ~3880 Å. Net radiative rates in these transitions are positive at
log τc > −2, but overpopulation of
the upper levels does not occur because they are strongly coupled to the fully thermalized
Cr ii ground state. This coupling is maintained by collisions with H i,
which exceed the respective rates of ionization caused by collisions with electrons by few
orders of magnitude. There is also a sequence of spontaneous de-excitations through the
densely packed upper levels with Eexc ~5–6 eV, which is driven
by
Jν < Bν(Te)
at the corresponding frequencies.
with
λ ~3880 Å. Net radiative rates in these transitions are positive at
log τc > −2, but overpopulation of
the upper levels does not occur because they are strongly coupled to the fully thermalized
Cr ii ground state. This coupling is maintained by collisions with H i,
which exceed the respective rates of ionization caused by collisions with electrons by few
orders of magnitude. There is also a sequence of spontaneous de-excitations through the
densely packed upper levels with Eexc ~5–6 eV, which is driven
by
Jν < Bν(Te)
at the corresponding frequencies.
Figure 3c illustrates the behavior of Cr i
level populations, when inelastic collisions with H i are neglected,
SH = 0. Underpopulation of the levels at all optical depths is
amplified, and the uppermost levels, such as ,
decouple from the continuum already at log τc ≈ 0. Large
differences from the reference model (Fig. 3a),
computed with SH = 0.05, are seen at
log τc < −1.5, where electronic
collisions are also ineffective. Hence, we expect significant changes in the opacity of the
cores of strong Cr i lines under NLTE. At
log τc > −2, departure coefficients
of high-excitation levels also differ from the case in which
SH = 0.05, thus affecting the source functions of
intermediate-strength lines.
Removal of the high-excitation Cr i levels also leads to slightly greater deviations from LTE in Cr i, although the variation in departure coefficients with depth at −2 < log τc < 0 does not differ from the reference complete atomic model. Results for the reduced model atom, constructed with 108 levels of Cr i with excitation energy of the highest level 6.76 eV and closed by the Cr ii state, are shown in Fig. 3d. This model is devoid of some doubly-excited Cr ii states below the first ionization threshold and only transitions with log gf > −1 are included. Note the amplified underpopulation of the low and intermediate-excitation levels compared to the reference model. This result can be easily understood as being caused by the reduced radiative and collisional interaction of the Cr i levels with each other and the continuum. Thus, the rates of recombination and subsequent spontaneous de-excitation to the lower levels via weak infrared transitions, where Jν < Bν(Te), are low.
Statistical equilibrium of Cr in the atmospheres of cool subdwarfs and subgiants is
established by radiative processes. NLTE effects on the levels of Cr i and
Cr ii are higher than in the solar case. The main reason is the low abundances of
metals, which supply free electrons and produce line blanketing in the short wavelength part
of a spectrum. Hence, higher UV fluxes at bound-free edges of low-excitation Cr i
levels lead to their strong underpopulation, and collisional coupling between the
levels is very weak due to a deficiency of electrons. As an example, we consider a
metal-poor turnoff star with [Fe/H] = −2.4 (Fig. 3e). Ionization balance is dominated by radiative transitions from the
low-excitation Cr i levels. At
−1 < log τc < 0.2,
these levels are depopulated by both overionization and optical pumping in strong resonance
lines, connecting the levels of and
terms. At log τc < −1, photon pumping
ceases because the lines become optically thin, and spontaneous de-excitations maintain
relatively constant bi of the
state in the outer layers.
An interesting result is the presence of small deviations from LTE for
intermediate-excitation Cr ii levels. As seen in the Fig. 3e, the odd level  with excitation energy
6.2 eV is slightly overpopulated by optical pumping at
−2 < log τc < 0.
However, at smaller depths, photon losses in transitions of the multiplet
with excitation energy
6.2 eV is slightly overpopulated by optical pumping at
−2 < log τc < 0.
However, at smaller depths, photon losses in transitions of the multiplet
 −
result in a depopulation of the upper level. We use the lines of this multiplet in our
abundance analysis.
−
result in a depopulation of the upper level. We use the lines of this multiplet in our
abundance analysis.
Effective temperature and gravity do not affect the distribution of atomic level
populations at solar metallicity but become increasingly important with decreasing [Fe/H].
The results for the model with Teff = 6400 K,
log g = 4.2, and [ Fe/H ] = 0 (Fig. 3f) are almost indistinguishable from those obtained with
the solar model atmosphere at optical depths
log τc > −3. This is stipulated by
greater collisional interaction among the Cr i levels with
Eexc > 3 eV. Although the model flux
maximum is shifted to shorter wavelengths, ground-state ionization is still inefficient
because the edge cross-section of the
state is very low. In the cool model atmospheres, deviations from LTE depend on the stellar
gravity, and the effect is most pronounced at low metallicity. At
[ Fe/H ] = −3, departures from LTE for Cr i levels are
stronger in the model with Teff = 5000 K and
log g = 2.6 than in the model with
Teff = 6000 K and log g = 4.2 (Fig. 3g, h). This may account for a systematic difference
between metal-poor giants and dwarfs found by Lai et al.
(2008) and Bonifacio et al. (2009, see discussion in Sect. 5.2).
The atomic model of Cr used in this work is not computationally tractable in full NLTE calculations with 3D model atmospheres (see e.g. Botnen & Carlsson 1999, for Ca), which require reduction of the model. Our analysis suggests that it is possible to construct a simpler model of the Cr atom, which inherits the basic properties of the complete model and has similar performance under restriction of different stellar parameters. In particular, removal of high-excitation levels and numerous weak transitions in the Cr i atom, whose main effect is to provide stronger coupling of levels, can be compensated by increasing collisional interaction between them. The carefully chosen scaling factor to inelastic H i collisions helps compensate for the missing transitions: for Cr i, the reduced model with 108 levels and SH = 0.15 provides a similar description of the statistical equilibrium in Cr for solar-type stars to the complete reference model with 340 levels and SH = 0.05. However, there are two important concerns. First, that the simple model atom performs well in 1D does not guarantee that accurate results are obtained with the same atomic model with 3D convective model atmospheres (Asplund 2005). In addition, substituting the multitude of levels and transitions in Cr i by a higher efficiency of collisions with H i (although both seem to produce the same effect on level populations) has certainly no physical justification. Our result even suggests that large scaling factors in the Drawin’s formula, as sometimes found in the literature, may stem from the missing atomic data in SE calculations.
4. Solar lines of Cr i and Cr ii
All lines of Cr i and Cr ii selected for the solar abundance analysis are given in Table 2. Wavelengths λ and excitation energies of the lower levels of the transitions Elow are taken from the NIST database. The multiplet is specified in the 3-d column of the table. Line half-widths due to elastic collisions with H i are calculated using the cross-sections and velocity exponents tabulated by Anstee & O’Mara (1995). In Table 2, they are given in terms of van der Waals damping constants log C6, calculated for the temperature 6000 K. The log (gfε) value is a combination of the abundance computed for each Cr line in the solar spectrum and its oscillator strength log gf.
We used the MAFAGS-ODF model atmosphere (Sect. 2) with solar parameters. The profiles were broadened by the solar rotation Vrot, ⊙ = 1.8 km s-1 , microturbulence velocity ξt = 0.9 km s-1 , and by a radial-tangential macroturbulence velocity Vmac = 2.5...4 km s-1. Radial and tangential components of Vmac were assumed to be equal, and velocity distribution for each component is Gaussian. Macroturbulence velocity is allowed to vary with the line strength and depth of formation. The comparison spectrum was taken from the Solar Flux Atlas of Kurucz et al. (1984).
Lines of Cr i and Cr ii selected for solar and stellar abundance calculations.
Oscillator strengths for the Cr i lines were taken from two sources. Most of the data were taken from Sobeck et al. (2007), who determined branching ratios of transitions by Fourier transform spectroscopy. The accuracy of log gf values was within 5–10% for the majority of transitions. In the absence of data from Sobeck et al., we used transition probabilities from Blackwell et al. (1986) measured with the absorption technique. Fuhr et al. (1988) ascribe 10% accuracy to these values. Oscillator strengths for the majority of Cr ii lines were taken from Nilsson et al. (2006). Branching ratios were measured with a Fourier transform spectrometer and combined with lifetimes from a laser-induced fluorescence experiment. The uncertainty in the absolute oscillator strengths is 12–16% for the transitions used in this work, except for the Cr ii line at 4592 Å that has an uncertainty of 37%. For the lines at 4555 and 4812 Å, we used the log gf’s from Wujec & Weniger (1981), and the Cr ii lines of multiplet 43 were calculated with log gf’s derived from the solar spectrum analysis by Kostyk & Orlova (1983). The accuracy of log gf values from Wujec & Weniger (1981) and Kostyk & Orlova (1983) was later revised by Fuhr et al. (1988) to be of the order of 50%.
The LTE abundance of Cr determined from the Cr i lines is log ε = 5.66 ± 0.04 dex, where the uncertainty is one standard deviation. Our LTE abundance is consistent with the meteoritic value, 5.63 ± 0.01 dex3. Sobeck et al. (2007) calculated log ε = 5.64 ± 0.04 dex from equivalent widths of Cr i lines in the disk-center intensity spectrum. The agreement of our LTE abundance with that of Sobeck et al. is surprising, since these authors used a semi-empirical Holweger-Müller model atmosphere and assumed a lower value of the microturbulence velocity, ξt = 0.8 km s-1. The abundances of Cr based on the LTE analysis of Cr ii lines are similar in our study to that of Sobeck et al., 5.81 ± 0.13 dex and 5.77 dex with σ = 0.13 dex, respectively.
The LTE analysis of Cr lines revealed two problems. First, there is an abundance discrepancy of ~0.15 dex between Cr i and Cr ii lines, which also appears in the study of Sobeck et al. The line-to-line abundance scatter for Cr ii is also large, σ = 0.13 dex. Second, there is a large spread in abundances within the multiplet 18: profile fitting of the Cr i lines with equivalent widths Wλ > 60 mÅ requires systematically higher abundances by ~0.1 dex than lines with smaller Wλ. A similar discrepancy was noted by Blackwell et al. (1987), who explained this with non-thermal excitation in the multiplet 18. Sobeck et al. did not support the Blackwell’s conclusion, although a 0.1 dex line-to-line scatter in this multiplet is also present in their results. In the next paragraph we show, whether either of these two problems can be solved with NLTE.
The NLTE line formation is based on the departure coefficients bi computed with the reference model of Cr atom (Sect. 2). We performed test calculations for two scaling factors for inelastic collisions with hydrogen, SH = 0 and 0.05. In both cases, NLTE corrections to abundances derived from Cr i lines are positive and range from 0.05 to 0.1 dex, depending on the line strength and the excitation potential of the lower level. All Cr i lines computed under NLTE with SH = 0, reproduce the observed spectrum with the Cr abundance log ε = 5.74 ± 0.05 dex, whereas a scaling factor SH = 0.05 leads to log ε = 5.7 ± 0.04 dex. The NLTE abundance corrections to the Cr ii lines are small and negative. The results for SH = 0 and SH = 0.05 are equal, log ε = 5.79 ± 0.12 dex. In contrast to LTE, the difference between both ionization stages is now fairly small, log ε(Crii) − log ε(Cri) = 0.05 dex for SH = 0, and is within the combined errors of both values. At present, we cannot determine the cause of the discrepancy between the abundance of Cr in meteorites and our NLTE 1D abundance for the solar photosphere. The accuracy claimed for oscillator strengths of Cr ii and Cr i transitions measured by Nilsson et al. (2006) and Sobeck et al. (2007), respectively, is very high. There is evidence that lines of a similar atom Fe i are affected by convective surface inhomogeneities, and that NLTE effects on Fe i lines are different in 1D and in 3D radiative transfer calculations (see below). For Cr, such detailed investigations are not yet available.
Our reference NLTE model satisfies ionization equilibrium of Cr, but does not solve the problem of overestimated abundances from several lines of multiplet 18. The solar NLTE abundance corrections4 ΔNLTE for all lines of this multiplet are equal and scale with the SH parameter. The behaviour of line profiles under NLTE can be understood from the analysis of level departure coefficients bi at the depths of line formation. The formation of weak lines with Wλ < 60 mÅ is confined to −1 < log τc < 0, where bi = bj, such that line source functions are thermal, Sij = Bν. Hence, line intensity profiles reflect the profile of an absorption coefficient, κν ~bi. Since bi < 1, the lines are weaker relative to their LTE strengths and ΔNLTE is positive. Radiation in stronger lines of the multiplet 18 comes from the depths −4 < log τc < 0. The line cores have lower intensities under NLTE because of the depleted source functions, Sij < Bν, at log τc < −2. However, their wings, which dominate the total line strength, are formed at the depths where bi < 1 due to overionization. The net effect on the line profile is that the NLTE abundance correction is positive. For all lines of multiplet 18, we found that ΔNLTE ≈ + 0.1 dex and + 0.05 dex for SH = 0 and SH = 0.05, respectively. The result was incompatible with the suggestion of Blackwell et al. (1987), since the latter would require NLTE effects of different magnitude for all lines of multiplet 18. Moreover, in our “extreme” NLTE model with SH = 0, the net NLTE effect on the profiles of stronger lines must be zero to eliminate the abundance scatter. If this problem is due to a deficiency of the atomic model, our main concern is the crude approximation used for inelastic collisions with H i. Compared to the Drawin’s formulae, ab initio quantum-mechanical calculations (Belyaev et al. 1999; Belyaev & Barklem 2003) predict significantly lower collision rates for certain transitions of simple alkali atoms, and show that, in addition to excitation, other effects such as ion-pair formation become important. Thus, in principle, any rescaling of the Drawin’s cross-sections, e.g. using variable SH for levels of different excitation energies as exemplified by Baumueller & Gehren (1996), does not improve the reliability of results. Variation in SH does not reduce the scatter among the Cr ii lines, because the NLTE effects are very small even for SH = 0. For the same reason, the employment of an LTE versus a NLTE approach does not decrease the scatter.
The abundance anomaly among some Cr i and Cr ii lines may reflect shortcomings of the 1D static mixing-length model atmospheres. Discrepant Cr i and Cr ii lines with 70 < Wλ < 120 mÅ are very sensitive to a variation in the microturbulence parameter as was also demonstrated for Fe i lines with similar equivalent widths (Gehren et al. 2001b). For Δξt = ± 0.2 km s-1 with respect to the reference value 0.9 km s-1, the abundances derived from the Cr i lines of multiplet 18 change by roughly ∓ 0.1 dex, and any combination of ξt and log ε leads to an equally good profile fit (Fig. 4). The use of the depth-dependent microturbulence as suggested by Holweger (1967) does not eliminate the abundance scatter among Cr i lines, although the Cr ii lines are strengthened requiring 0.1–0.15 dex lower abundances.
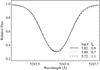 |
Fig. 4 NLTE profiles of the Cr i line at 5247 Å. Different combinations of microturbulent velocities ξt and resulting Cr abundances log ε are shown. The line shows a convective asymmetry. |
Stellar parameters for the selected sample.
Our approach to solving line formation in 1D homogeneous models with a two-component Gaussian velocity field is simple compared to multidimensional radiative transfer calculations (e.g. Asplund et al. 2000). Steffen & Holweger (2002) demonstrated that abundance corrections required because of photospheric temperature fluctuations vary in sign and magnitude for lines of different Elow, λ, and Wλ. For saturated lines, the effects of hydrodynamic velocity fields are also predicted. There is also evidence that NLTE effects on atomic level populations are amplified in the presence of convective surface inhomogeneities (e.g. Shchukina & Trujillo Bueno 2001, for the Sun). Neutral iron is strongly overionized above hot granules compared to cooler intergranular regions with the maximum effect on the opacity of low-excitation Fe i lines with Elow < 2 eV. Deviations of the source function from Bν(Te) are important to higher-excitation lines in the intergranular regions. Shchukina & Trujillo Bueno also find that strong lines of any excitation potential formed above log τc ~ −2.5 are sensitive to the variation in the collision rates. Comparable effects can be expected for the lines of Cr i, hence a systematic study of 3D effects in Cr is necessary to confirm this. Asplund et al. (2009) computed LTE line formation for Cr i and Cr ii with a hydrodynamical model atmosphere. Applying NLTE abundance corrections derived from our 1D modelling, Asplund et al. obtained the solar Cr abundance 5.64 ± 0.04 dex, which is almost equal to our LTE 1D solar abundance determined from the Cr i lines. In addition, Bonifacio et al. (2009) provide an order-of-magnitude estimate of 3D effects on the Cr line formation in very metal-poor atmospheres. We briefly discuss this paper in Sect. 5.2.
Finally, we note that all problematic Cr ii lines are located in the spectral region 4500–4800 Å, where the continuum level is uncertain due to severe blending. Hence, the abundance discrepancy may be, at least in part, removed by adjusting the local continuum. On the other side, this procedure could also affect Cr i lines located in this spectral region.
5. Abundances of Cr in metal-poor stars
5.1. Observations and stellar parameters
The list of stars along with their parameters is given in Table 3. Most of the stars were observed by T. Gehren and collaborators with UVES spectrograph at the VLT UT2 on the Paranal, Chile, in 2001, and/or with the FOCES echelle spectrograph mounted at the 2.2 m telescope of the CAHA observatory on Calar Alto. The observations of HD 84937 were taken from the UVESPOP survey (Bagnulo et al. 2003). The UVES spectrum for G 64-12 was taken from ESO/ST-ECF Science Archive Facility (PID 67.D-0554(A)). With the spectral resolution of λ/Δλ ~40000–60000, it is not possible to distinguish the contributions of Vmac and Vrot to a line profile. Hence, the profiles are convolved with a Gaussian with a full width at half maximum ~2.8–4 km s-1.
The sample includes nine objects from the recent studies of Bergemann & Gehren (2008) and Bergemann et al. (2009), where details about observational material and derivation of stellar parameters can be found. In addition, we include here one thin disk star, HD 123710. Parameters of all these stars are determined by Gehren et al. (2004, 2006) using the same MAFAGS-ODF model atmospheres, as employed in this work. The effective temperatures were obtained from fitting the Balmer line profiles under LTE. The spectroscopic temperatures agree with the Teff’s determined by the method of infrared fluxes (Alonso et al. 1996, 1999; Casagrande et al. 2010). The offset of the Teffs from the last reference is ~20 K with an rms error 23 K. Surface gravities were based on Hipparcos parallaxes.
Metallicities and microturbulence parameters were determined from LTE fitting of Fe ii lines by requiring a zero slope of Fe abundances versus line equivalent widths. The validity of the LTE approach to 1D line formation calculations for Fe ii was demonstrated in very accurate analyses of the statistical equilibrium of Fe in the Sun (Gehren et al. 2001a,b) and metal-poor stars (Mashonkina et al. 2010). These studies employ the same type of atmospheric models, as we use in the current work.
Gehren et al. (2004, 2006) estimate the errors to be 100 K for Teff, 0.05 dex for log g, 0.05 dex for [Fe/H], and 0.2 km s-1 for ξt. For the halo and thick disk stars, the model atmospheres were computed with a total α-element enhancement of 0.4 dex.
5.2. [Cr/Fe] abundance ratios
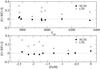 |
Fig. 5 [Cr/Fe] ratios as determined from Cr i and Cr ii lines under NLTE (filled symbols) and LTE (open symbols) as a function of effective temperature (top) and metallicity (bottom) for selected stars. The NLTE abundances are computed with SH = 0. |
The abundances of Cr in metal-poor stars were calculated strictly relative to the Sun.
Any abundance estimate derived from a single line in a spectrum of a metal-poor star was
referred to that from the corresponding solar line, which excludes the use of absolute
oscillator strengths and the average solar abundance. We derived a differential element
abundance for each detected Cr line in a spectrum of a star according to
![Mathematical equation: \begin{equation} \mathrm{[El/H]}= \loggfestar - \loggfesun \nonumber \end{equation}](/articles/aa/full_html/2010/14/aa14250-10/aa14250-10-eq332.png) and then we
averaged over all these lines for a given ionization stage. Most of the Cr lines analyzed
in the solar spectrum become very weak at low metallicities, thus we typically used from 3
to 10 lines for each ionization stage.
and then we
averaged over all these lines for a given ionization stage. Most of the Cr lines analyzed
in the solar spectrum become very weak at low metallicities, thus we typically used from 3
to 10 lines for each ionization stage.
Figure 5 displays the difference between [Cr/Fe] ratios computed from the lines of two ionization stages, [CrII/CrI] = [CrII/Fe] − [CrI/Fe], as a function of stellar effective temperature and metallicity. NLTE and LTE ratios are shown with filled and open symbols, respectively. NLTE abundances are based on SE calculations with the atomic model of Cr with SH = 0. There is an offset of ~0.2–0.3 dex between Cr i and Cr ii lines under LTE, which increases with decreasing [Fe/H] (Fig. 5, bottom). This reflects that the main stellar parameter controlling deviations from LTE in Cr is the metal abundance. Since the NLTE effects of gravity and effective temperature are smaller than that of [Fe/H], we do not see a clear trend with Teff in Fig. 5 (top), where no pre-selection according to log g or [Fe/H] was made. A discrepancy of a similar magnitude and sign was reported by Johnson (2002), Lai et al. (2008), and Bonifacio et al. (2009). All studies agree that for giants with Teff ≤ 5000 the difference between two ionization stages is ~0.4 dex. For hotter and higher-gravity models, characteristic of dwarfs, Lai et al. and Bonifacio et al. derive smaller offsets, [CrII/CrI ] ~0.2 dex, in good agreement with our LTE calculations. These findings are consistent with differential NLTE effects in Cr, which at lower metallicity are larger for low log g and low Teff models corresponding to giants (Sect. 3).
Our main result is that the offset between Cr i and Cr ii for any combination of stellar parameters investigated here disappears when we use atomic level populations computed with the reference atomic model with SH = 0 (Fig. 5). This model allows for extreme NLTE effects on Cr i due to the neglect of thermalizing H i collisions. For SH = 0.05, the abundances based on the Cr i lines decrease by ≤ 0.05 dex. Although these results are close to the abundances computed with SH = 0, the agreement between two ionization stages is not so good, [CrII/CrI ] ~0.04...0.07 dex, and the offset becomes even larger with increasing SH.
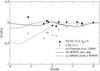 |
Fig. 6 Abundance ratios [Cr/Fe] as a function of metallicity. NLTE and LTE-based Cr abundances in metal-poor stars are marked with filled and open symbols. The evolutionary curves for [Cr/Fe] are computed with the CE model for the solar neighborhood adopting different sets of SN II yields (a)–(c). |
The average Cr abundances and their standard deviations are given for each star in Table 3. [CrI/Fe] and [CrII/Fe] refer to the analysis of Cr i and Cr ii lines, respectively. NCr I and NCr II are the number of Cr i and Cr ii lines used for each star. The NLTE abundances given in this table were computed with SH = 0. In the spectra of BD − 4°3208 and G 64-12, no lines of Cr ii were detected, and the [CrII/Fe] ratio for HD 140283 is based on one Cr ii line. Table 4 with individual abundances for each line of Cr i and Cr ii is available in the electronic edition of this paper.
In Fig. 6, [Cr/Fe] ratios computed under NLTE and LTE are plotted as a function of the stellar iron abundance, with [Fe/H] based on the LTE analysis of Fe ii lines. The mean NLTE [Cr/Fe] ratio in stars with subsolar metallicity is ⟨ [ Cr/Fe ] ⟩ = 0 with the dispersion σ = 0.06 dex. Assuming LTE, we derived ⟨ [Cr/Fe] ⟩ = −0.21 with σ = 0.11 dex. The mean LTE value ⟨ [Cr/Fe] ⟩ and the slope of [Cr/Fe] with [Fe/H] agree with other comparison studies, which involved the LTE analysis of Cr i lines. Cayrel et al. (2004) showed that [Cr/Fe] ratios in giants increase from −0.5 at [Fe/H] ≈ −4 to −0.25 at [Fe/H] ≈ −2, and that the scatter in the abundance ratios is very small, σ = 0.05 dex. This small dispersion contradicts earlier results of McWilliam et al. (1995) and Ryan et al. (1996), who obtained a large spread in [Cr/Fe] abundances at any given metallicity. The reason for this disagreement is that Cayrel et al. (2004) investigated only giant stars, whereas the analyses of McWilliam et al. (1995) and Ryan et al. (1996) were based on a compilation of their own LTE measurements in a mixed sample of stars and other data from the literature.
The mean LTE abundances in metal-poor stars based on the Cr ii lines are identical in our study and in Gratton & Sneden (1991), ⟨ [Cr/Fe] ⟩ = −0.05 ± 0.04 dex and −0.04 ± 0.05 dex, respectively. Both of these values are consistent with the mean NLTE abundance derived from the Cr i lines. This is not surprising, because we found minor NLTE effects in Cr ii for the range of stellar parameters investigated here and excellent agreement was achieved between the Cr i and Cr ii lines under NLTE.
Bonifacio et al. (2009) performed an LTE analysis of Cr abundances in very metal-poor dwarfs and giants, demonstrating the influence of multidimensional RT effects on Cr i line formation in low-metallicity model atmospheres. For giants, they determined a factor of 2 smaller 3D-1D abundance corrections than for dwarfs. Although this result may explain the systematic offset of 0.2 dex, which they find between evolved and turnoff stars, it is not clear how these 3D effects will manifest themselves in full 3D NLTE RT calculations.
6. Chemical evolution model for [Cr/Fe] ratio
6.1. Nucleosynthesis
Calculations of stellar nucleosynthesis and Galactic chemical evolution indicate that the solar abundances of Fe and Cr are produced by a factor of 2/3 by SNe Ia and the remainder by SNe II (Matteucci & Greggio 1986; Samland 1998). In both instances, the formation of these even-Z iron peak elements occurs in explosive burning of silicon (Hix & Thielemann 1999; Thielemann et al. 2007). The isotope 52Cr, which constitutes 83.8% of the solar Cr abundance, is formed as radioactive 52Fe mainly in the incomplete Si-burning region (Umeda & Nomoto 2002, 2005). The dominant isotope of Fe, 56Fe (91.7% of the solar Fe abundance), is produced as radioactive 56Ni at very high temperatures, T > 4 × 10⁹ K (Woosley & Weaver 1995). Since both 52Cr and 56Fe are formed as α-particle nuclei, the total yields of Cr and Fe are almost independent of the neutron excess in the matter undergoing explosive burning and, to first order, of the metallicity of SN progenitors.
Although the nucleosynthesis sites for Cr and Fe have been identified, theoretical stellar yields of these elements are affected by large uncertainties related to the modelling of the SN explosion. The amount of Fe-peak elements ejected in a SN II primarily depends on the explosion energy and the mass cut between the ejected material and the collapsed core (note that these parameters are related, although they are often treated independently, e.g., Umeda & Nomoto 2002). Less Cr is produced relative to Fe for a deeper mass cut (Nakamura et al. 1999; Umeda & Nomoto 2002). Current estimates of the mass cut are based on the mass ejected in the form of 56Ni and the ratio 58Ni/56Ni, which are determined from SN II light curves and spectra. Other parameters affecting the relative production of Fe-group nuclei, include the degree of mixing and fallback to the remnant, and both the energy and geometry of the explosion (Nakamura et al. 1999; Umeda & Nomoto 2002, 2005). Nagataki et al. (1997) demonstrated that an axisymmetric explosion in SN II models enhances the production of 52Cr. All these parameters are interlinked and depend on preceding stages of stellar evolution in turn determined by the initial physical properties of a star.
The yields of Fe-peak elements from SNe Ia are also rather uncertain. It is not clear what type of binary system evolution leads to an explosion, i.e., a double or single degenerate scenario, and whether the explosion proceeds by means of delayed detonation or fast deflagration mechanism (see Iwamoto et al. 1999, and references therein). The production of neutron-rich isotopes in carbon deflagration models depends on the neutron excess η, which in turn depends on the ignition density and flame propagation speed. For exampple, Iwamoto et al. (1999) found that the yield of a neutron-rich 54Cr isotope in the widely-used W7 model is very sensitive to η in the central region of a white dwarf model, where it is determined by electron captures on nuclei. In this SN Ia model, the neutron-rich isotope of iron 58Fe is produced in the outer regions where η stems from CNO-cycle production of 14N, i.e. the abundance of 58Fe is correlated with the initial metallicity of a white dwarf. Thus, depending on SN Ia model parameters, different isotopic abundance ratios for Cr and Fe can be obtained. Some fine-tuning of a SN Ia model may be necessary to reproduce the solar isotopic composition.
6.2. Model of chemical evolution
The results we obtain for the chemical evolution of Cr for the solar neighborhood are based on the model of François et al. (2004), which is a revised version of the two-infall model presented by Chiappini et al. (1997). This model assumes two episodes for the Galaxy formation: the first forms the halo on a short timescale of ~1 Gyr, and the second, much longer episode with a timescale of ~7 Gyr, produces the disc. The initial mass function is adopted from Scalo (1986) and the star formation law is the one proposed originally by Talbot & Arnett (1975). Further details on the model can be found in François et al. (2004).
The following prescriptions for Fe-peak nucleosynthesis are adopted. For SN Ia, we used the metallicity-independent yields of Cr and Fe computed by Iwamoto et al. (1999) with the updated version of Chandrasekhar mass W7 model of Nomoto et al. (1984). This model predicts that ~9% of the total solar Cr is in the form of 54Cr. Hence, we decreased the yield of the neutron-rich isotope 54Cr by a factor of 4 to reproduce the solar abundance ratio of Cr isotopes. The overproduction of 54Cr can be avoided in other SN Ia models with lower central ignition density and neutron excess (Iwamoto et al. 1999). We used three sets of massive star yields. The first set (a) is metallicity-independent yields from Woosley & Weaver (1995, WW95), computed with the SN II models with a solar composition. We increased the Cr yields by a factor of 10 for the 10–20 M ⊙ models following the recommendation of François et al. (2004), who used this trick to avoid strong underproduction of Cr relative to Fe with their CE model, [ Cr/Fe ] ≈ −1at [ Fe/H ] = −4. We suggest, however, that the Cr/Fe deficit obtained by François et al. (2004) is not caused by inadequate yields for low- and intermediate-mass SNe II. Inspecting their Tables 1 and 2, we find very low Cr and high Fe yields (from unknown source) for stars with 20 M ⊙ ≤ M ≤ 100 M ⊙ , which dominate Cr and Fe production at [Fe/H] ≤ −4. WW95 provide yields only for M ≤ 40 M ⊙ models, and their Cr/Fe production ratios for solar-metallicity stars with M > 15 M ⊙ are supersolar. In the second case (b), we adopted the metallicity-dependent WW95 yields for Cr and Fe calculated for Z/Z ⊙ = 0, 10-4, 10-2, 10-1, and 1, and we performed linear interpolation between these values. The third set (c) differs from the case (b) in that for Z = 0 we used the yields of Heger & Woosley (2008), computed for metal-free progenitors.
The [Cr/Fe] versus [Fe/H] relations computed with the chemical evolution models (a) to (c) are compared with NLTE and LTE abundance ratios in Fig. 6. The theoretical [Cr/Fe] ratios are normalized to the solar abundances of Cr and Fe, which are predicted by each of the models. The Cr abundance in the ISM at the solar system formation computed with the model (a) is 5.61 dex, whereas the models (b) and (c) predict log εCr, ⊙ = 5.68 dex. The high abundance of Cr in the models (b) and (c) is compensated by a higher Fe abundance log εFe, ⊙ = 7.53. The [Cr/Fe] trend based on LTE abundances derived from Cr i lines is qualitatively reproduced by the model (a) with adjusted WW95 yields. [Cr/Fe] decreases with metallicity. This result is expected because our LTE abundances generally agree with the spectroscopic abundances in metal-poor stars used by François et al. (2004) to calibrate SN yields in their model. The flat [Cr/Fe] trend based on NLTE abundances of Cr is reproduced well by the model (b). Deviations of [Cr/Fe] from zero are due to the mass and metallicity-dependence of yields in the WW95 models. The Cr/Fe production ratios are supersolar for more massive stars, M ≥ 18 M ⊙ , with Z/Z ⊙ = 0.01,0.1,1. However, the IMF-integrated Cr/Fe production ratios are subsolar for SNe II with Z = 0.01 and Z = 0.1 as reflected by the declining [Cr/Fe] for metallicities −2 < [Fe/H] < −1. At [Fe/H] > −1, [Cr/Fe] rises againbecause of the supersolar Cr/Fe production by exploding massive stars with initial solar metallicity, Z = Z ⊙ . The total solar Cr abundance is attained due to the dominant contribution ( ~60%) of SNe Ia to the production of this element. We obtained similar results using the new nucleosynthesis yields of Heger & Woosley (2008) for metal-free stars, model (c) in Fig. 6. The difference from model (b) can be seen only at very low metallicity, [Fe/H] < −3.
Evolutionary curves for [Cr/Fe], which are similar to the models (b) and (c), were calculated by Timmes et al. (1995), Samland (1998), Argast et al. (2000), Goswami & Prantzos (2000), and Kobayashi et al. (2006). However, close agreement between our NLTE [Cr/Fe] trend and the predictions of different theoretical GCE models does not allow us to constrain the latter. The reason is that different studies adopt different prescriptions for e.g., stellar nucleosynthesis, mixing in the ISM, recipes for inflow and outflow, and the IMF. We are not aware of any complete systematic study in the literature focused on the effect of these and other parameters on the evolution of elemental abundance ratios. Studies analogous to that of Romano et al. (2005), who investigated the effect of initial mass function and stellar lifetimes, are highly desirable.
7. Conclusions
The atomic level populations of Cr in the atmospheres of late-type stars are very sensitive to the non-local UV radiation field, which drives them away from the LTE distribution given by Saha-Boltzmann statistics. Using 1D static model atmospheres, we have found strong NLTE effects for the minority ion Cr i, which are related to overionization from the low-excitation odd Cr i levels with large quantum-mechanical photoionization cross-sections. The NLTE abundance corrections to Cr i lines are positive and increase with decreasing model metallicity and gravity. The number densities of excited states in Cr ii are also modified by non-equilibrium excitation processes, but the effect on abundances is negligible for dwarfs and subgiants analyzed in this work.
Ionization equilibrium of Cr for the Sun and the metal-poor stars is satisfied, if we allow for extreme NLTE effects in Cr i by neglecting inelastic collisions with H i in statistical equilibrium calculations. For the Sun, the NLTE Cr abundance is 5.74 ± 0.04 dex, which is 0.05 dex lower than that computed from Cr ii lines. Both values disagree with the Cr abundance of C i meteorites, 5.63 ± 0.01 dex (the value taken from Lodders et al. 2009; and renormalized to the photospheric Si abundance of Shi et al. 2008). A few Cr i and Cr ii lines infer systematically higher abundances. Since these lines are sensitive to microturbulence parameter, the abundance anomaly most likely reflects the shortcomings of our 1D model atmospheres. Line formation calculations with 3D hydrodynamical models are necessary to confirm this.
The NLTE Cr i-based abundances in metal-poor stars are systematically larger than those computed by the LTE approach. The difference of 0.2–0.4 dex is due to substantial overionization of Cr i at low metallicity. The LTE abundances determined in this work using Cr i lines are consistent with other LTE studies (Johnson 2002; Cayrel et al. 2004; Cohen et al. 2004; Lai et al. 2008; Bonifacio et al. 2009), confirming that declining [Cr/Fe] with metallicity is an artifact of the LTE assumption in line formation calculations. The mean NLTE [Cr/Fe] ratio in stars with subsolar metallicity computed from Cr i lines is ⟨ [Cr/Fe] ⟩ = 0 with the standard deviation σ = 0.06 dex. Using the Cr ii lines, we derive ⟨ [Cr/Fe] ⟩ = −0.05 ± 0.04 dex. The finding that [Cr/Fe] remains constant to the lowest metallicities is consistent with nucleosynthesis theory, which predicts that Cr and Fe are co-produced in explosive Si-burning in supernovae.
The NLTE [Cr/Fe] trend with [Fe/H] is reproduced by most of the Galactic chemical evolution models, without the need to invoke peculiar conditions in the ISM or adjust theoretical stellar yields. Our theoretical evolution of [Cr/Fe] in the solar neighborhood, computed with the two-infall GCE model of Chiappini et al. (1997) with SN Ia yields from Iwamoto et al. (1999) and metallicity-dependent SN II yields from Woosley & Weaver (1995), agrees with the NLTE results. The model predicts that ~60% of the total solar Cr and Fe are produced by SNe Ia and remainder by SNe II, the latter synthesizing both elements in roughly solar proportions. The underproduction of Cr relative to Fe in SNe Ia is compensated for by its overproduction in solar-metallicity SNe II.
Online material
[Cr/Fe] values computed for individual lines of Cr i and Cr ii in spectra of 10 metal-poor stars.
The Cr abundance in CI-chondrites from Lodders et al. (2009) was renormalized to the photospheric Si abundance of Shi et al. (2008), log εSi, ⊙ = 7.52 dex.
The difference in abundances required to fit LTE and NLTE profiles is referred to as the NLTE abundance correction, ΔNLTE = log εNLTE −log εLTE.
Acknowledgments
Based on observations made with the European Southern Observatory telescopes (obtained from the ESO/ST-ECF Science Archive Facility) and the Calar Alto Observatory telescopes. M.B. thanks Dr. Aldo Serenelli for useful comments on nucleosynthesis of Cr and critical revision of the manuscript.
References
- Allen, C. W. 1973, Astrophysical quantities (London: University of London, Athlone Press), 3rd edn. [Google Scholar]
- Alonso, A.,Arribas, S., & Martinez-Roger, C. 1996, A&AS, 117, 227 [NASA ADS] [CrossRef] [EDP Sciences] [Google Scholar]
- Alonso, A.,Arribas, S., & Martínez-Roger, C. 1999, A&AS, 139, 335 [NASA ADS] [CrossRef] [EDP Sciences] [Google Scholar]
- Anstee, S. D., & O’Mara, B. J. 1995, MNRAS, 276, 859 [NASA ADS] [CrossRef] [Google Scholar]
- Argast, D.,Samland, M.,Gerhard, O. E., & Thielemann, F.-K. 2000, A&A, 356, 873 [NASA ADS] [Google Scholar]
- Asplund, M. 2005, ARA&A, 43, 481 [NASA ADS] [CrossRef] [Google Scholar]
- Asplund, M.,Ludwig, H.,Nordlund, A., & Stein, R. F. 2000, A&A, 359, 669 [NASA ADS] [Google Scholar]
- Asplund, M.,Grevesse, N.,Sauval, A. J., & Scott, P. 2009, ARA&A, 47, 481 [NASA ADS] [CrossRef] [Google Scholar]
- Bagnulo, S.,Jehin, E.,Ledoux, C., et al. 2003, The Messenger, 114, 10 [NASA ADS] [Google Scholar]
- Bai, G. S.,Zhao, G.,Chen, Y. Q., et al. 2004, A&A, 425, 671 [NASA ADS] [CrossRef] [EDP Sciences] [Google Scholar]
- Barklem, P. S., Stempels, H. C., Allen de Prieto, C., et al. 2002, A&A, 385, 951 [NASA ADS] [CrossRef] [EDP Sciences] [Google Scholar]
- Baumueller, D., & Gehren, T. 1996, A&A, 307, 961 [NASA ADS] [Google Scholar]
- Baumueller, D.,Butler, K., & Gehren, T. 1998, A&A, 338, 637 [NASA ADS] [Google Scholar]
- Belyaev, A. K., & Barklem, P. S. 2003, Phys. Rev. A, 68 [Google Scholar]
- Belyaev, A. K.,Grosser, J.,Hahne, J., & Menzel, T. 1999, Phys. Rev. A, 60, 2151 [NASA ADS] [CrossRef] [MathSciNet] [Google Scholar]
- Bergemann, M., & Gehren, T. 2008, A&A, 492, 823 [NASA ADS] [CrossRef] [EDP Sciences] [Google Scholar]
- Bergemann, M., Pickering, J. C., & Gehren, T. 2009, MNRAS, 1703 [Google Scholar]
- Blackwell, D. E.,Booth, A. J.,Menon, S. L. R., & Petford, A. D. 1986, MNRAS, 220, 303 [NASA ADS] [CrossRef] [Google Scholar]
- Blackwell, D. E.,Booth, A. J.,Menon, S. L. R., & Petford, A. D. 1987, A&A, 180, 229 [NASA ADS] [Google Scholar]
- Böhm-Vitense, E. 1958, Zeitschrift für Astrophysik, 46, 108 [Google Scholar]
- Bonifacio, P.,Spite, M.,Cayrel, R., et al. 2009, A&A, 501, 519 [NASA ADS] [CrossRef] [EDP Sciences] [Google Scholar]
- Botnen, A., & Carlsson, M. 1999, in Numerical Astrophysics, ed. S. Miyama, K. Tomisaka, & T. Hanawa, Astrophysics and Space Science library [Google Scholar]
- Butler, K., & Giddings, J. 1985, Newsletter on Analysis of Astronomical Spectra, University of London, 9 [Google Scholar]
- Casagrande, L., Ramirez, I., Melendez, J., Bessell, M., & Asplund, M. 2010, ArXiv e-prints [Google Scholar]
- Cayrel, R.,Depagne, E.,Spite, M., et al. 2004, A&A, 416, 1117 [NASA ADS] [CrossRef] [EDP Sciences] [Google Scholar]
- Chiappini, C.,Matteucci, F., & Gratton, R. 1997, ApJ, 477, 765 [NASA ADS] [CrossRef] [Google Scholar]
- Clayton, D. 2003, Handbook of Isotopes in the Cosmos (Cambridge, UK: Cambridge University Press) [Google Scholar]
- Cohen, J. G.,Christlieb, N.,McWilliam, A., et al. 2004, ApJ, 612, 1107 [NASA ADS] [CrossRef] [Google Scholar]
- Drawin, H. W. 1969, Zeitschrift fur Physik, 225, 470 [Google Scholar]
- François, P.,Matteucci, F.,Cayrel, R., et al. 2004, A&A, 421, 613 [NASA ADS] [CrossRef] [EDP Sciences] [Google Scholar]
- Fuhr, J. R., Martin, G. A., & Wiese, W. L. 1988, Atomic transition probabilities. Scandium through Manganese (New York: American Institute of Physics (AIP) and American Chemical Society) [Google Scholar]
- Fuhrmann, K.,Axer, M., & Gehren, T. 1993, A&A, 271, 451 [NASA ADS] [Google Scholar]
- Fuhrmann, K.,Pfeiffer, M.,Frank, C.,Reetz, J., & Gehren, T. 1997, A&A, 323, 909 [NASA ADS] [Google Scholar]
- Gehren, T.,Butler, K.,Mashonkina, L.,Reetz, J., & Shi, J. 2001a, A&A, 366, 981 [NASA ADS] [CrossRef] [EDP Sciences] [Google Scholar]
- Gehren, T.,Korn, A. J., & Shi, J. 2001b, A&A, 380, 645 [NASA ADS] [CrossRef] [EDP Sciences] [Google Scholar]
- Gehren, T.,Liang, Y. C.,Shi, J. R.,Zhang, H. W., & Zhao, G. 2004, A&A, 413, 1045 [NASA ADS] [CrossRef] [EDP Sciences] [Google Scholar]
- Gehren, T.,Shi, J. R.,Zhang, H. W.,Zhao, G., & Korn, A. J. 2006, A&A, 451, 1065 [NASA ADS] [CrossRef] [EDP Sciences] [Google Scholar]
- Goswami, A., & Prantzos, N. 2000, A&A, 359, 191 [NASA ADS] [Google Scholar]
- Gratton, R. G., & Sneden, C. 1991, A&A, 241, 501 [NASA ADS] [Google Scholar]
- Gratton, R. G.,Carretta, E.,Claudi, R.,Lucatello, S., & Barbieri, M. 2003, A&A, 404, 187 [NASA ADS] [CrossRef] [EDP Sciences] [Google Scholar]
- Grupp, F. 2004, A&A, 420, 289 [NASA ADS] [CrossRef] [EDP Sciences] [Google Scholar]
- Heger, A., & Woosley, S. E. 2008, ApJ, submitted, [arXiv:0803.3161] [Google Scholar]
- Henry, R. B. C.,Cowan, J. J., & Sobeck, J. 2010, ApJ, 709, 715 [NASA ADS] [CrossRef] [Google Scholar]
- Hix, W. R., & Thielemann, F. 1999, ApJ, 511, 862 [NASA ADS] [CrossRef] [Google Scholar]
- Holweger, H. 1967, Zeitschrift fur Astrophysik, 65, 365 [Google Scholar]
- Iwamoto, K.,Brachwitz, F.,Nomoto, K., et al. 1999, ApJS, 125, 439 [NASA ADS] [CrossRef] [MathSciNet] [Google Scholar]
- Johnson, J. A. 2002, ApJS, 139, 219 [NASA ADS] [CrossRef] [Google Scholar]
- Kobayashi, C.,Umeda, H.,Nomoto, K.,Tominaga, N., & Ohkubo, T. 2006, ApJ, 653, 1145 [NASA ADS] [CrossRef] [Google Scholar]
- Kostyk, R. I., & Orlova, T. V. 1983, Astrometriia i Astrofizika, 49, 39 [Google Scholar]
- Kurucz, R. L. 1992, Rev. Mex. Astron. Astrofis., 23, 45 [Google Scholar]
- Kurucz, R. L., Furenlid, I., Brault, J., & Testerman, L. 1984, Solar flux atlas from 296 to 1300 nm, National Solar Observatory Atlas, Sunspot (New Mexico: National Solar Observatory) [Google Scholar]
- Lai, D. K.,Bolte, M.,Johnson, J. A., et al. 2008, ApJ, 681, 1524 [NASA ADS] [CrossRef] [Google Scholar]
- Lodders, K., Palme, H., & Gail, H. 2009, [arXiv:0901.1149] [Google Scholar]
- Mashonkina, L., Gehren, T., Shi, J., Korn, A., & Grupp, F. 2010, in IAU Symposium, ed. K. Cunha, M. Spite, & B. Barbuy, IAU Symp., 265, 197 [Google Scholar]
- Mashonkina, L. J. 1996, in MASS, Model Atmospheres and Spectrum Synthesis, ed. S. J. Adelman, F. Kupka, & W. W. Weiss, ASP Conf. Ser., 108, 140 [Google Scholar]
- Matteucci, F., & Greggio, L. 1986, A&A, 154, 279 [NASA ADS] [Google Scholar]
- McWilliam, A.,Preston, G. W.,Sneden, C., & Searle, L. 1995, AJ, 109, 2757 [NASA ADS] [CrossRef] [Google Scholar]
- Menzel, D. H., & Pekeris, C. L. 1935, MNRAS, 96, 77 [NASA ADS] [Google Scholar]
- Nagataki, S.,Hashimoto, M.-A.,Sato, K., & Yamada, S. 1997, ApJ, 486, 1026 [NASA ADS] [CrossRef] [Google Scholar]
- Nahar, S. N. 2009, Journal of Quantitative Spectroscopy and Radiative Transfer, 110, 2148 [NASA ADS] [CrossRef] [Google Scholar]
- Nakamura, T.,Umeda, H.,Nomoto, K.,Thielemann, F.-K., & Burrows, A. 1999, ApJ, 517, 193 [NASA ADS] [CrossRef] [Google Scholar]
- Nilsson, H.,Ljung, G.,Lundberg, H., & Nielsen, K. E. 2006, A&A, 445, 1165 [NASA ADS] [CrossRef] [EDP Sciences] [Google Scholar]
- Nomoto, K.,Thielemann, F., & Yokoi, K. 1984, ApJ, 286, 644 [Google Scholar]
- Prochaska, J. X.,Naumov, S. O.,Carney, B. W.,McWilliam, A., & Wolfe, A. M. 2000, AJ, 120, 2513 [NASA ADS] [CrossRef] [Google Scholar]
- Romano, D.,Chiappini, C.,Matteucci, F., & Tosi, M. 2005, A&A, 430, 491 [NASA ADS] [CrossRef] [EDP Sciences] [Google Scholar]
- Rutten, R. J. 2003, in Stellar Atmosphere Modeling, ed. I. Hubeny, D. Mihalas, & K. Werner, ASP Conf. Ser., 288, 99 [Google Scholar]
- Ryan, S. G.,Norris, J. E., & Beers, T. C. 1996, ApJ, 471, 254 [NASA ADS] [CrossRef] [Google Scholar]
- Samland, M. 1998, ApJ, 496, 155 [NASA ADS] [CrossRef] [Google Scholar]
- Scalo, J. M. 1986, Fund. Cosmic Phys., 11, 1 [NASA ADS] [EDP Sciences] [Google Scholar]
- Shchukina, N., & Trujillo Bueno, J. 2001, ApJ, 550, 970 [NASA ADS] [CrossRef] [Google Scholar]
- Shi, J. R.,Gehren, T.,Zhang, H. W.,Zeng, J. L., & Zhao, G. 2007, A&A, 465, 587 [NASA ADS] [CrossRef] [EDP Sciences] [Google Scholar]
- Shi, J. R.,Gehren, T.,Butler, K.,Mashonkina, L. I., & Zhao, G. 2008, A&A, 486, 303 [NASA ADS] [CrossRef] [EDP Sciences] [Google Scholar]
- Sobeck, J. S.,Lawler, J. E., & Sneden, C. 2007, ApJ, 667, 1267 [NASA ADS] [CrossRef] [Google Scholar]
- Steffen, M., & Holweger, H. 2002, A&A, 387, 258 [NASA ADS] [CrossRef] [EDP Sciences] [Google Scholar]
- Talbot, Jr., R. J., & Arnett, W. D. 1975, ApJ, 197, 551 [NASA ADS] [CrossRef] [Google Scholar]
- Thielemann, F.-K.,Fröhlich, C.,Hirschi, R., et al. 2007, Progress in Particle and Nuclear Physics, 59, 74 [NASA ADS] [CrossRef] [Google Scholar]
- Timmes, F. X.,Woosley, S. E., & Weaver, T. A. 1995, ApJS, 98, 617 [NASA ADS] [CrossRef] [Google Scholar]
- Umeda, H., & Nomoto, K. 2002, ApJ, 565, 385 [NASA ADS] [CrossRef] [Google Scholar]
- Umeda, H., & Nomoto, K. 2005, ApJ, 619, 427 [NASA ADS] [CrossRef] [Google Scholar]
- van Regemorter, H. 1962, ApJ, 136, 906 [NASA ADS] [CrossRef] [Google Scholar]
- Woosley, S. E., & Weaver, T. A. 1995, ApJS, 101, 181 [NASA ADS] [CrossRef] [Google Scholar]
- Wujec, T., & Weniger, S. 1981, J. Quant. Spectr. Rad. Trans., 25, 167 [Google Scholar]
All Tables
[Cr/Fe] values computed for individual lines of Cr i and Cr ii in spectra of 10 metal-poor stars.
All Figures
|
Fig. 1 Grotrian diagram of the Cr i model atom. Lines represent allowed transitions included in the model atom. |
| In the text | |
|
Fig. 2 Photoionization
cross-section for the
|
| In the text | |
|
Fig. 3 Departure coefficients bi of selected Cr i and Cr ii levels as a function of optical depth at 500 nm. Panels a) to d) present results for the solar model atmosphere. a) The reference model atom with a total of 374 levels constructed as described in Sect. 2.1. Hydrogen collision rates are multiplied by SH = 0.05. Photoionization cross-sections for Cr i are taken from Nahar (2009). b) Same as a), but hydrogenic photoionization cross-sections are used for all levels. c) Same as a), but SH = 0. d) The reduced model atom with a total of 108 levels including the Cr ii ground state, SH = 0.05. e) to h) same as a), but the model atmospheres are taken from the grid with stellar parameters specified in each panel. Note that some levels on the plots are in thermal equilibrium with the other levels. |
| In the text | |
|
Fig. 4 NLTE profiles of the Cr i line at 5247 Å. Different combinations of microturbulent velocities ξt and resulting Cr abundances log ε are shown. The line shows a convective asymmetry. |
| In the text | |
|
Fig. 5 [Cr/Fe] ratios as determined from Cr i and Cr ii lines under NLTE (filled symbols) and LTE (open symbols) as a function of effective temperature (top) and metallicity (bottom) for selected stars. The NLTE abundances are computed with SH = 0. |
| In the text | |
|
Fig. 6 Abundance ratios [Cr/Fe] as a function of metallicity. NLTE and LTE-based Cr abundances in metal-poor stars are marked with filled and open symbols. The evolutionary curves for [Cr/Fe] are computed with the CE model for the solar neighborhood adopting different sets of SN II yields (a)–(c). |
| In the text | |
Current usage metrics show cumulative count of Article Views (full-text article views including HTML views, PDF and ePub downloads, according to the available data) and Abstracts Views on Vision4Press platform.
Data correspond to usage on the plateform after 2015. The current usage metrics is available 48-96 hours after online publication and is updated daily on week days.
Initial download of the metrics may take a while.