Fig. 10
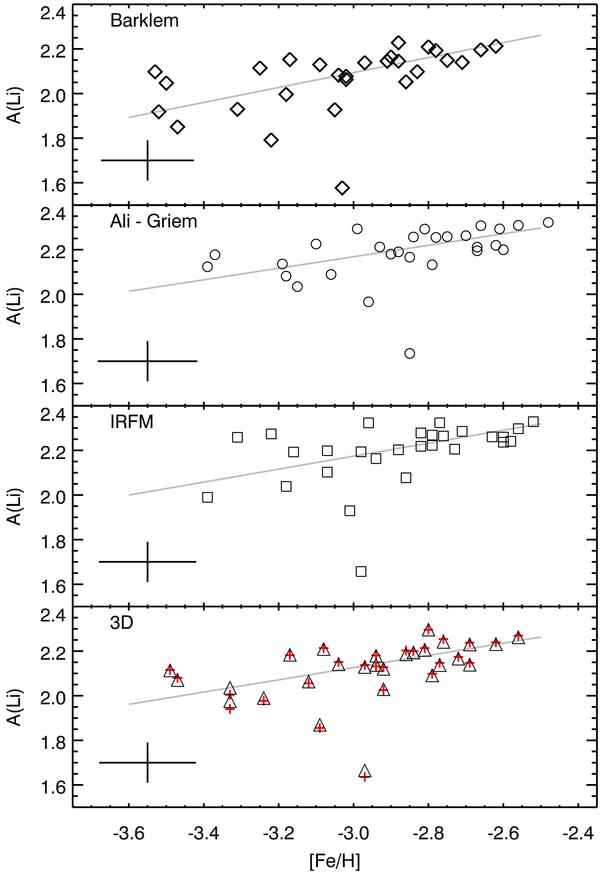
Li abundance versus [Fe/H] for the four temperature estimates. Top to bottom, BA, ALI, IRFM, and 3D temperatures. For the 3D temperature scale, the black triangles represent the 3D NLTE Li abundances, while the red crosses represent 1D LTE Li abundances with the NLTE corrections applied. The best-fit linear relation (as per Table 8) is indicated by a gray line. A typical error bar of ± 0.09 dex in Li abundance and the average [Fe/H] error bar are also displayed.
Current usage metrics show cumulative count of Article Views (full-text article views including HTML views, PDF and ePub downloads, according to the available data) and Abstracts Views on Vision4Press platform.
Data correspond to usage on the plateform after 2015. The current usage metrics is available 48-96 hours after online publication and is updated daily on week days.
Initial download of the metrics may take a while.