| Issue |
A&A
Volume 511, February 2010
|
|
|---|---|---|
| Article Number | A75 | |
| Number of page(s) | 7 | |
| Section | Interstellar and circumstellar matter | |
| DOI | https://doi.org/10.1051/0004-6361/200913590 | |
| Published online | 12 March 2010 | |
The complex structure of the disk around HD 100546![[*]](/icons/foot_motif.png)
The inner few astronomical units
M. Benisty1 - E. Tatulli2 - F. Ménard2 - M. R. Swain3
1 - INAF-Osservatorio Astrofisico di Arcetri, Largo E. Fermi 5, 50125 Firenze, Italy
2 -
Laboratoire d'Astrophysique de Grenoble, CNRS-UJF UMR 5571, 414 rue de la Piscine, 38400 St Martin d'Hères, France
3 -
Jet Propulsion Laboratory, California Institute of Technology, 4800 Oak Grove Drive, Pasadena, CA 91109, USA
Received 3 November 2009 / Accepted 7 January 2010
Abstract
Context. Disclosing the structure of disks surrounding
Herbig AeBe stars is important to expand our understanding of the
formation and early evolution of stars and planets. The first
astronomical units of these disks in particular, because they are hot,
dense, and subject to intense radiation field, hold critical clues to
accretion and ejection processes, as well as planet formation in
environment different than what prevailed around our own early Sun.
Aims. We aim at revealing the sub-AU disk structure around the
10 Myr old Herbig Be star HD 100546 and at investigating
the origin of its near and mid-infrared excess.
Methods. We used new AMBER/VLTI observations to resolve the K-band
emission and to constrain the location and composition of the hot dust
in the innermost circumstellar disk. Combining AMBER observations with
photometric and MIDI/VLTI measurements from the litterature, we revisit
the disk geometry using a passive disk model based on 3D Monte-Carlo
radiative transfer (including full anisotropic scattering).
Results. We propose a model that includes a tenuous inner disk
made of micron-sized dust grains, a gap, and a massive optically thick
outer disk, that successfully reproduces the interferometric data and
the SED. We locate the bulk of the K-band emission at ![]() 0.26 AU.
Assuming that this emission originates from silicate dust grains at
their sublimation temperature of 1500 K, we show that micron-sized
grains are required to enable the dust to survive at such a close
distance from the star. As a consequence, in our best model, more than
40% of the K-band flux is related to scattering, showing that
the direct thermal emission of hot dust is not always sufficient to
explain the near-infrared excess. In the massive outer disk, large
grains in the mid-plane are responsible for the mm emission while a
surface layer of small grains allows the mid and far infrared excesses
to be reproduced. Such vertical structure may be an evidence for
sedimentation. The interferometric observations are consistent with a
disk model that includes a gap until
0.26 AU.
Assuming that this emission originates from silicate dust grains at
their sublimation temperature of 1500 K, we show that micron-sized
grains are required to enable the dust to survive at such a close
distance from the star. As a consequence, in our best model, more than
40% of the K-band flux is related to scattering, showing that
the direct thermal emission of hot dust is not always sufficient to
explain the near-infrared excess. In the massive outer disk, large
grains in the mid-plane are responsible for the mm emission while a
surface layer of small grains allows the mid and far infrared excesses
to be reproduced. Such vertical structure may be an evidence for
sedimentation. The interferometric observations are consistent with a
disk model that includes a gap until ![]() 13 AU from the star and a total dust mass of
13 AU from the star and a total dust mass of ![]() 0.008 lunar mass (
0.008 lunar mass (![]() 6.1023 g) inside it. These values together with the derived scale height (
6.1023 g) inside it. These values together with the derived scale height (![]() 2.5 AU) and temperature (
2.5 AU) and temperature (![]() 220 K) at the inner edge of the outer disk (r=13 AU), are consistent with recent CO observations.
220 K) at the inner edge of the outer disk (r=13 AU), are consistent with recent CO observations.
Key words: accretion, accretion disks - radiative transfer - instrumentation: interferometers
1 Introduction
Extrasolar planets have been discovered at a regular pace since 1995. Late in 2008, five of them were imaged directly, two of them clearly being associated with the disk they formed in (Lagrange et al. 2008; Kalas et al. 2008). Yet, the exact process by which they form, and the timing of their formation within the disks remain unclear. There has been several interesting advances in the last years: direct imaging of debris disks, the discovery of fine structure in young disks likely due to gravitational interactions with bodies within or outside the disk, and finer sampling (spectroscopy) of the mid-infrared spectral energy distribution (SED). It is now clear that several processes are simultaneously acting on the disks at a given time. In the same time interval, it is expected that planets are actively forming.In a series of multi-scale panchromatic studies
(Doucet et al. 2007; Pinte et al. 2008b; Grady et al. 2009), we have initiated the study of
several well documented disks surroundingpre-main-sequence stars. They will provide a
testbed to study the conditions in which planets form.
One of these stars is the late Herbig Be star, HD 100546 (B9.5Ve,
103pc; van den Ancker et al. 1997). Its circumstellar environment was first
resolved in scattered light by Pantin et al. (2000), revealing the
presence of a disk with an inclination of ![]() 50
50![]() .
Coronagraphic imaging showed that the star is surrounded
by a large scale envelope (
.
Coronagraphic imaging showed that the star is surrounded
by a large scale envelope (![]() 1000 AU) and a disk extending up to 515 AU whose
brightness profile is asymmetric (Augereau et al. 2001; Grady et al. 2001). Its
position in the HR diagram gives an estimated age larger than 10 Myr,
supported by the presence of large fractions of crystalline silicates
that suggest an evolved disk (Bouwman et al. 2003).
1000 AU) and a disk extending up to 515 AU whose
brightness profile is asymmetric (Augereau et al. 2001; Grady et al. 2001). Its
position in the HR diagram gives an estimated age larger than 10 Myr,
supported by the presence of large fractions of crystalline silicates
that suggest an evolved disk (Bouwman et al. 2003).
The SED of the system has been intensively studied. Compared to other
HerbigAeBe stars, its specificity is to show a strong mid-infrared
excess, peaking at 40 ![]() m, compared to a rather weak 2-8
m, compared to a rather weak 2-8 ![]() m
emission. To account for the deficit of NIR excess, Bouwman et al. (2003) suggested the presence of an inner cavity (empty region)
within 10 AU, while fitting the SED with three optically thin
concentric shells of different grain populations. Besides, support for
a region of low density in dust grains is provided by the low
circumstellar polarization in comparison with younger Herbig stars
(Clarke et al. 1999). Spectroscopic observations also agree with this
conclusion. STIS observations of H2 emission revealed the
presence of a central cavity extending to 13 AU
(Grady et al. 2005). Similarly, Acke & van den Ancker (2006) concluded to the presence
of a gap distant of 6.5 AU from the star by studying the 6300 Å [OI]
line. The last authors speculated that this gap (or secondary wall) is
induced by a very low-mass stellar or planetary companion
(20
m
emission. To account for the deficit of NIR excess, Bouwman et al. (2003) suggested the presence of an inner cavity (empty region)
within 10 AU, while fitting the SED with three optically thin
concentric shells of different grain populations. Besides, support for
a region of low density in dust grains is provided by the low
circumstellar polarization in comparison with younger Herbig stars
(Clarke et al. 1999). Spectroscopic observations also agree with this
conclusion. STIS observations of H2 emission revealed the
presence of a central cavity extending to 13 AU
(Grady et al. 2005). Similarly, Acke & van den Ancker (2006) concluded to the presence
of a gap distant of 6.5 AU from the star by studying the 6300 Å [OI]
line. The last authors speculated that this gap (or secondary wall) is
induced by a very low-mass stellar or planetary companion
(20
![]() ). This could be the explanation for the pericenter
asymmetry observed in the reflection nebulosity within the cavity by
Grady et al. (2005) that could else not be due to chemistry effects
(asumming that the density distribution is axisymmetric).
The recent CO observations (Brittain et al. 2009; van der Plas et al. 2009) reported an extended emission with a large inner hole inside
). This could be the explanation for the pericenter
asymmetry observed in the reflection nebulosity within the cavity by
Grady et al. (2005) that could else not be due to chemistry effects
(asumming that the density distribution is axisymmetric).
The recent CO observations (Brittain et al. 2009; van der Plas et al. 2009) reported an extended emission with a large inner hole inside
![]() 11-13 AU, confirming the status of transitional disk
given to HD 100546.
11-13 AU, confirming the status of transitional disk
given to HD 100546.
Nevertheless, the measured NIR excess as well as the presence of gas located
from 0.5 to 60 AU (Acke & van den Ancker 2006; Martin-Zaïdi et al. 2008), imply that the inner
AUs are not completely empty. In the mid-infrared wavelength range, the disk is resolved with
mid-infrared spectro-interferometry (Leinert et al. 2004) and nulling
interferometry showed that the radial temperature law in the few inner
AUs (at 10 ![]() m and 20
m and 20 ![]() m) is not compatible with a continuously flared disk (Liu et al. 2003).
Vinkovic et al. (2006) successfully reproduced the NIR SED using an
optically thick disk with an inner radius at 0.45 AU, surrounded by an
optically thin dusty enveloppe. All these results point toward structural
differences between the inner and outer regions of the HD 100546 disk.
m) is not compatible with a continuously flared disk (Liu et al. 2003).
Vinkovic et al. (2006) successfully reproduced the NIR SED using an
optically thick disk with an inner radius at 0.45 AU, surrounded by an
optically thin dusty enveloppe. All these results point toward structural
differences between the inner and outer regions of the HD 100546 disk.
Constraining the spatial structure and physical conditions in the innermost disk is therefore a crucial issue. In particular, the exact position and geometry of the inner rim remain poorly constrained. NIR interferometric observations can achieve the spatial resolution needed to resolve this hot circumstellar material. The combination of angular and spectral resolution provided by AMBER at the ESO/VLTI allow us to directly resolve the circumstellar material located in the first AU of the disk and to address the question of its geometry. In this paper, our goal is to revisit the disk geometry with a special emphasis on its inner AU. The radiative transfer models we have calculated aim at reproducing both the interferometric and photometric observations.
The paper is organized as follow: in Sect. 2, we first describe the observations and the data reduction procedure; in Sects. 3 and 4, we present the interferometric results followed by the description of our disk models. Finally, we discuss our results in Sect. 5.
2 Observations and data processing
Table 1: Log of the observations, obtained on June 24, 2006, with the UT3-UT4 baseline.
Table 2: Stellar and calibrator properties.
HD 100546 was observed at the Very Large Telescope Interferometer
(VLTI; Haguenauer et al. 2008) with the AMBER instrument on 24 April 2006.
AMBER simultaneously combines three beams in the
near infrared H and K bands using spatial filtering and spectral
dispersion (Petrov et al. 2007). It therefore provides spectrally
dispersed visibilities and closure phases. In the
following, we present observations that were obtained with three 8-m
unit telescopes (UT1, UT3, UT4) and AMBER in its low spectral
resolution mode (![]() ). In
addition to HD 100546, a calibrator target of known diameter (HD 101531)
was observed.
Its properties can be found in Table 2. The observations were achieved
under good weather conditions (seeing of
). In
addition to HD 100546, a calibrator target of known diameter (HD 101531)
was observed.
Its properties can be found in Table 2. The observations were achieved
under good weather conditions (seeing of ![]() 0.8'' and coherence
time of
0.8'' and coherence
time of ![]() 5 ms) and without fringe tracker. The data consist of
respectively, 8 and 5 exposures of 1000 frames each, for HD100546
and its calibrator.
5 ms) and without fringe tracker. The data consist of
respectively, 8 and 5 exposures of 1000 frames each, for HD100546
and its calibrator.
The data reduction was performed following standard procedures
described in Tatulli et al. (2007), using the amdlib package,
release 2.99, and the yorick
interface, provided by the Jean-Marie Mariotti Center (JMMC). Raw
spectrally dispersed visibilities and closure phases are extracted for
all the frames of each observing file. A selection process among them
is necessary to avoid the effects of instrumental jitter and
unsatisfactory light injection. Various selection procedures were
applied, including selection based on the fringe signal-to-noise ratio (SNR) and on
the fringe optical path difference (OPD; i.e. piston). Although no
difference in absolute values was found between them, the best
accuracy was obtained with a selection of 20% of the best exposures based on
the fringe SNR. This criteria takes into account both the flux level and
the fringe contrast (or visibility). Among all the measurements
obtained on the three baselines, only the ones corresponding to the shortest
baseline (UT3-UT4) in K-band, led to SNR above 1.5. Consequentely, all
H-band measurements, K-band
data corresponding to UT1-UT3 and UT1-UT4 baselines,
and all the closure phases, were rejected. The
remaining files have SNR ranging from 2.3 to 5.8. The same selection
was applied to both the
scientific star and calibrator measurements in order to guarantee an
uniform data reduction. The attenuation in fringe contrast due to
additional piston with respect to the zero OPD was corrected following
Tatulli et al. (2007). Finally, calibration of the AMBER+VLTI
instrumental transfer function was done using measurements of HD 101531,
after correcting for its diameter. The errors on the calibrated
spectral visibilities include the statistical error obtained when
averaging individual frames, the error on the
diameter of the calibration star, and the dispersion of the transfer
function along the calibrator measurements. The last element is the
one that dominates the error budget. After data processing, the final
data set consists in 2 measurements on UT3-UT4 baseline, that are
spectrally dispersed in 13 K-band spectral channels. Therefore, in total, we obtained 26
visibilities in the [2.06-2.46] ![]() m wavelength range. A summary can
be found in Table 1.
m wavelength range. A summary can
be found in Table 1.
![\begin{figure}
\par\begin{tabular}{cc}
\includegraphics[width=7.5cm]{13590fg1.eps} &
\includegraphics[width=7.5cm]{13590fg2.eps} \end{tabular}
\end{figure}](/articles/aa/full_html/2010/03/aa13590-09/img12.png)
|
Figure 1: Left: measured visibilities plotted against spatial frequency. The two different measurements (#1, #2) are shown with distinct symbols. Right: the visibilities (black crosses) are shown against wavelength and are compared to the predictions of a ring of uniform brightness. The red full and dashed lines give these predictions for the two measurements (i.e. at two distinct projected baselines). |
| Open with DEXTER | |
3 Results
3.1 Visibilities
Figure 1, left, shows the measured visibilities after data
processing. They are plotted against the spatial frequency, ![]() ,
with B the
projected baseline length and
,
with B the
projected baseline length and ![]() ,
the wavelength of the
observations. The spatial frequency is the inverse of the resolution
achieved by the interferometer and takes into account the wavelength,
the projected baseline, and consequentely, the
direction on the sky. It can be expressed in unity [m/
,
the wavelength of the
observations. The spatial frequency is the inverse of the resolution
achieved by the interferometer and takes into account the wavelength,
the projected baseline, and consequentely, the
direction on the sky. It can be expressed in unity [m/![]() m] or in
cycles per milli-arcsecond. It can be immediately seen that
the circumstellar matter around HD 100546 is resolved at the level
of a few milli-arcseconds, because the visibility is well below 1.
m] or in
cycles per milli-arcsecond. It can be immediately seen that
the circumstellar matter around HD 100546 is resolved at the level
of a few milli-arcseconds, because the visibility is well below 1.
To derive basic characteristics of the NIR emission, one can
consider a simple geometrical model of a ring of uniform brightness
that roughly accounts for hot dust located in the inner rim of a
dusty disk. The model visibilities
![]() can be written :
can be written :
with V*=1 (unresolved central star) and
HD 100456 was also observed by Leinert et al. (2004) in the mid-infrared with the MIDI instrument at VLTI. These observations led to a single-dish image at 8.7 ![]() m and to visibility
measurements (at 74 m baseline length). In Sect. 4, we use this image and the corresponding 8.7
m and to visibility
measurements (at 74 m baseline length). In Sect. 4, we use this image and the corresponding 8.7 ![]() m visibility.
m visibility.
3.2 Photometry
We retrieve from the litterature photometric measurements from the UV to the millimetric wavelengths to produce a complete SED (2MASS, IRAS, ISO; Grady et al. 2001; Ardila et al. 2007; Henning et al. 1994). Moreover, because young stars are highly variable in the NIR wavelengths (Sitko et al. 2008), and since modelling of the observations relies on these photometric values, it is useful to provide an estimate of the NIR emission directly from the interferometric measurements. We were able to extract the K band photometry from the three AMBER photometric channels. Following Acke et al. (2008), for each file, we summed the flux in each channel over all frame and calibrated this value with the total flux in the corresponding channel for the calibrator. We applied a photospheric model for the calibrator star in order to convert it in flux units and obtain![\begin{figure}
\par\begin{tabular}{cc}
\includegraphics[width=1.37\columnwidth]{...
...udegraphics[width=0.59\columnwidth]{13590fg4.eps}\end{tabular}
\par\end{figure}](/articles/aa/full_html/2010/03/aa13590-09/img19.png)
|
Figure 2:
Left: K-band model image of HD 100546. The full and dashed lines indicate the position angles of the observations (
|
| Open with DEXTER | |
4 Modelling
Since it has been long established that HD 100546 is surrounded by a disk
(Augereau et al. 2001), in this section, we use disk models to
describe its circumstellar environment. It is not possible to
unambiguously estimate the disk inclination and position angle from
a single-baseline interferometric measurement, therefore, we adopt the
previously published values of 42![]() and 145
and 145![]() ,
respectively
(Ardila et al. 2007). Besides, we consider a total disk mass of
,
respectively
(Ardila et al. 2007). Besides, we consider a total disk mass of
![]() ,
inferred by 1.3 mm imaging (Henning et al. 1994).
,
inferred by 1.3 mm imaging (Henning et al. 1994).
4.1 The radiative transfer code MCFOST
We used the Monte Carlo-based 3-D radiative transfer code, MCFOST, to produce disk images and SED (Pinte et al. 2006). The temperature distribution is calculated using the immediate re-emission concept of Bjorkman & Wood (2001) but with a continuous deposition of energy to estimate the mean intensity (Lucy 1999). In this paper, we used a cylindrical grid, with an adaptive mesh at the inner edge (based on the opacity gradient) so as to properly sample the inner radius of the disk. The radiation field and temperature structure estimated by the Monte Carlo runs are used to produce SEDs by calculating the formal solution of the radiative transfer equation along rays (ray-tracing method), as well as images. Visibilities are computed by taking the Fourier transform of the latter, at the specific spatial frequencies sampled by the observations. The code has been extensively tested and its performances compared to other radiative transfer codes (Pinte et al. 2009).
We assume that the disk is constituted of silicate dust grains
only (Pollack et al. 1994), and is in hydrostatic equilibrium. Its
structure is parametrized by power laws, so that the surface density ![]() ,
and
the scale height H can be expressed as varying with radius, r,
following :
,
and
the scale height H can be expressed as varying with radius, r,
following :
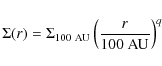
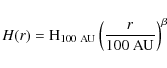
The disk of HD 100546 is well known and its geometry and content have been estimated by several authors (Brittain et al. 2009; Grady et al. 2001; Bouwman et al. 2003). We will therefore not provide a detailed re-analysis of all the disk structural parameters. To the contrary, using in spirit the results of previous studies, we will construct a disk model that also includes a large gap. However, with the help of interferometric measurements, and complete radiative transfer including scattering, we will revisit the morphology and mass content of the inner disk, as well as the position of the gap, in a global picture.
4.2 The disk model
The SED constrains the mass-temperature law for the dust. The near-infrared emission in excess of the photosphere is due to hot material atIn this section, we propose a disk model that
successfully accounts for the emission at all wavelengths, as well as
for the AMBER and MIDI visibilities (see Figs. 2,
4 and 5). However, our model does
not attempt to match mineralogical features. As pointed out by
Bouwman et al. (2003), continuous flared disk models can not reproduced the SED as
they produce either too much
or too little flux in the near and mid-infrared wavelengths,
respectively. The model includes an optically thin
inner disk, a gap and an optically thick outer disk. The model
parameters can be found in Table 3, including for each
zone, the mass (
![]() ), the inner and outer radii
(
), the inner and outer radii
(
![]() ,
,
![]() respectively), the scale height at
100 AU (
respectively), the scale height at
100 AU (
![]() ), the flaring and surface density exponents
(
), the flaring and surface density exponents
(![]() ,
q, respectively) as well as the minimum and maximum grain
sizes (
,
q, respectively) as well as the minimum and maximum grain
sizes (
![]() ,
,
![]() ,
respectively).
,
respectively).
![\begin{figure}
\par\includegraphics[width=17cm]{13590fg5.eps} %
\vspace*{1.5mm}
\end{figure}](/articles/aa/full_html/2010/03/aa13590-09/img33.png)
|
Figure 3: Schematic view of our best disk model, that includes different zones: an inner disk with micron-sized silicate grains, a gap, a massive outer disk with small grains in an upper layer. |
| Open with DEXTER | |
![\begin{figure}
\par\begin{tabular}{cc}
\includegraphics[width=8cm]{13590fg6.eps} &
\includegraphics[width=8cm]{13590fg7.eps}\end{tabular}
\par\end{figure}](/articles/aa/full_html/2010/03/aa13590-09/img34.png)
|
Figure 4: Left: measured SED (circles) for HD 100546, compared to the predictions of our best model (black full line). The individual contributions of each disk zone to the SED are shown (inner disk, red dashed curve; surface layer, blue dotted curve; outer disk, green dash-dotted line). A similar fit to the SED can be obtained with a different disk model (magenta line). Right: zoom in the near and mid-infrared wavelengths. |
| Open with DEXTER | |
The inner disk:
the AMBER/VLTI measurements can locate the bulk of the emission in the
K-band at ![]() 0.25-0.30 AU. This puts a strong constraint on the
location of the disk inner edge and consequentely on
the silicate dust grains sizes. The tenuous inner
disk has a total dust mass of
0.25-0.30 AU. This puts a strong constraint on the
location of the disk inner edge and consequentely on
the silicate dust grains sizes. The tenuous inner
disk has a total dust mass of
![]() and starts at a
radius of
and starts at a
radius of ![]() 0.26 AU, a distance inferred from sublimation of
micron-sized silicate grains (specifically, with sizes ranging from 0.1 to 5
0.26 AU, a distance inferred from sublimation of
micron-sized silicate grains (specifically, with sizes ranging from 0.1 to 5 ![]() m) at
m) at
![]() 1500 K. Its outer radius is not well constrained by the AMBER
observations because it is fully resolved, and we fix it at
1500 K. Its outer radius is not well constrained by the AMBER
observations because it is fully resolved, and we fix it at
![]() 4 AU. Here, all the model calculations are done assuming that the dust
grains are at the same equilibrium temperature with the stellar
radiation field which may not be exactly the case in the tenuous
optically thin inner regions. Although a more detailed calculation,
that requires determination of the dust-to-gas ratio is
beyond the goal of this paper, we stress that there may not be a
specific inner radius but a range of inner radii, depending on the grain sizes.
4 AU. Here, all the model calculations are done assuming that the dust
grains are at the same equilibrium temperature with the stellar
radiation field which may not be exactly the case in the tenuous
optically thin inner regions. Although a more detailed calculation,
that requires determination of the dust-to-gas ratio is
beyond the goal of this paper, we stress that there may not be a
specific inner radius but a range of inner radii, depending on the grain sizes.
The gap: after computing numbers of models, we confirm the
need for a very low density region (e.g. a gap) to reproduce
the lack of emission in the 3-10 ![]() m wavelength range. The
MIDI/VLTI measurements provide a complementary information on the spatial
distribution of the dust in the disk. At the achieved angular
resolution at
m wavelength range. The
MIDI/VLTI measurements provide a complementary information on the spatial
distribution of the dust in the disk. At the achieved angular
resolution at ![]() 8.7
8.7 ![]() m (24 mas i.e. 2.4 AU), the
innermost disk is not resolved but the outer disk is fully resolved.
The 8.7
m (24 mas i.e. 2.4 AU), the
innermost disk is not resolved but the outer disk is fully resolved.
The 8.7 ![]() m observations therefore bring a strong constraint on the
flux ratio, between these two elements of the disk.
In the model, the gap starts at 4 AU until 13 AU, a radius consistent
with spectroscopic results (Brittain et al. 2009; Grady et al. 2005).
m observations therefore bring a strong constraint on the
flux ratio, between these two elements of the disk.
In the model, the gap starts at 4 AU until 13 AU, a radius consistent
with spectroscopic results (Brittain et al. 2009; Grady et al. 2005).
The outer disk and its surface layers: the model massive outer disk forms at 13 AU and extends up to 350 AU. It contains most of the
disk mass and holds large dust grains (from 1 ![]() m to 10 mm). To
account for the mid and far-infrared excesses, we include a population of small grains
(i.e. 0.05 to 1
m to 10 mm). To
account for the mid and far-infrared excesses, we include a population of small grains
(i.e. 0.05 to 1 ![]() m) at the surface of the outer disk,
at distances of a few tens of AUs (here, from 13 to 50 AU; see
Table 3). The
latter are not precisely constrained by the
observations, as the only requirement is to have a specific amount
of small grains emitting at a few tens of AUs.
m) at the surface of the outer disk,
at distances of a few tens of AUs (here, from 13 to 50 AU; see
Table 3). The
latter are not precisely constrained by the
observations, as the only requirement is to have a specific amount
of small grains emitting at a few tens of AUs.
The entire set of parameters used in this model is given in Table 3, and a schematic view of the disk model is provided in Fig. 3. In Fig. 4, we report the contributions from each part of the disk to the total flux. The inner disk (red dashed line) produces enough emission to fit the NIR excess while the small grains in the surface layers (blue dotted line) produce the major contribution to the large mid and far infrared excess. Finally, the large grains in the outer disk are responsible for the flux at long wavelength (green dash-dotted line). The predictions of the entire model are in good agreement with the observations (full black line).
For this model, images and visibilities were computed at the AMBER
wavelengths. Figure 2 (middle) shows the visibility profile as
function of the projected baseline length. This model succesfully
reproduces the interferometric observations in addition to the SED:
the spatial extent of its K-band emission and its inner structure are
in good agreement with the data. The chromaticity in the K-band is
also well reproduced with the radial temperature profile of the disk model (Fig. 2, right).
In the mid-infrared, we focus our modelling on the continuum emission
at 8.7 ![]() m and do not attempt to reproduce any spectral feature.
Figure 5 (left) gives the model image at
m and do not attempt to reproduce any spectral feature.
Figure 5 (left) gives the model image at
![]() m that clearly shows an elongated disk structure, in agreement
with the one obtained by Leinert et al. (2004)
(Fig. 5, middle). From a simple 2D fit, we
obtain
m that clearly shows an elongated disk structure, in agreement
with the one obtained by Leinert et al. (2004)
(Fig. 5, middle). From a simple 2D fit, we
obtain ![]() 21 AU and
21 AU and ![]() 14 AU as the disk major and minor axis,
respectively, in good agreement with the values derived by
Leinert et al. (2004) (
14 AU as the disk major and minor axis,
respectively, in good agreement with the values derived by
Leinert et al. (2004) (![]() AU and
AU and ![]() AU
respectively) and compatible with the results from nulling
interferometry (24 AU; Liu et al. 2003). Figure 5, right, shows the model visibilities at 8.7
AU
respectively) and compatible with the results from nulling
interferometry (24 AU; Liu et al. 2003). Figure 5, right, shows the model visibilities at 8.7 ![]() m,
compared to the MIDI measurement. At long baselines,
the outer disk is entirely resolved and one has access to the
unresolved flux contribution of the inner disk to the total 8.7
m,
compared to the MIDI measurement. At long baselines,
the outer disk is entirely resolved and one has access to the
unresolved flux contribution of the inner disk to the total 8.7 ![]() m-flux. At a 74 m-baseline, our model
can well account for this flux ratio. Our model predicts
that, at short baselines (
m-flux. At a 74 m-baseline, our model
can well account for this flux ratio. Our model predicts
that, at short baselines (![]() 10 m), the outer disk is resolved as
the steep decrease of visibility attests, while for intermediate
baselines, the sharp edge of the gap produces a clear signature.
Mid-infrared interferometry therefore appears well suited to probe the
presence of a gap, as the strong gap signature can easily be detected
using moderate VLTI baselines.
10 m), the outer disk is resolved as
the steep decrease of visibility attests, while for intermediate
baselines, the sharp edge of the gap produces a clear signature.
Mid-infrared interferometry therefore appears well suited to probe the
presence of a gap, as the strong gap signature can easily be detected
using moderate VLTI baselines.
![\begin{figure}
\par\includegraphics[width=18cm]{13590fg8.eps}
\end{figure}](/articles/aa/full_html/2010/03/aa13590-09/img40.png)
|
Figure 5:
Left: 8.7 |
| Open with DEXTER | |
Table 3: Parameters of our best model.
Table 4: Contributions from the different types of emission to the total flux.
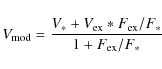
5 Discussion
In this paper, we propose a model of the disk surrounding HD 100546 that successfully reproduces the SED, AMBER and MIDI interferometric observations. We note that equally good fits to the SED can be obtained with other models, similar in spirit to the one we propose (i.e. with three distinct disk regions) but with different spatial distribution. In particular, Bouwman et al. (2003) suggested a solution to reproduce the SED, that includes a population of small grains distributed from 0.3 to 9.8 AU, a more massive part with small grains from 9.8 to 43 AU, and a population of large dust grains from 28 to 380 AU, with a grain size distributionThe importance of scattering: an interesting side effect is the amount of scattered light
induced in different models. At each wavelength, the total emission
(
![]() )
is constituted of 4 distinct contributions: the
stellar light that directly reaches the observer (
)
is constituted of 4 distinct contributions: the
stellar light that directly reaches the observer (
![]() );
the stellar light that is scattered by the disk (
);
the stellar light that is scattered by the disk (
![]() );
the direct thermal emission from dust grains (
);
the direct thermal emission from dust grains (
![]() ;
i.e. absorbed and then re-emitted photons) and finally, the
scattered thermal light (
;
i.e. absorbed and then re-emitted photons) and finally, the
scattered thermal light (
![]() ;
i.e. absorbed,
re-emitted and then scattered photons). Micron-sized silicate grains
located at 0.26 AU are good scatterers, since their sizes are
of the order of the AMBER wavelengths. In our model, the scattered thermal light contributes to
;
i.e. absorbed,
re-emitted and then scattered photons). Micron-sized silicate grains
located at 0.26 AU are good scatterers, since their sizes are
of the order of the AMBER wavelengths. In our model, the scattered thermal light contributes to
![]() 38% of the total K-band emission, about as much as the direct
thermal flux. On the contrary, the model with small grains in the
inner disk and an inner radius at 0.4 AU, predicts a dominant contribution from direct
thermal light (
38% of the total K-band emission, about as much as the direct
thermal flux. On the contrary, the model with small grains in the
inner disk and an inner radius at 0.4 AU, predicts a dominant contribution from direct
thermal light (![]() 64%). Table 4 reports the individual
flux contributions to the total K-band emission (
64%). Table 4 reports the individual
flux contributions to the total K-band emission (
![]() ). The
index ``dir'' or ``sc'' indicates whether it is direct or scattered light,
while the index ``st'' or ``th'' designate stellar and thermal light,
respectively. Assuming that the disk is made of silicate grains only, the fit to the AMBER data
constrains the grain size and consequently the amount of scattered
light. This rules out solutions where only direct thermal emission
from the dust is assumed. This means that scattered light can have
a major effect in the overall energy budget in the NIR, and a strong
impact on the inner disk parameters inferred from modelling. This was
already showed and taken into account in modelling observations of
solar-mass young stars, as previously shown by Pinte et al. (2008a), but
this is the first time that such case is made for a Herbig Be star.
This conclusion in fact contrasts with the usual assumption made to interpret
NIR interferometric results in Herbig AeBe stars, i.e. that the NIR excess emission is due only to direct thermal
emission from hot dust located at the inner edge of a disk
(Dullemond et al. 2001). In fact, scattering or additional emitting components (such as gas Isella et al. 2008; or refractory dust grains; Benisty et al. 2009) seem to
be needed to reproduce recent spectro-interferometric observations of
Herbig AeBe stars. Whether this is relevant for all the objects of
this class should be validated on simpler cases.
). The
index ``dir'' or ``sc'' indicates whether it is direct or scattered light,
while the index ``st'' or ``th'' designate stellar and thermal light,
respectively. Assuming that the disk is made of silicate grains only, the fit to the AMBER data
constrains the grain size and consequently the amount of scattered
light. This rules out solutions where only direct thermal emission
from the dust is assumed. This means that scattered light can have
a major effect in the overall energy budget in the NIR, and a strong
impact on the inner disk parameters inferred from modelling. This was
already showed and taken into account in modelling observations of
solar-mass young stars, as previously shown by Pinte et al. (2008a), but
this is the first time that such case is made for a Herbig Be star.
This conclusion in fact contrasts with the usual assumption made to interpret
NIR interferometric results in Herbig AeBe stars, i.e. that the NIR excess emission is due only to direct thermal
emission from hot dust located at the inner edge of a disk
(Dullemond et al. 2001). In fact, scattering or additional emitting components (such as gas Isella et al. 2008; or refractory dust grains; Benisty et al. 2009) seem to
be needed to reproduce recent spectro-interferometric observations of
Herbig AeBe stars. Whether this is relevant for all the objects of
this class should be validated on simpler cases.
Evidence for sedimentation? The need for small grains at the
surface layers and for large grains in the bulk of the disk
can be interpreted as resulting from grain growth and dust settling. A
toy model was computed with dust grain sizes
ranging from 0.05 to 3000 ![]() m, a standard flaring
(
m, a standard flaring
(
![]() ), but considering a larger scale height (36 AU at
100 AU) and a strong dust settling. The predicted emission similarly
fits the SED. Considering the age of the system, the disk is very likely
evolved and vertical stratification could well be happening.
), but considering a larger scale height (36 AU at
100 AU) and a strong dust settling. The predicted emission similarly
fits the SED. Considering the age of the system, the disk is very likely
evolved and vertical stratification could well be happening.
A gap and a tenuous inner disk:
modelling of the SED requires the presence of a gap. In fact,
a continuous disk model can fit the AMBER data and the flux at
2.2 ![]() m, but it produces too much flux at 8.7
m, but it produces too much flux at 8.7 ![]() m. Similarly,
a continuous disk model that would fit the MIDI data and the
8.7
m. Similarly,
a continuous disk model that would fit the MIDI data and the
8.7 ![]() m flux, would in turn predict too little flux in
the NIR. This confirms the need for a gap, or at least, for a strong
discontinuity in the radial density profile that would produce the
needed amounts of flux at specific locations.
m flux, would in turn predict too little flux in
the NIR. This confirms the need for a gap, or at least, for a strong
discontinuity in the radial density profile that would produce the
needed amounts of flux at specific locations.
If the need for this density discontinuity is clear,
its size is nevertheless very model-dependent. In fact, we
can not determine the position of the outer radius of the inner disk
with precision, because it is fully resolved by AMBER. The MIDI
observations constrain the flux ratio between the inner and outer
disks: when our inner disk extends up to ![]() 4 AU, the outer disk starts at
4 AU, the outer disk starts at
![]() 13 AU. A change in the inner disk geometry would affect this
estimate. In our model, it is constrained by the temperature, hence
position, of the emitting particles. Considering the typical grain
size distributions given in Table 3, our estimate
is in good agreement with the values inferred from previous studies
(Brittain et al. 2009; Grady et al. 2005).
13 AU. A change in the inner disk geometry would affect this
estimate. In our model, it is constrained by the temperature, hence
position, of the emitting particles. Considering the typical grain
size distributions given in Table 3, our estimate
is in good agreement with the values inferred from previous studies
(Brittain et al. 2009; Grady et al. 2005).
Bouwman et al. (2003) required the disk to be more puffed up at
10 AU than prediced by a standard flared disk at the same radius to
capture and re-emit enough light. They use 3.5 AU as scale height for dust at ![]() 200 K which is much more than expected for gas at the same temperature (i.e.
1 AU). Brittain et al. (2009) found that the CO disk extends from
200 K which is much more than expected for gas at the same temperature (i.e.
1 AU). Brittain et al. (2009) found that the CO disk extends from
![]() AU and that at the inner edge of the disk, the gas is much
hotter (
AU and that at the inner edge of the disk, the gas is much
hotter (![]() 1400 K) than the dust at the same radius. As the authors
suggest, this can be explained if there is a low density region in the
upper disk atmosphere, that results in a scale height of
1400 K) than the dust at the same radius. As the authors
suggest, this can be explained if there is a low density region in the
upper disk atmosphere, that results in a scale height of ![]() 3 AU. In
our model, the scale height of the outer disk at its inner edge is
3 AU. In
our model, the scale height of the outer disk at its inner edge is
![]() 2.5 AU, due to the small grains in the surface layers, a value
in agreement with the predictions of Brittain et al. (2009).
2.5 AU, due to the small grains in the surface layers, a value
in agreement with the predictions of Brittain et al. (2009).
Moreover, Bouwman et al. (2003) predicted a total dust mass of 1025 g inside the gap. This led Brittain et al. (2009) to deduce from their estimate of the mass of gas in the inner disk (![]()
![]() g) that the gas-to-dust ratio is
g) that the gas-to-dust ratio is ![]() 3. Our model requires a
total dust mass of
3. Our model requires a
total dust mass of
![]() (
(
![]() g) i.e. a gas-to-dust ratio of
g) i.e. a gas-to-dust ratio of ![]() 50.
We therefore conclude that these estimates are highly model-dependent
and should be considered with care, pending a direct measurement of the
dust content of the inner disk. The small accretion rate, inferred from
UV spectroscopy (Deleuil et al. 2004; Grady et al. 2005) - a few times 10
50.
We therefore conclude that these estimates are highly model-dependent
and should be considered with care, pending a direct measurement of the
dust content of the inner disk. The small accretion rate, inferred from
UV spectroscopy (Deleuil et al. 2004; Grady et al. 2005) - a few times 10
![]() .yr-1- is enough to empty the cavity in a few decades,yet we are observing
dust in the inner disk at an age
.yr-1- is enough to empty the cavity in a few decades,yet we are observing
dust in the inner disk at an age ![]() 10 Myr. Either we are observing
HD 100546 at a very special moment in its evolution or the inner disk
is being replenished. We note that a putative large orbiting body, a
Jupiter-like planet located at about 10 AU, has the capacity to carve
the disk and lead to such a surface density discontinuity at
10 Myr. Either we are observing
HD 100546 at a very special moment in its evolution or the inner disk
is being replenished. We note that a putative large orbiting body, a
Jupiter-like planet located at about 10 AU, has the capacity to carve
the disk and lead to such a surface density discontinuity at ![]() 13 AU,
while allowing some material to flow in continuously across the gap
all the way to the star (Varnière et al. 2006).
13 AU,
while allowing some material to flow in continuously across the gap
all the way to the star (Varnière et al. 2006).
This transitional disk will be a primary target for ALMA that will enable direct determination of the gap extent, by accurately probing the gas surface density profile. Before then, additional VLTI data with three telescopes, allowing phase closure detections, will add new constraints such as the asymmetry of the inner disk rim, the co-planarity of the inner and outer disks (Grady et al. 2009), and whether the star is off-center with respect to the gap (Grady et al. 2005).
We wish to thank ANR through contract ANR-07-BLAN-0221, the PNPS program of CNRS/INSU (France), and INAF (grant ASI-INAF I/016/07/0). We acknowledge the anonymous referee for his suggestions that improved the quality of the manuscript.
References
- Acke, B., & van den Ancker, M. E. 2006, A&A, 449, 267 [NASA ADS] [CrossRef] [EDP Sciences] [Google Scholar]
- Acke, B., Verhoelst, T., van den Ancker, M. E., et al. 2008, A&A, 485, 209 [NASA ADS] [CrossRef] [EDP Sciences] [Google Scholar]
- Ardila, D. R., Golimowski, D. A., Krist, J. E., et al. 2007, ApJ, 665, 512 [NASA ADS] [CrossRef] [Google Scholar]
- Augereau, J. C., Lagrange, A., Mouillet, D., & Ménard, F. 2001, A&A, 365, 78 [NASA ADS] [CrossRef] [EDP Sciences] [Google Scholar]
- Benisty, M., Natta, A., Isella, A., et al. 2010, A&A, 511, A74 [NASA ADS] [CrossRef] [EDP Sciences] [Google Scholar]
- Bjorkman, J. E., & Wood, K. 2001, ApJ, 554, 615 [NASA ADS] [CrossRef] [Google Scholar]
- Bouwman, J., de Koter, A., Dominik, C., & Waters, L. 2003, A&A, 401, 577 [NASA ADS] [CrossRef] [EDP Sciences] [Google Scholar]
- Brittain, S. D., Najita, J. R., & Carr, J. S. 2009, ApJ, 702, 85 [NASA ADS] [CrossRef] [Google Scholar]
- Clarke, D., Smith, R. A., & Yudin, R. V. 1999, A&A, 347, 590 [NASA ADS] [Google Scholar]
- Deleuil, M., Lecavelier des Etangs, A., Bouret, J., et al. 2004, A&A, 418, 577 [NASA ADS] [CrossRef] [EDP Sciences] [Google Scholar]
- Doucet, C., Habart, E., Pantin, E., et al. 2007, A&A, 470, 625 [CrossRef] [EDP Sciences] [Google Scholar]
- Dullemond, C. P., Dominik, C., & Natta, A. 2001, ApJ, 560, 957 [NASA ADS] [CrossRef] [Google Scholar]
- Grady, C. A., Polomski, E. F., Henning, T., et al. 2001, AJ, 122, 3396 [NASA ADS] [CrossRef] [Google Scholar]
- Grady, C. A., Woodgate, B., Heap, S. R., et al. 2005, ApJ, 620, 470 [Google Scholar]
- Grady, C. A., Schneider, G., Sitko, M. L., et al. 2009, ApJ, 699, 1822 [NASA ADS] [CrossRef] [Google Scholar]
- Haguenauer, P., Abuter, R., Alonso, J., et al. 2008, in SPIE Conf. Ser., 7013 [Google Scholar]
- Henning, T., Launhardt, R., Steinacker, J., & Thamm, E. 1994, A&A, 291, 546 [NASA ADS] [Google Scholar]
- Isella, A., Tatulli, E., Natta, A., & Testi, L. 2008, A&A, 483, L13 [NASA ADS] [CrossRef] [EDP Sciences] [Google Scholar]
- Kalas, P., Graham, J. R., Chiang, E., et al. 2008, Science, 322, 1345 [NASA ADS] [CrossRef] [PubMed] [Google Scholar]
- Lagrange, A., Gratadour, D., Chauvin, G., et al. 2009, A&A, 493, 121 [Google Scholar]
- Leinert, C., van Boekel, R., Waters, L. B. F. M., et al. 2004, A&A, 423, 537 [NASA ADS] [CrossRef] [EDP Sciences] [Google Scholar]
- Liu, W. M., Hinz, P. M., Meyer, M. R., et al. 2003, ApJ, 598, L111 [NASA ADS] [CrossRef] [Google Scholar]
- Lucy, L. B. 1999, A&A, 345, 211 [NASA ADS] [Google Scholar]
- Martin-Zaïdi, C., Deleuil, M., Le Bourlot, J., et al. 2008, A&A, 484, 225 [NASA ADS] [CrossRef] [EDP Sciences] [Google Scholar]
- Pantin, E., Waelkens, C., & Lagage, P. O. 2000, A&A, 361, L9 [NASA ADS] [Google Scholar]
- Petrov, R. G., Malbet, F., Weigelt, G., et al. 2007, A&A, 464, 1 [NASA ADS] [CrossRef] [EDP Sciences] [Google Scholar]
- Pinte, C., Ménard, F., Duchêne, G., & Bastien, P. 2006, A&A, 459, 797 [NASA ADS] [CrossRef] [EDP Sciences] [Google Scholar]
- Pinte, C., Ménard, F., Berger, J., Benisty, M., & Malbet, F. 2008a, ApJ, 673, L63 [NASA ADS] [CrossRef] [Google Scholar]
- Pinte, C., Padgett, D. L., Ménard, F., et al. 2008b, A&A, 489, 633 [NASA ADS] [CrossRef] [EDP Sciences] [Google Scholar]
- Pinte, C., Harries, T. J., Min, M., et al. 2009, A&A, 498, 967 [NASA ADS] [CrossRef] [EDP Sciences] [Google Scholar]
- Pollack, J. B., Hollenbach, D., Beckwith, S., et al. 1994, ApJ, 421, 615 [NASA ADS] [CrossRef] [Google Scholar]
- Sitko, M. L., Carpenter, W. J., Kimes, R. L., et al. 2008, ApJ, 678, 1070 [NASA ADS] [CrossRef] [Google Scholar]
- Tatulli, E., Millour, F., Chelli, A., et al. 2007, A&A, 464, 29 [NASA ADS] [CrossRef] [EDP Sciences] [Google Scholar]
- van den Ancker, M., The, P., Tjin A Djie, H., et al. 1997, A&A, 324, L33 [NASA ADS] [Google Scholar]
- van der Plas, G., van den Ancker, M. E., Acke, B., et al. 2009, A&A, 500, 1137 [NASA ADS] [CrossRef] [EDP Sciences] [Google Scholar]
- Varnière, P., Blackman, E. G., Frank, A., & Quillen, A. C. 2006, ApJ, 640, 1110 [NASA ADS] [CrossRef] [Google Scholar]
- Vinkovic, D., Ivezic, Z., Jurkic, T., & Elitzur, M. 2006, ApJ, 636, 348 [NASA ADS] [CrossRef] [Google Scholar]
Footnotes
- ... HD 100546
- Based on observations collected at the VLTI (ESO Paranal, Chile) with program 076.C-0851(B).
All Tables
Table 1: Log of the observations, obtained on June 24, 2006, with the UT3-UT4 baseline.
Table 2: Stellar and calibrator properties.
Table 3: Parameters of our best model.
Table 4: Contributions from the different types of emission to the total flux.
All Figures
|
|
Figure 1: Left: measured visibilities plotted against spatial frequency. The two different measurements (#1, #2) are shown with distinct symbols. Right: the visibilities (black crosses) are shown against wavelength and are compared to the predictions of a ring of uniform brightness. The red full and dashed lines give these predictions for the two measurements (i.e. at two distinct projected baselines). |
| Open with DEXTER | |
| In the text | |
|
|
Figure 2:
Left: K-band model image of HD 100546. The full and dashed lines indicate the position angles of the observations (
|
| Open with DEXTER | |
| In the text | |
|
|
Figure 3: Schematic view of our best disk model, that includes different zones: an inner disk with micron-sized silicate grains, a gap, a massive outer disk with small grains in an upper layer. |
| Open with DEXTER | |
| In the text | |
|
|
Figure 4: Left: measured SED (circles) for HD 100546, compared to the predictions of our best model (black full line). The individual contributions of each disk zone to the SED are shown (inner disk, red dashed curve; surface layer, blue dotted curve; outer disk, green dash-dotted line). A similar fit to the SED can be obtained with a different disk model (magenta line). Right: zoom in the near and mid-infrared wavelengths. |
| Open with DEXTER | |
| In the text | |
|
|
Figure 5:
Left: 8.7 |
| Open with DEXTER | |
| In the text | |
Copyright ESO 2010
Current usage metrics show cumulative count of Article Views (full-text article views including HTML views, PDF and ePub downloads, according to the available data) and Abstracts Views on Vision4Press platform.
Data correspond to usage on the plateform after 2015. The current usage metrics is available 48-96 hours after online publication and is updated daily on week days.
Initial download of the metrics may take a while.