| Issue |
A&A
Volume 511, February 2010
|
|
|---|---|---|
| Article Number | A58 | |
| Number of page(s) | 15 | |
| Section | Interstellar and circumstellar matter | |
| DOI | https://doi.org/10.1051/0004-6361/200913505 | |
| Published online | 10 March 2010 | |
Radio emission from the massive stars in the galactic super star cluster Westerlund 1
S. M. Dougherty1,2 - J. S. Clark3 - I. Negueruela4 - T. Johnson1,5 - J. M. Chapman6
1 - National Research Council of Canada, Herzberg Institute for
Astrophysics, Dominion Radio Astrophysical Observatory, PO Box 248,
Penticton, British Columbia V2A 6J9, Canada
2 -
Institute for Space Imaging Science, University of Calgary, 2500
University Dr. NW., Calgary, Alberta, T2N 1N4, Canada
3 -
Department of Physics and Astronomy, The Open
University, Walton Hall, Milton Keynes, MK7 6AA, UK
4 -
Dpto. de Física, Ingeniería de Sistemas y Teoría de la
Señal, Universidad de Alicante, Apdo. 99, E03080 Alicante, Spain
5 -
Department of Physics and Astronomy, University of Victoria,
3800 Finnerty Rd, Victoria, B.C., V8P 5C2, Canada
6 -
Australia National Telescope Facility, PO Box 76, Epping, NSW 2121,
Australia
Received 20 October 2009 / Accepted 16 November 2009
Abstract
Aims. Current mass-loss rate estimates imply that main
sequence line-driven winds are not sufficient to strip away the H-rich
envelope to yield Wolf-Rayet (WR) stars. The rich transitional
population of the young massive cluster Westerlund 1 (Wd 1)
provides an ideal laboratory to observe and constrain mass-loss
processes throughout the transitional phase of stellar evolution.
Methods. We present an analysis of deep radio continuum
observations of Wd 1 obtained with the Australia Telescope Compact
Array at four frequency bands that permit investigation of the
intrinsic characteristics of the radio emission.
Results. We detect 18 cluster members, a sample dominated by the
cool hypergiants, with additional detections amongst the hotter
OB supergiants and WR stars. The radio properties of the
sample are diverse, with thermal, non-thermal and composite
thermal/non-thermal sources present. Mass-loss rates determined for
stars with partially optically thick stellar winds are ![]() 10-5
10-5 ![]() yr-1
across all spectral types, insufficient to enable the formation of WRs
during a massive star lifetime, and the stars must undergo a period of
greatly enhanced mass loss. The sgB[e] star W9, the brightest
radio source in Wd 1, may provide an example, with a current
mass-loss rate an order of magnitude higher than the other cluster
members, and an extended nebula interpreted as a wind from an earlier
epoch with a density
yr-1
across all spectral types, insufficient to enable the formation of WRs
during a massive star lifetime, and the stars must undergo a period of
greatly enhanced mass loss. The sgB[e] star W9, the brightest
radio source in Wd 1, may provide an example, with a current
mass-loss rate an order of magnitude higher than the other cluster
members, and an extended nebula interpreted as a wind from an earlier
epoch with a density ![]()
![]() the current wind. Such an envelope structure in W9 is reminiscent
of luminous blue variables, and one that shows evidence of two eras of
high, possibly eruptive mass loss. Surprisingly, three of the OB
supergiants are detected, implying unusually dense winds, though they
are embedded in more extended emission regions that may influence the
derived parameters. They also may have composite spectra, suggesting
binarity, which can lead to a higher flux than expected from a stellar
wind. Spatially resolved nebulae are associated with three of the four
RSGs and three of the six YHGs in the cluster, which are due to
quiescent mass loss rather than outbursts. The extended nebulae of W20
and W26 have a cometary morphology, implying significant interaction
with either the intracluster medium or cluster wind. For some of the
cool star winds, the ionizing source may be a companion star though the
cluster radiation density is sufficiently high to provide the necessary
ionizing radiation. Five WR stars are detected with composite
spectra, interpreted as arising in colliding-wind binaries.
the current wind. Such an envelope structure in W9 is reminiscent
of luminous blue variables, and one that shows evidence of two eras of
high, possibly eruptive mass loss. Surprisingly, three of the OB
supergiants are detected, implying unusually dense winds, though they
are embedded in more extended emission regions that may influence the
derived parameters. They also may have composite spectra, suggesting
binarity, which can lead to a higher flux than expected from a stellar
wind. Spatially resolved nebulae are associated with three of the four
RSGs and three of the six YHGs in the cluster, which are due to
quiescent mass loss rather than outbursts. The extended nebulae of W20
and W26 have a cometary morphology, implying significant interaction
with either the intracluster medium or cluster wind. For some of the
cool star winds, the ionizing source may be a companion star though the
cluster radiation density is sufficiently high to provide the necessary
ionizing radiation. Five WR stars are detected with composite
spectra, interpreted as arising in colliding-wind binaries.
Key words: stars: evolution - H II regions - open clusters and associations: individual: Westerlund 1
1 Introduction
Recent work strongly suggests that canonical mass-loss rates for O stars need to be revised downwards to accommodate the effect of wind clumping (Mokiem et al. 2007; Fullerton et al. 2006). Such main sequence (MS) mass-loss rates are insufficient to remove the H-rich mantle of the star prior to it becoming a Wolf Rayet (WR), shifting the burden of mass loss onto the short lived transitional phase of stellar evolution. This phase is populated by a wide variety of highly luminous, hot supergiant B[e] and luminous blue variable (LBV) stars, and cool Yellow Hypergiant (YHG) and red supergiant (RSG) stars. However the exact path of an O star through this transitional ``zoo'' as a function of initial mass is currently poorly understood, while the short-lived epochs, and hence rarity, of such stars complicates efforts to constrain their properties such as mass-loss rate and lifetime.
A better understanding of such short-lived phases in the life cycle of
massive stars is crucial to areas of astrophysics other than just
stellar evolution. For example massive stars are thought to
predominantly form in stellar aggregates, where they drive cluster
winds, which are a major source of mechanical feedback and chemically
processed material into the wider galactic environment, in turn
driving star formation and galactic evolution. Indeed
the feedback from large populations of super star clusters (SSC;
![]()
![]() )
may drive galactic scale
outflows, which, if present in Dwarf galaxies, may be sufficient to
strip them of their interstellar medium, preventing subsequent
generations of star formation (e.g. Westmoquette et al. 2007).
)
may drive galactic scale
outflows, which, if present in Dwarf galaxies, may be sufficient to
strip them of their interstellar medium, preventing subsequent
generations of star formation (e.g. Westmoquette et al. 2007).
One such cluster in the Galaxy is Westerlund 1
(Westerlund 1961), hereafter Wd 1, for which photometric and
spectroscopic observations suggest a unique population of both cool
and hot supergiants (Borgman et al. 1970; Westerlund 1987). Recently,
detailed optical and near-IR observations have confirmed these results
and revealed Wd 1 to be even more extreme than previously anticipated,
containing a large population of post-MS stars with representative
members of all evolutionary stages: OB supergiants and hypergiants,
RSGs, YHGs and WRs (Clark & Negueruela 2002; Clark et al. 2005, henceforth C02 and C05
respectively). Indeed, Wd 1 contains 6 YHGs,
more than 50% of the currently known population in the Galaxy, as
well as one of the largest WR populations of any cluster in the Galaxy
(Crowther et al. 2006). With a cluster mass of ![]() 105
105 ![]() (C05), Wd 1 is directly comparable to the SSCs observed in external
galaxies such as M 82 and thus represents a relatively nearby example
that provides a valuable opportunity to study the properties,
evolution and interaction of massive stars in their ``natural''
environment.
(C05), Wd 1 is directly comparable to the SSCs observed in external
galaxies such as M 82 and thus represents a relatively nearby example
that provides a valuable opportunity to study the properties,
evolution and interaction of massive stars in their ``natural''
environment.
Radio continuum observations are a long established tool for estimating mass-loss rates for early-type stars. As part of a programme to accomplish this for classical Be and B[e] stars, Clark et al. (1998, hereafter C98) imaged Wd 1 at radio wavelengths and found two unusually radio luminous stars; the sgB[e] star W9 and the RSG W26. In both cases the emission was found to be spatially resolved, suggestive of recent mass-loss events. Motivated by these unusual radio properties and the possibility of detecting emission from massive post-MS stars over a broad range of evolutionary stages we carried out a more extensive radio observation of Wd 1 at four frequencies.
We present the results of this survey in this paper. The observations are described in Sect. 2, with the radio sources identified in Sect. 3. Section 4 discusses the nature of the radio sources, Sect. 5 is a brief discussion of the extended emission, and the results are summarized in Sect. 6.
2 Observations
Observation of Wd 1 have been obtained at 8640, 4800, 2496 and 1384 MHz (corresponding to 3, 6, 13 and 20 cm respectively) using the Australia Telescope Compact Array. A first epoch was obtained 1998 March 4-5 in the 6B configuration, followed by observations 2001 January 7-8 in the more compact 750C configuration and on 2002 May 18 (only 8640 and 4800 MHz) in the 6A configuration. Together, these observations ensure good coverage across the spatial frequency range observed, though do not have identical spatial frequency coverage at each frequency. Hence, caution is suggested when comparing flux measures at the different frequencies for resolved, extended emission.
![\begin{figure}
\par\includegraphics[width=18cm,clip]{figure1.eps}
\vspace*{6mm}
\end{figure}](/articles/aa/full_html/2010/03/aa13505-09/img15.png)
|
Figure 1:
The ATCA observations of Wd 1 at 8.6 GHz ( upper left),
4.8 GHz ( upper right), 2.5 GHz ( lower left) and 1.4 GHz ( lower right). In each image, contour levels are
-3, 3, 6, 12, 24, 48, 96, |
| Open with DEXTER | |
Observations of Wd 1 were interleaved with repeated
observations of the nearby bright point source 1657-56 in
order to establish the antenna-based complex gains. Initial editing
and calibration of all observations was done using the M IRIAD
data reduction package (Sault et al. 1995). The gain solutions
established using 1657-56 were subsequently ``referenced'' by
interpolation to the Wd 1 observations. The absolute flux
scale was established using the primary calibrator 1934-638,
assuming fluxes of 2.84, 5.83, 11.14 and 14.94 Jy at 8.6, 4.8, 2.5 and
1.4 GHz respectively. The fluxes derived for 1657-56 are
shown in Table 1. No significant flux variations
(>![]() of the source flux) were noted in preliminary analysis of the
fluxes of the brightest unresolved sources (>2 mJy at 8.6 GHz)
in data from each epoch. Hence, data from the three epochs were
combined into one dataset in order to improve the signal-to-noise
ratio of the data and improve our ability to detect weaker sources.
of the source flux) were noted in preliminary analysis of the
fluxes of the brightest unresolved sources (>2 mJy at 8.6 GHz)
in data from each epoch. Hence, data from the three epochs were
combined into one dataset in order to improve the signal-to-noise
ratio of the data and improve our ability to detect weaker sources.
After phase-referencing and subsequent combination of the data from each epoch, deconvolution was done through visibility model fitting, a technique widely used in VLBI image construction, rather than the commonly used CLEAN technique. This was done using an automated model-fitting routine, the MODCONS macro within the SMERF patch (Reid 2006) to the D IFMAP package (Shepherd 1997). The major advantage of the ``smear fitting'' method implemented by SMERF is that it yields higher resolution for significantly detected features than estimated by the oft-used Rayleigh criteria (Reid 2006), represented by the FWHM of the synthesized beam. A model was established for the 8.6-GHz visibilities consisting of point and Gaussian source models, using the image data to guide the modelling process. This gave a model at the highest observed frequency, and hence at the highest resolution. Once the positions of the model components had been determined, the relatively high signal-to-noise ratio of the brightest sources in the field permitted the use of phase-only self-calibration to improve the antenna gain solutions from those derived from phase referencing alone. A ``best'' model was established with a final round of model fitting, keeping the positions fixed, to refine the flux of the model components. Note that no amplitude self-calibration was carried out using these models. This ``best'' model at 8.6 GHz was then used as the input model at the other frequencies. The resulting images at the four passbands are shown in Fig. 1.
Table 1: Fluxes determined for the phase-reference 1657-56.
|
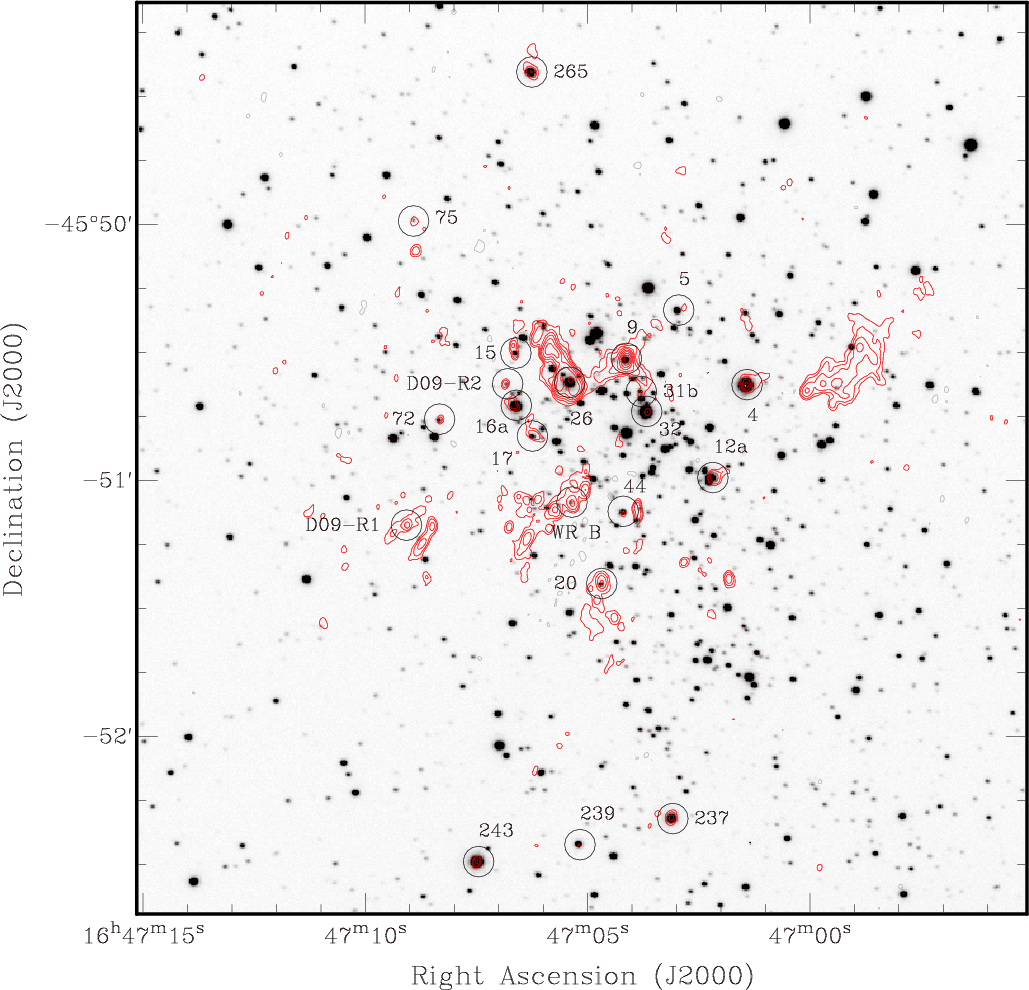
Figure 2:
8.6-GHz image overlaid on a FORS R-band image. The
limiting magnitude of the R-band image is
|
| Open with DEXTER | |
Table 2: Characteristics of stellar radio sources in the Wd 1 cluster.
3 The radio sources in Wd 1
3.1 Identification of radio stars
In order to identify stellar counterparts to the radio sources in Wd 1, an R-band image (655 nm effective wavelength) of the cluster was obtained on 2004 June 13 using the FORS2 camera on the VLT. After re-projecting the optical image to the same projection as the ATCA images using the AIPS task OHGEO, the absolute position of the optical image was fixed by assuming that the position of the point source component of the 8.6-GHz emission from W9, the brightest source in the radio image, is coincident with the peak of its optical emission, as determined using AIPS routine MAXFIT. Since the position of 8.6-GHz emission components was established by phase-referencing, the absolute position accuracy of the model components is determined by the accuracy of the position of the phase-reference source 1657-56, and on the residual antenna gain phase as a result of the offset between the position of the phase-reference source and Wd 1, separated by 8.8 degrees. It is estimated this leads to an uncertainty ofThe resulting overlay of the 8.6-GHz image and the R-band image is
shown in Fig. 2. A large number of optical sources
are coincident with radio sources. Setting a ![]() point source
detection limit of
0.23, 0.43, 0.86 and 1.45 mJy beam-1 at 8.6, 4.8, 2.5 and 1.4 GHz respectively, we identify the optical
sources with associated radio emission in Table 2.
point source
detection limit of
0.23, 0.43, 0.86 and 1.45 mJy beam-1 at 8.6, 4.8, 2.5 and 1.4 GHz respectively, we identify the optical
sources with associated radio emission in Table 2.
The position of putative optical counterparts to the radio sources were
also determined using the AIPS routine MAXFIT, and an
offset between the radio and optical positions derived. The
uncertainty in the relative position of the radio and the optical
image is governed by how well the optical image is referenced to the
radio image. By inspection of the position of W9, we estimate
this to be an uncertainty of approximately ![]() 200 mas. This is the
dominant position uncertainty for the sources. Radio sources that have
a position offset from a putative optical ``counterpart'' greater than
600 mas may not be associated, and so these potential
mis-identifications are identified in Table 2.
200 mas. This is the
dominant position uncertainty for the sources. Radio sources that have
a position offset from a putative optical ``counterpart'' greater than
600 mas may not be associated, and so these potential
mis-identifications are identified in Table 2.
A total of 18 stars are identified as radio emitters, with
optical-radio positional offsets <
![]() .
We identify two objects
with associated or potentially associated radio emission for which no
designation is available in the literature. Spectroscopy that could
identify if they are bona-fide cluster members is not available for
these objects so we do not assign Westerlund numbers to them, but name
them as D09-R1 and D09-R2 following the convention used by
Clark et al. (2008, hereafter C08). Three stars are identified as possible radio
emitters (W5, W16a and D09-R2) since they are offset from the
potential radio ``counterpart'' by between 0.6 and 1.0 arcsec, and
some caution may be warranted identifying these stars with the nearby
radio emission.
.
We identify two objects
with associated or potentially associated radio emission for which no
designation is available in the literature. Spectroscopy that could
identify if they are bona-fide cluster members is not available for
these objects so we do not assign Westerlund numbers to them, but name
them as D09-R1 and D09-R2 following the convention used by
Clark et al. (2008, hereafter C08). Three stars are identified as possible radio
emitters (W5, W16a and D09-R2) since they are offset from the
potential radio ``counterpart'' by between 0.6 and 1.0 arcsec, and
some caution may be warranted identifying these stars with the nearby
radio emission.
With this many stellar radio sources, Wd 1 has the richest population of radio emitting stars known for any young massive galactic cluster (e.g. Setia Gunawan et al. 2003; Moffat et al. 2002; Lang 2003). The stellar radio sources are blue, yellow or red super- or hypergiants and WR stars, representative of different stages of massive star evolution. The supergiant B[e] star W9 is by far the brightest stellar radio emitter in the cluster, as anticipated from the ``snapshot'' observation of the cluster presented by C98. Among the other four known blue hypergiants, only the LBV W243 is detected. Wd 1 has one of the richest populations of YHGs known in the Milky Way, with six members of this group (W4, 8a, 12a, 16a, 32, and 265), all of which are detected except for W8a and possibly W16a. All four known RSGs, six of the 16 WR stars in the field-of-view (24 known currently in the cluster), and four OB supergiants, are also associated with radio emission.
A number of sources appear to consist of multiple components (W4, W9, D09-R1 and W237) with a central unresolved source surrounded by a more extended component that is often significantly larger than the synthesized beam of the array. For W4 and W9, the extended component is clearly centred on the stellar source and an association with the extended emission is strongly implied. For D09-R1, the relationship of the stellar source and the extended emission is not as clear since the extended emission is offset from the associated point source.
3.2 Radio star characteristics
The radio fluxes of the sources were deduced from the model components
derived in the model fitting process, which were then corrected for
attenuation by the primary beam of the ATCA, dependent on their
distance from the pointing centre. The FWHM of the ATCA primary beam
is
5.86, 10.06, 19.91 and 34.61 arcmin at 8.6, 4.8, 2.5 and 1.4 GHz respectively. Given the size of the field-of-view is
![]() 4 arcmin, this leads to flux corrections of up to
4 arcmin, this leads to flux corrections of up to
![]() in the outer regions of the field-of-view at 8.6 GHz. In
an attempt to allow for systematic errors, the flux uncertainties
quoted in Table 2 are taken from the maximum of the
following three values: the
in the outer regions of the field-of-view at 8.6 GHz. In
an attempt to allow for systematic errors, the flux uncertainties
quoted in Table 2 are taken from the maximum of the
following three values: the ![]() rms uncertainty in the image, 10% of the source flux, or for resolved sources the rms uncertainty
in the image multiplied by the solid angle of the source. This
represents a conservative approach to estimating the flux
uncertainties, and hence to the estimated spectral indices. However,
it presumes that the model components used to describe a source are
not influenced by other emission from the region surrounding the
source. This may be an additional complication in determining the
fluxes of several sources (WR B, W20 and W26) since they are embedded in
more extended regions of emission that may impact the accuracy of the
derived fluxes. In addition to the source flux, it is noted which sources
appear resolved from the visibility modelling directly, avoiding
the impact of visibility weighting during imaging on the CLEAN
beam size and the subsequent limitations of source modelling in the
image plane.
rms uncertainty in the image, 10% of the source flux, or for resolved sources the rms uncertainty
in the image multiplied by the solid angle of the source. This
represents a conservative approach to estimating the flux
uncertainties, and hence to the estimated spectral indices. However,
it presumes that the model components used to describe a source are
not influenced by other emission from the region surrounding the
source. This may be an additional complication in determining the
fluxes of several sources (WR B, W20 and W26) since they are embedded in
more extended regions of emission that may impact the accuracy of the
derived fluxes. In addition to the source flux, it is noted which sources
appear resolved from the visibility modelling directly, avoiding
the impact of visibility weighting during imaging on the CLEAN
beam size and the subsequent limitations of source modelling in the
image plane.
It is noted that the flux values determined in this study are
approximately 10% higher than the values previously reported by
C98. It is not clear if the apparent increase in the
flux of W9 is due to intrinsic source variations or due to the
absolute calibration scale, given that the uncertainty in the absolute
flux calibration is ![]() 5-10%. We suspect the apparent variation is
due to a combination of absolute calibration uncertainty and the fact
the data used in this study extend to lower spatial frequencies than
in the study of C98, and hence may recover flux that was
``resolved out'' in the earlier observations. We suggest a more
accurate determination of total flux is presented here than in the
previous work.
5-10%. We suspect the apparent variation is
due to a combination of absolute calibration uncertainty and the fact
the data used in this study extend to lower spatial frequencies than
in the study of C98, and hence may recover flux that was
``resolved out'' in the earlier observations. We suggest a more
accurate determination of total flux is presented here than in the
previous work.
The radio spectral index ![]() ,
where
,
where
![]() ,
for each source was calculated by a weighted regression fit of a
single power-law to the fluxes. Use of a single power-law presumes
there is no curvature in the continuum spectra over the frequency
range observed. Inspection of the spectra of those sources detected at
all bands shows no compelling evidence of curvature, given the
uncertainties in the radiometry at each band. The resulting values for
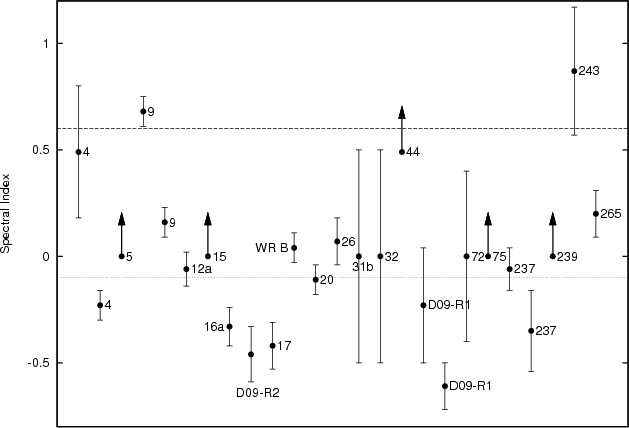
spectral indices and uncertainties are given in
Table 2 and displayed in
Fig. 3. For sources with radiometry at all
frequency bands, the resulting single power-law index values are less
affected by potential systematic errors in the flux measures at each
band, compared to indices derived across a smaller frequency range
e.g. 8.6 to 4.8 GHz. For sources that are undetected at one or more
bands, and upper limits quoted, only the detected fluxes were used to
calculate spectral index, unless they helped further constrain the
spectral index value e.g. W44. It should be noted that the fluxes for
sources only detected at one or two bands are all low (<1 mJy) and
the uncertainty in the derived spectral indices is high.
,
for each source was calculated by a weighted regression fit of a
single power-law to the fluxes. Use of a single power-law presumes
there is no curvature in the continuum spectra over the frequency
range observed. Inspection of the spectra of those sources detected at
all bands shows no compelling evidence of curvature, given the
uncertainties in the radiometry at each band. The resulting values for
spectral indices and uncertainties are given in
Table 2 and displayed in
Fig. 3. For sources with radiometry at all
frequency bands, the resulting single power-law index values are less
affected by potential systematic errors in the flux measures at each
band, compared to indices derived across a smaller frequency range
e.g. 8.6 to 4.8 GHz. For sources that are undetected at one or more
bands, and upper limits quoted, only the detected fluxes were used to
calculate spectral index, unless they helped further constrain the
spectral index value e.g. W44. It should be noted that the fluxes for
sources only detected at one or two bands are all low (<1 mJy) and
the uncertainty in the derived spectral indices is high.
Table 3: Number of radio emitters of given spectral type.
None of the sources have a completely optically-thick thermal spectrum
(
![]() ), though several have spectra consistent with
), though several have spectra consistent with
![]() ,
expected for a partially optically-thick,
steady-state stellar wind e.g. the compact components in W4, 9, 44 and 243.
,
expected for a partially optically-thick,
steady-state stellar wind e.g. the compact components in W4, 9, 44 and 243.
The majority of the sources have indices that are quite shallow
compared to the expected value for a stellar wind, with many having
indices consistent with -0.1, the value for optically-thin thermal
emission. A combination of optically thick and thin emission
components can give rise to such spectra, such as clumpy stellar winds
where the clumps are optically thick
(e.g. Ignace & Churchwell 2004). Alternatively, in some of these objects
the emission may be due to a combination of thermal and non-thermal
emission forming a composite spectrum, as observed in a number of
massive stars, where the non-thermal emission is attributed to a
colliding-wind binary (CWB) (e.g. Chapman et al. 1999; van Loo et al. 2006; Dougherty & Williams 2000). Depending on the relative strength of
the two continuum components, the spectral index could lie anywhere
between ![]() +0.8 and -0.6, this latter value typical of
optically-thin synchrotron emission. This makes an unequivocal
identification of the underlying emission difficult. To compound
matters, composite spectra due to thermal+non-thermal emission may
not be well represented by a single power-law
(e.g. Pittard et al. 2006). However, identification of
CWBs is helped through observations at other
wavelengths, largely thermal X-ray emission arising from shock-heated
plasma in the wind-collision region, and/or dust emission that appears
to be a common feature in carbon-type WR star massive binaries with
non-thermal emission (Williams 1999).
+0.8 and -0.6, this latter value typical of
optically-thin synchrotron emission. This makes an unequivocal
identification of the underlying emission difficult. To compound
matters, composite spectra due to thermal+non-thermal emission may
not be well represented by a single power-law
(e.g. Pittard et al. 2006). However, identification of
CWBs is helped through observations at other
wavelengths, largely thermal X-ray emission arising from shock-heated
plasma in the wind-collision region, and/or dust emission that appears
to be a common feature in carbon-type WR star massive binaries with
non-thermal emission (Williams 1999).
There are a few sources with indices that, at face value, are more negative than -0.1, suggesting non-thermal emission e.g. W17 and the extended component associated with W4. Other potential members of this group are W16a, D09-R2 and the extended emission near D09-R1 but, as noted earlier, the association of the radio emission with the underlying stars is unclear. The derived spectral index for the extended emission in W4 is consistent with optically- thin thermal emission at the 95% confidence level. This leaves W17 as the only bona-fida non-thermal source.
Additional observations over a broader range of frequencies are required to establish more firmly the nature of the radio emission from the stars in Wd 1. Individual cases are discussed in Sect. 4 where the observations from each stellar sub-type are discussed in detail.
|
Figure 3:
The spectral indices of the stellar radio sources in Wd 1,
identified by their Westerlund numbers. The canonical spectral
indices for partially optically thick thermal emission from a stellar
wind (+0.6) and optically thin thermal emission (-0.1) are
highlighted by the dashed and dotted lines. Error bars are 1
sigma. The arrows denote lower limits to the derived spectral
index. Radio sources offset from potential optical counterparts by
more than 0.6
|
| Open with DEXTER | |
Table 4: Properties of the extended radio emission regions in the cluster centre.
|
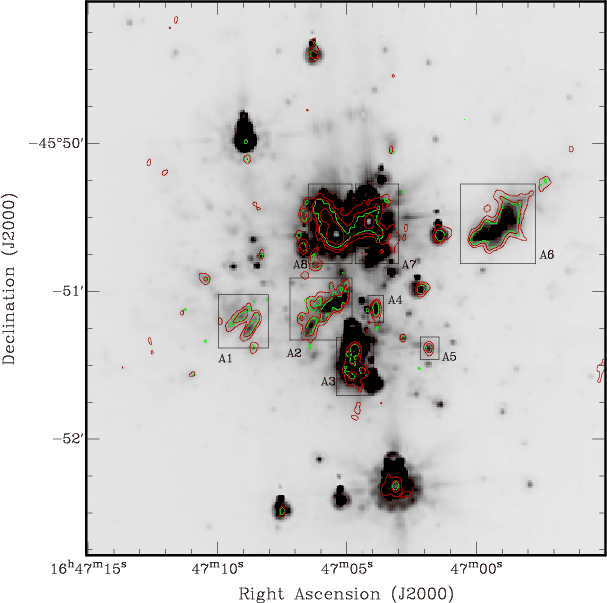
Figure 4:
Comparison of radio emission at 8.6 (green) and 4.8-GHz
(red) observations with |
| Open with DEXTER | |
3.3 Extended radio emission
In addition to the radio emission that is associated with stars it is clear there are a number of large, extended emission regions, distributed withinThe total radio flux from Wd 1 as measured in the interferometer
data presented here is 422, 461, 523 and 669 mJy at 8.6, 4.8, 2.2, and
1.4 GHz respectively. This is compared to an interpolation of the
single-dish fluxes reported by Kothes & Dougherty (2007), which gives fluxes
at the same frequencies of 450, 499, 560, and 620 mJy. Given that the
flux uncertainties in the single dish measures is likely ![]() 10%,
the total fluxes derived here from the ATCA data are in excellent
agreement with the single dish fluxes.
10%,
the total fluxes derived here from the ATCA data are in excellent
agreement with the single dish fluxes.
To determine the flux in extended emission, we subtract the radio
emission associated with the stellar sources as given in
Table 2 from the total flux determined by the ATCA.
This leads to fluxes of 307, 351 and 426 mJy at 8.6, 4.8 and 2.2 GHz,
with an uncertainty of ![]()
![]() . The flux at 1.4 GHz is not
quoted since it is difficult to ascertain accurately for the radio
stars, most especially for sources embedded in extended
emission. Comparing these values to those given in
Table 4 and taking into account their
uncertainty, shows good agreement, perhaps degrading toward 2.2 GHz,
which suggests there is little other extended emission in Wd 1 beyond
the regions demarked in Fig. 4.
. The flux at 1.4 GHz is not
quoted since it is difficult to ascertain accurately for the radio
stars, most especially for sources embedded in extended
emission. Comparing these values to those given in
Table 4 and taking into account their
uncertainty, shows good agreement, perhaps degrading toward 2.2 GHz,
which suggests there is little other extended emission in Wd 1 beyond
the regions demarked in Fig. 4.
Using the total fluxes above for the extended emission in Wd 1 gives a
spectral index of
![]() ,
consistent with optically-thin
thermal emission.
Following the prescription given in Sect. 4.3, an 8.6-GHz
flux of 310 mJy from a region
,
consistent with optically-thin
thermal emission.
Following the prescription given in Sect. 4.3, an 8.6-GHz
flux of 310 mJy from a region
![]() in diameter leads to an
ionized mass of 15
in diameter leads to an
ionized mass of 15 ![]() for a plasma temperature of 10 kK, in
excellent agreement with the ionized mass derived by
Kothes & Dougherty (2007).
for a plasma temperature of 10 kK, in
excellent agreement with the ionized mass derived by
Kothes & Dougherty (2007).
C98 showed that the nebular radio emission associated with the RSG W26
correlated with mid-IR emission. Figure 4 shows
an overlay of the radio emission in Wd 1 with Spitzer GLIMPSE data at
![]() m (Benjamin et al. 2003). Without being distracted by the
saturation and artefacts in the mid-IR image, it is striking that all
the extended radio emission is associated with mid-IR emission.
Additionally, note that mid-IR emission is associated with each of the
RSG and YHG stars in the cluster (Sect. 4.3). Such a close
correlation between the ionized emission evidenced in the radio and
the 8
m (Benjamin et al. 2003). Without being distracted by the
saturation and artefacts in the mid-IR image, it is striking that all
the extended radio emission is associated with mid-IR emission.
Additionally, note that mid-IR emission is associated with each of the
RSG and YHG stars in the cluster (Sect. 4.3). Such a close
correlation between the ionized emission evidenced in the radio and
the 8 ![]() m emission is well established in ultra-compact H II regions, where the 8
m emission is well established in ultra-compact H II regions, where the 8 ![]() m emission is due to excited PAH emission
(e.g. Hoare et al. 2007) whereas in more evolved H II regions
there is a clear association with hot dust, and the PAH emission
associated with the photo-dissociation region beyond the ionized gas
(e.g. Povich et al. 2007; Watson et al. 2008)
m emission is due to excited PAH emission
(e.g. Hoare et al. 2007) whereas in more evolved H II regions
there is a clear association with hot dust, and the PAH emission
associated with the photo-dissociation region beyond the ionized gas
(e.g. Povich et al. 2007; Watson et al. 2008)
4 The stellar sources
The post-MS evolution of stars with masses in excess of
![]() 30
30 ![]() is characterized by significant mass loss. While
such mass loss plays a critical role in determining the subsequent
evolution of the stars, the physical processes driving it are
currently ill-constrained, with the mass-loss rate and wind velocities
anticipated to differ by several orders of magnitude depending on the exact
evolutionary phase. Given that Wd 1 is uniquely well stocked with
examples of every known post-MS stellar type, these observations offer
the possibility of constraining this process.
is characterized by significant mass loss. While
such mass loss plays a critical role in determining the subsequent
evolution of the stars, the physical processes driving it are
currently ill-constrained, with the mass-loss rate and wind velocities
anticipated to differ by several orders of magnitude depending on the exact
evolutionary phase. Given that Wd 1 is uniquely well stocked with
examples of every known post-MS stellar type, these observations offer
the possibility of constraining this process.
Consequently, the following discussion on the nature of the radio
emission for the 18 stellar detections is presented in a likely
evolutionary sequence from OB supergiants, through cool
super-/hypergiants, early hypergiants and WN and WC Wolf-Rayet
stars. Given their comparatively weak winds
(![]() 10-7
10-7 ![]() yr-1), the mid-to-late O-type main
sequence progenitors of these stars are not detected
(Martins et al. 2005). The emission associated with the sgB[e] star W9
is discussed outside this evolutionary sequence, due to the uncertain
placement of the sgB[e] phase in the post-MS stellar zoo.
yr-1), the mid-to-late O-type main
sequence progenitors of these stars are not detected
(Martins et al. 2005). The emission associated with the sgB[e] star W9
is discussed outside this evolutionary sequence, due to the uncertain
placement of the sgB[e] phase in the post-MS stellar zoo.
Throughout the discussion it will be assumed that Wd 1 is at a
distance of 4 kpc. Recent deep-IR imaging identifies the MS and pre-MS
populations of Wd 1, leading to a photometric distance of
![]() kpc (Brandner et al. 2008), consistent with both
kpc (Brandner et al. 2008), consistent with both
![]() kpc from an analysis of near-IR photometry of the WR stars
in Wd 1 (Crowther et al. 2006), and on an atomic hydrogen absorption
distance of
kpc from an analysis of near-IR photometry of the WR stars
in Wd 1 (Crowther et al. 2006), and on an atomic hydrogen absorption
distance of ![]() kpc (Kothes & Dougherty 2007).
kpc (Kothes & Dougherty 2007).
4.1 W9 - a luminous radio source
By far the brightest radio source in Wd 1 is W9, with a total flux at 8.6 GHz of 55.4 mJy, giving an 8.6-GHz luminosity ofC98 hypothesised that W9 comprised of two components, a compact stellar wind source and an extended region. The observations presented in this paper support this model, with an unresolved source surrounded by an extended region of emission that are both detected at all four observing frequencies.
The spectral index of the unresolved source coincident with W9 is
![]() ,
consistent with thermal emission arising from a
partially optically thick, steady-state stellar wind with an r-2 radial density distribution. It is assumed this component represents
the present day stellar wind from W9. The spectral index of the
extended region is
,
consistent with thermal emission arising from a
partially optically thick, steady-state stellar wind with an r-2 radial density distribution. It is assumed this component represents
the present day stellar wind from W9. The spectral index of the
extended region is
![]() ,
which we take to be essentially
flat, and arguably consistent with optically-thin thermal
emission. Assuming the extended region has a r-2 radial ion
density distribution, similar to the stellar wind, the lack of a
turnover in its continuum spectrum to a positive spectral index
implies that the extended region is totally optically thick down
to 1.4 GHz. With the free-free opacity for an r-2 ion
distribution at frequency
,
which we take to be essentially
flat, and arguably consistent with optically-thin thermal
emission. Assuming the extended region has a r-2 radial ion
density distribution, similar to the stellar wind, the lack of a
turnover in its continuum spectrum to a positive spectral index
implies that the extended region is totally optically thick down
to 1.4 GHz. With the free-free opacity for an r-2 ion
distribution at frequency ![]() behaving as
behaving as
![]() where p is the impact parameter (see Eq. (A.2)), the lack of a
turnover implies that the extended region must have an inner radius
that is larger than the radius of the
where p is the impact parameter (see Eq. (A.2)), the lack of a
turnover implies that the extended region must have an inner radius
that is larger than the radius of the
![]() surface at 1.4 GHz. In this case, it is suggested that the extended region
represents an earlier phase of mass-loss from W9, prior to the start
of the current stellar wind phase.
surface at 1.4 GHz. In this case, it is suggested that the extended region
represents an earlier phase of mass-loss from W9, prior to the start
of the current stellar wind phase.
To model the continuum spectra of both the stellar wind and the
extended envelope a shell-like geometry is adopted, with outer and
inner radii ![]() and
and ![]() respectively and with a r-2 radial
ion distribution (e.g. Taylor et al. 1987). The free-free opacity at
radius p in such an envelope is determined using
Eqs. (A.2), (A.3) and (A.4). Together with Eq. (A.1), these
lead to the flux from the envelope at frequency
respectively and with a r-2 radial
ion distribution (e.g. Taylor et al. 1987). The free-free opacity at
radius p in such an envelope is determined using
Eqs. (A.2), (A.3) and (A.4). Together with Eq. (A.1), these
lead to the flux from the envelope at frequency ![]() .
Assuming an
electron temperature
.
Assuming an
electron temperature
![]() kK and an outflow velocity of
200 km s-1, a best-fit of this model to the continuum spectra of
the two components over the four observing frequencies gives the
parameters of the two components (Table 5 and
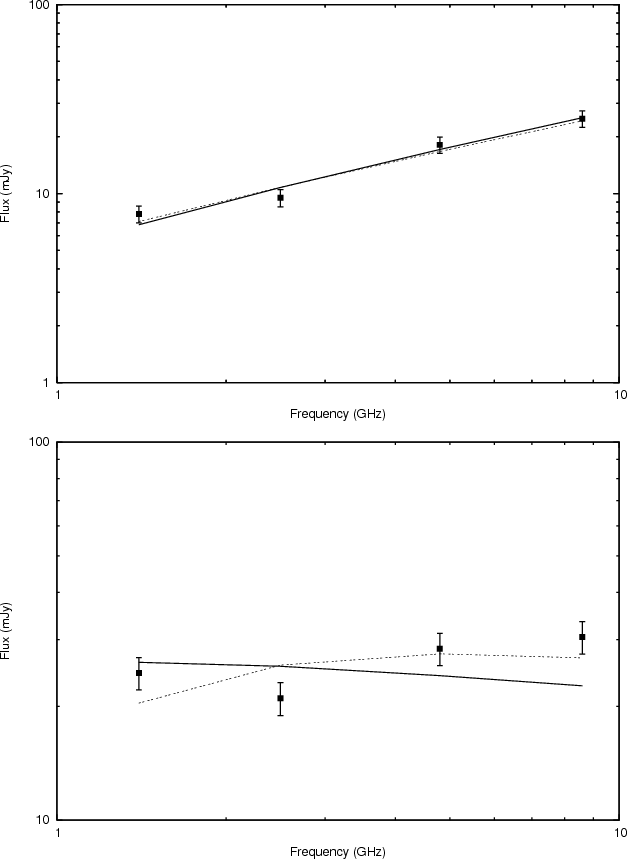
Fig. 5). The uncertainties in the fitting parameters
are derived in the standard manner of fixing all but one parameter
which is varied until
kK and an outflow velocity of
200 km s-1, a best-fit of this model to the continuum spectra of
the two components over the four observing frequencies gives the
parameters of the two components (Table 5 and
Fig. 5). The uncertainties in the fitting parameters
are derived in the standard manner of fixing all but one parameter
which is varied until ![]() changes by unity.
changes by unity.
|
Figure 5: Model fits to the continuum spectra of the unresolved partially-thick stellar wind ( top) and extended, optically-thin ( bottom) components of W9. The solid lines represent the best-fit model when the stellar wind outer radius/extended inner radii are constrained to be identical (Model 3). The dotted spectra are the best-fit models when the stellar wind outer radius and extended region inner radius are free parameters (Models 1 and 2). |
| Open with DEXTER | |
Table 5: Best-fit parameters of the r-2 shell model applied to the continuum spectra of the compact and extended radio components of W9.
A total of three models were examined. Model 1 leads to a mass-loss
rate of
![]()
![]() yr-1 for
yr-1 for
![]() kK (e.g. Leitherer & Robert 1991) for a
volume filling factor for clumps f (Abbott et al. 1981). The
mass-loss rate is scaled to 200 km s-1 since the outflow
velocity in W9 is not well constrained with observed line widths that
range between 40 and 800 km s-1 (C08). Assuming the
same outflow velocity and clump structure, the derived mass-loss rate
of the extended region (Model 2) is approximately twice as high as the
current phase of mass-loss, implying an earlier era of higher
mass-loss rate
kK (e.g. Leitherer & Robert 1991) for a
volume filling factor for clumps f (Abbott et al. 1981). The
mass-loss rate is scaled to 200 km s-1 since the outflow
velocity in W9 is not well constrained with observed line widths that
range between 40 and 800 km s-1 (C08). Assuming the
same outflow velocity and clump structure, the derived mass-loss rate
of the extended region (Model 2) is approximately twice as high as the
current phase of mass-loss, implying an earlier era of higher
mass-loss rate ![]() 10-4
10-4 ![]() yr-1.
yr-1.
The model spectrum of the individual radio components established that
the best-fit outer radius of the compact component (the current
stellar wind) is greater than the inner bound of the extended region
(earlier phase of mass-loss). If the mass-loss that produced both
components is radially symmetric, it is not plausible for the inner
radius of the extended region to be smaller than the extent of the
current stellar wind. The third model (Model 3) assumed the inner
bound of the extended region is at least as large as the outer bound
of the current stellar wind. Fitting both continuum spectra
simultaneously through minimizing the total ![]() from
the two
models gives the parameters of Model 3, which supports a factor of
3 higher mass-loss rate in the earlier phase of mass-loss than in
the
current stellar wind. The resulting model fits to the data are shown
in Fig. 5.
from
the two
models gives the parameters of Model 3, which supports a factor of
3 higher mass-loss rate in the earlier phase of mass-loss than in
the
current stellar wind. The resulting model fits to the data are shown
in Fig. 5.
The derived mass-loss rate for the putative earlier mass-loss phase is
high for a massive star, being of the same order as the the current
mass-loss rate in ![]() Carina of
Carina of ![]() 10-4 - 10-3
10-4 - 10-3 ![]() yr-1 (Corcoran 2008). The inner bound
of
yr-1 (Corcoran 2008). The inner bound
of ![]() 4000 AU suggests that this mass-loss epoch would have ended
4000 AU suggests that this mass-loss epoch would have ended
![]() 200 yr ago assuming an outflow velocity of 200 km s-1,
followed subsequently by the current mass-loss phase with
200 yr ago assuming an outflow velocity of 200 km s-1,
followed subsequently by the current mass-loss phase with ![]() lower density.
lower density.
With such a model for the circumstellar environment, what does this
imply for the evolutionary status of W9? While veiling any
photospheric features, the rich optical-IR emission line spectrum and
IR excess indicate a rich circumstellar environment and permit a
formal sgB[e] star classification (C08; Ritchie et al. 2010). However
spectral peculiarities exist when compared to other examples; most
notably the unusual composite line profiles of He I 5876 and
6678 ![]() .
The X-ray emission from W9 supports a binary system, being
too hard (
.
The X-ray emission from W9 supports a binary system, being
too hard (![]() keV) and bright (
keV) and bright (
![]() erg s-1)
to arise in a single star, although it does not constrain the nature
of the components (C08; Ritchie et al. 2010). Likewise, while W9 is
found to be photometrically variable, no period has been identified
currently (Bonanos 2007). Identification of W9 as a binary
awaits further supporting observational evidence.
erg s-1)
to arise in a single star, although it does not constrain the nature
of the components (C08; Ritchie et al. 2010). Likewise, while W9 is
found to be photometrically variable, no period has been identified
currently (Bonanos 2007). Identification of W9 as a binary
awaits further supporting observational evidence.
The current mass-loss rate of W9 is approximately an order of
magnitude higher than that inferred for any of the other transitional
stars within Wd 1. It is directly comparable to those of the LBVs
AFGL 2298, AG Car, FMM 362 and the Pistol
star in quiescence with
![]()
![]() yr-1 (Najarro et al. 2009; Groh et al. 2009; Clark et al. 2009), despite being a factor of
yr-1 (Najarro et al. 2009; Groh et al. 2009; Clark et al. 2009), despite being a factor of ![]()
![]() less
luminous
less
luminous![]() . Moreover, depending on the outflow
velocity and wind-clumping factor the mass-loss rate for W9 is
uncomfortably close to the limit expected for a line-driven wind for
which Smith & Owocki (2006) estimate a maximum mass-loss rate of
. Moreover, depending on the outflow
velocity and wind-clumping factor the mass-loss rate for W9 is
uncomfortably close to the limit expected for a line-driven wind for
which Smith & Owocki (2006) estimate a maximum mass-loss rate of

Such a high mass-loss rate and the presence of a detached shell of material formed in a previous phase of enhanced mass loss is suggestive of an LBV identification, with
However, while the current observational data are consistent with the
ejecta being formed as a result of the post-MS evolution of
a single massive star, its formation in an interacting binary system
undergoing significant mass transfer, in turn leading to common
envelope evolution, also appears viable and well motivated given the
evidence of W9 being a binary. Examples of massive binaries with both
a normal and a relativistic companion are known: RY Scuti and SS433
respectively, and thus provide observational templates. As with W9,
both these systems have rich emission-line spectra and IR excesses due
to the presence of circumstellar dust (Gehrz et al. 1995; Clark et al. 2007, and references
therein). More interestingly, both are
associated with compact, bright radio nebulae with sizes and fluxes
directly comparable to W9 yet attributed to mass lost through binary
interaction (Gehrz et al. 1995; Blundell et al. 2001). The former authors
derive a mass-loss rate of the order of 10-4 ![]() yr-1from the radio observations for SS433, while the latter infer an
ionized mass of 10-3
yr-1from the radio observations for SS433, while the latter infer an
ionized mass of 10-3 ![]() for the nebula associated with
RY Scuti, with a mass-loss rate of
for the nebula associated with
RY Scuti, with a mass-loss rate of ![]() 10-4 -
10-5
10-4 -
10-5 ![]() yr-1 inferred from optical emission lines
(de Martino et al. 1992); both rates are comparable with W9.
yr-1 inferred from optical emission lines
(de Martino et al. 1992); both rates are comparable with W9.
4.2 The OB supergiants
Currently, there areConsequently, the apparent detections of W15 and W17 (O9Ib and O9Iab respectively - Negueruela et al., in prep.), D09-R1 and potentially D09-R2 (both B0I or earlier; C08) are somewhat unexpected, most especially considering that these stars are unremarkable compared with the rest of the OB stars studies spectroscopically. Of note is that W15, W17 and D09-R1 all are coincident with extended emission regions and the parameters of the unresolved radio components coincident with the underlying stars are likely influenced by this extended emission. As a result, the derived parameters may not reflect the intrinsic properties of the underlying stars, but rather the extended plasma region.
That withstanding, W17 has a spectral index marginally steeper than
-0.1, hinting at non-thermal emission and a potential CWB. However, we
note it does not have detected X-ray emission C08 and
shows no evidence of RV variations (Ritchie et al. 2009a). W15 has a
spectral index lower limit of 0.0, and it is not possible to
distinguish whether the emission is from either a stellar wind or a
non-thermal/thermal composite source. It shows no evidence for
binarity in either RV observations (Ritchie et al. 2009a) or X-ray
observations (C08), where the emission is soft
(![]() keV) and at a level expected for a single O-type star
(
keV) and at a level expected for a single O-type star
(![]()
![]() erg s-1; e.g. Berghoefer et al. 1997) as
a result of shock heating within the stellar wind. Nevertheless, if
the radio flux is attributed to thermal emission from a stellar wind,
W15 would have an unusually high mass-loss rate of
erg s-1; e.g. Berghoefer et al. 1997) as
a result of shock heating within the stellar wind. Nevertheless, if
the radio flux is attributed to thermal emission from a stellar wind,
W15 would have an unusually high mass-loss rate of
![]()
![]() yr-1 in comparison to other
late-O/early-B supergiants (Mokiem et al. 2007; Crowther et al. 2006).
The
absence of RV variations in these stars does not rule out a binary
interpretation unequivocally since the mass ratios may be extreme and
the inclination of the orbit unfavorable for ready detection of
RV variations. Furthermore, the orbital period could be
significantly in
excess of the observation timescale.
yr-1 in comparison to other
late-O/early-B supergiants (Mokiem et al. 2007; Crowther et al. 2006).
The
absence of RV variations in these stars does not rule out a binary
interpretation unequivocally since the mass ratios may be extreme and
the inclination of the orbit unfavorable for ready detection of
RV variations. Furthermore, the orbital period could be
significantly in
excess of the observation timescale.
The spectral index of the point source associated with D09-R1 is complicated by the presence of an extended component, and given the absence of both optical spectroscopy and an X-ray detection, it is simply concluded that the nature of this emission remains uncertain, and note that if it is assumed to be a stellar wind, the same problems with respect to an extreme mass-loss rate as found for W15 are encountered.
4.3 The cool super- and hypergiants
All four of the RSGs and at least four of the six YHGs in Wd 1 are radio sources. Irrespective of the uncertain identification of W16a as a radio emitter, the fraction of radio sources amongst both these classes of object is high. Of the RSGs, W75 was the weakest source detected and was unresolved at any wavelength. The other three detected RSGs (W20, 26 and 237) have extended radio emission.
For both W20 and W26 the radio emission is best characterised by two
components: a compact (![]()
![]() ), spatially resolved source
coincident with the star, and a more extended nebula
(>
), spatially resolved source
coincident with the star, and a more extended nebula
(>
![]() ). W237 is similar in structure though the inner
component coincident with the star is unresolved. In W20 and W26 the
more extended components have a distinct cometary morphology that
extends away from the central region of the cluster, while that in W237 is more elliptical.
). W237 is similar in structure though the inner
component coincident with the star is unresolved. In W20 and W26 the
more extended components have a distinct cometary morphology that
extends away from the central region of the cluster, while that in W237 is more elliptical.
The radio properties of the YHGs are more heterogeneous. W8 is not detected. W32 is associated with a weak point source, while W12 and W265 are associated with compact resolved sources, similar to the RSG radio sources. Finally, the radio emission from W4 consists of a point source at the position of the star surrounded by an extended component.
The majority of the cool super- and hypergiants have spectral
indices that are flat, within the uncertainties. Unlike OB and
WR stars, composite thermal and non-thermal spectra have not been
identified previously, and are not expected. Hence we identify these
indices with optically-thin thermal emission. For a Maxwellian plasma
at temperature T, the optically-thin radio flux density is given by

where D is the distance in kpc and EV is the emission integral

at 8.6 GHz. The total ionized mass can then be determined from
The ionized masses of the nebulae, based on the source parameters
determined at 8.6 GHz, are given in Table 6. Note
this is not the total mass since these observations are insensitive to
any neutral component. On average, the emission integral
![]() cm-3, implies an ionizing
luminosity that has to be greater than
cm-3, implies an ionizing
luminosity that has to be greater than
![]() s-1, where
s-1, where
![]() is the is the hydrogen
recombination rate to all but the ground state. Such ionizing
luminosity is not available from these relatively cool stars with
stellar effective temperatures
is the is the hydrogen
recombination rate to all but the ground state. Such ionizing
luminosity is not available from these relatively cool stars with
stellar effective temperatures ![]() 5000 K
(e.g. de Jager 1998).
5000 K
(e.g. de Jager 1998).
How are these envelopes ionized? A cluster of mass 105 ![]() and solar metallicity can easily provide such a photon luminosity and
seems the most likely source of the ionizing radiation. Taking the
cluster to be approximately 1 pc across and with
and solar metallicity can easily provide such a photon luminosity and
seems the most likely source of the ionizing radiation. Taking the
cluster to be approximately 1 pc across and with ![]() 100 OB-type
stars implies that on average each OB star occupies a volume
0.04 pc3, and is separated from the next OB star by
100 OB-type
stars implies that on average each OB star occupies a volume
0.04 pc3, and is separated from the next OB star by
![]() 0.34 pc. If each OB star provides 1048 s-1 ionizing
photons (Martins et al. 2005), with
0.34 pc. If each OB star provides 1048 s-1 ionizing
photons (Martins et al. 2005), with ![]() 1045 s-1 required to
fully ionize the cool hypergiant envelopes, suggests a radiation
dilution factor
1045 s-1 required to
fully ionize the cool hypergiant envelopes, suggests a radiation
dilution factor ![]() (R*/D)-2 less than 1000, which implies
the hypergiant envelopes are
(R*/D)-2 less than 1000, which implies
the hypergiant envelopes are ![]() 0.01 pc radius. This is closely
consistent with the sizes observed for RSG nebulae e.g. VY CMa (see
Sect. 4.3.2).
0.01 pc radius. This is closely
consistent with the sizes observed for RSG nebulae e.g. VY CMa (see
Sect. 4.3.2).
Alternatively, a hot companion star could provide the required photon flux, which at 1045-46 s-1 implies an early B-type star. The YHG HR 8752 provides a precedent for such a model: it is detected at radio wavelengths and together with [N II]-emission lines, needs a source of ionizing radiation that is provided by a putative B1 companion (Stickland & Harmer 1978). In this respect we highlight the presence of [N II]-emission lines in the optical spectra of W20, W237 and W265 (Clark et al. 2010).
If the plasma in these optically-thin nebulae is due to mass loss from the underlying stars, having optically-thin spectra down to a frequency of 1.4 GHz implies that the ionized extended envelopes have inner radii significantly larger than the stellar radii. If this is the case, two possible models for the envelope can be advanced. The mass loss from these objects could have stopped or significantly decreased at some point in the past resulting in a detached shell. Alternatively, the ionized region may only occupy the periphery of the envelope, with the interior part of the envelope being neutral. Such a geometry could result from external ionization from the cluster radiation field. High-resolution observations are required to substantiate either of these potential models.
Table 6: Ionized mass estimates for the optically-thin stellar nebulae around the YHGs (top panel) and RSGs (bottom panel) in Wd 1.
4.3.1 The yellow hypergiants
Given the rarity of YHGs and the difficulty identifying suitable
observational diagnostics, few measurements of the quiescent or
outburst wind velocities and mass-loss rates of YHGs exist in the
literature. For HD 33579 (A3Ia+) in the LMC,
Stahl et al. (1991) quote
![]() km s-1 and
km s-1 and
![]()
![]() yr-1, and Israelian et al. (1999)
report
yr-1, and Israelian et al. (1999)
report
![]() km s-1 and
km s-1 and
![]()
![]() yr-1 for HR 8752 in 1998. For the well-known example
yr-1 for HR 8752 in 1998. For the well-known example ![]() Cas, Lobel et al. (1998) find
Cas, Lobel et al. (1998) find
![]() km s-1 and
km s-1 and
![]()
![]() yr-1 in 1993, in contrast to
yr-1 in 1993, in contrast to
![]() km s-1 and
km s-1 and
![]()
![]() yr-1 during the 2000 outburst
(Lobel et al. 2003). Castro-Carrizo et al. (2007) measure outflow
velocities of 35 km s-1 and 25-37 km s-1 for the ejecta
associated with HD 179821 and IRC +10 420 (although
a priori it is not clear if they were ejected in a RSG or YHG
phase). For both these stars, variable mass-loss rates of
yr-1 during the 2000 outburst
(Lobel et al. 2003). Castro-Carrizo et al. (2007) measure outflow
velocities of 35 km s-1 and 25-37 km s-1 for the ejecta
associated with HD 179821 and IRC +10 420 (although
a priori it is not clear if they were ejected in a RSG or YHG
phase). For both these stars, variable mass-loss rates of
![]()
![]() yr-1 and
yr-1 and
![]()
![]() yr-1 were found respectively
during the nebulae formation events, with Blöcker et al. (1999) also
reporting a mass-loss rate in excess of 10-3
yr-1 were found respectively
during the nebulae formation events, with Blöcker et al. (1999) also
reporting a mass-loss rate in excess of 10-3 ![]() yr-1for IRC +10 420 in the recent past. These works all suggest that
during outburst the mass-loss rates in YHGs are higher than during
quiescence whereas the outflow velocity is lower during outburst.
yr-1for IRC +10 420 in the recent past. These works all suggest that
during outburst the mass-loss rates in YHGs are higher than during
quiescence whereas the outflow velocity is lower during outburst.
Taking a mean 8.6-GHz flux of 2.5 mJy for the YHGs, their radio
luminosity is
![]() erg s-1. The only other radio
detected YHG in the Galaxy, HR 8752, has an 8.6-GHz flux of 17 mJy
(Dougherty et al., in prep.) at a distance of 1.7 kpc, giving a
luminosity of
erg s-1. The only other radio
detected YHG in the Galaxy, HR 8752, has an 8.6-GHz flux of 17 mJy
(Dougherty et al., in prep.) at a distance of 1.7 kpc, giving a
luminosity of
![]() erg s-1, similar to the YHGs in
Wd 1. HR 8752 has been interpreted to have a stellar wind from
measured spectral indices of
erg s-1, similar to the YHGs in
Wd 1. HR 8752 has been interpreted to have a stellar wind from
measured spectral indices of
![]() (Higgs et al. 1978) and
(Higgs et al. 1978) and
![]() (Dougherty et al., in prep.). Only the compact
component in W4 appears to have a spectral index consistent with a
stellar wind (
(Dougherty et al., in prep.). Only the compact
component in W4 appears to have a spectral index consistent with a
stellar wind (
![]() ), but given the uncertainty, arguably
also consistent with optically-thin thermal emission. Assuming
), but given the uncertainty, arguably
also consistent with optically-thin thermal emission. Assuming
![]() and
and
![]() as for W9 and that the putative wind from W4
is fully ionized and smooth (f=1) gives a mass-loss rate of
as for W9 and that the putative wind from W4
is fully ionized and smooth (f=1) gives a mass-loss rate of
![]()
![]() yr-1. This is consistent within a factor
of a few with the quiescent mass-loss rates of HD 33579,
HR 8752 and
yr-1. This is consistent within a factor
of a few with the quiescent mass-loss rates of HD 33579,
HR 8752 and ![]() Cas, but significantly lower than
inferred for
Cas, but significantly lower than
inferred for ![]() Cas, HD179821 and IRC
+10 420 during outburst, especially for comparably low velocities
(<40 km s-1).
Cas, HD179821 and IRC
+10 420 during outburst, especially for comparably low velocities
(<40 km s-1).
The extended nebulae around W4, W12a and W265 have masses of
![]()
![]() and radii of
and radii of ![]() 0.02 pc (based on
the major axis size in Table 6). An assumed
outflow velocity of
0.02 pc (based on
the major axis size in Table 6). An assumed
outflow velocity of ![]() 200 km s-1 gives a flow time of
200 km s-1 gives a flow time of
![]() 100 yr, during which time mass loss at a rate of
100 yr, during which time mass loss at a rate of
![]() 10-5
10-5 ![]() yr-1, as found for W4 above, yields a
total mass loss of 10-3
yr-1, as found for W4 above, yields a
total mass loss of 10-3 ![]() .
Thus, by comparison with the
cases of
.
Thus, by comparison with the
cases of ![]() Cas,
IRC +10 420 and HR 8752, the radio
nebulae associated with the YHGs in Wd 1 may be the
result of quiescent mass loss, rather than an outburst phase.
Cas,
IRC +10 420 and HR 8752, the radio
nebulae associated with the YHGs in Wd 1 may be the
result of quiescent mass loss, rather than an outburst phase.
None of the YHGs in Wd 1 possess the old (![]() 4000 yr), massive
(M>1
4000 yr), massive
(M>1 ![]() )
ejection nebulae seen in HD 179821 and IRC +10 420
(Castro-Carrizo et al. 2007; Oudmaijer et al. 1996). We suspect that in the
extreme environment of Wd 1 such nebulae would quickly be ablated by
the cluster wind arising from the OB stars - as appears to be the case
for the RSGs W20 and W26 (see Sect. 4.3.2). However we
cannot exclude the possibility that the YHGs may be evolving to cooler
temperatures (redwards) and have yet to encounter the instabilities
leading to extreme mass-loss rates in either the RSG or post-RSG
phase. A mixture of both pre- and post-RSG objects combined with the
intrinsic variability of YHGs (Clark et al. 2010) may explain the
heterogeneous radio properties of the Wd 1 population. This argument
is supported by evidence that even the best two candidates for
post-RSG stars, HD 179821 and IRC +10 420, exhibit quite dissimilar
nebular properties (Patel et al. 2008; Oudmaijer et al. 2009).
)
ejection nebulae seen in HD 179821 and IRC +10 420
(Castro-Carrizo et al. 2007; Oudmaijer et al. 1996). We suspect that in the
extreme environment of Wd 1 such nebulae would quickly be ablated by
the cluster wind arising from the OB stars - as appears to be the case
for the RSGs W20 and W26 (see Sect. 4.3.2). However we
cannot exclude the possibility that the YHGs may be evolving to cooler
temperatures (redwards) and have yet to encounter the instabilities
leading to extreme mass-loss rates in either the RSG or post-RSG
phase. A mixture of both pre- and post-RSG objects combined with the
intrinsic variability of YHGs (Clark et al. 2010) may explain the
heterogeneous radio properties of the Wd 1 population. This argument
is supported by evidence that even the best two candidates for
post-RSG stars, HD 179821 and IRC +10 420, exhibit quite dissimilar
nebular properties (Patel et al. 2008; Oudmaijer et al. 2009).
4.3.2 The red supergiants
Given very high mass-loss rates inferred for extremely luminous RSGs
(log (
![]() ) > 5.5), it is suspected that they play an
important role in post-MS evolution of stars at the Humphreys-Davidson
limit. Consequently, they have been the subject of numerous
(multi-wavelength) studies to constrain their mass-loss histories. Of
the Galactic examples, Schuster et al. (2006) used the HST/WFPC2 to
identify compact (
) > 5.5), it is suspected that they play an
important role in post-MS evolution of stars at the Humphreys-Davidson
limit. Consequently, they have been the subject of numerous
(multi-wavelength) studies to constrain their mass-loss histories. Of
the Galactic examples, Schuster et al. (2006) used the HST/WFPC2 to
identify compact (
![]() pc) nebulae associated with NML Cyg, VX Sgr and S Per, with Morris & Jura (1983) also
associating a much larger (>1 pc) H II region with
NML Cyg. de Wit et al. (2008) report the presence a nebula
around
pc) nebulae associated with NML Cyg, VX Sgr and S Per, with Morris & Jura (1983) also
associating a much larger (>1 pc) H II region with
NML Cyg. de Wit et al. (2008) report the presence a nebula
around ![]() Cep at 25 microns (
Cep at 25 microns (
![]() pc); a comparably
sized nebulae surrounds VY CMa (
pc); a comparably
sized nebulae surrounds VY CMa (
![]() pc in
HST/WFPC2 images; Smith et al. 2001). Finally Serabyn et al. (1991) and
Yusef-Zadeh & Morris (1991) report the presence of an asymmetric nebula
(
pc in
HST/WFPC2 images; Smith et al. 2001). Finally Serabyn et al. (1991) and
Yusef-Zadeh & Morris (1991) report the presence of an asymmetric nebula
(![]() 1pc in length) around the Galactic Centre RSG IRS7 at both
near-IR and radio wavelengths.
1pc in length) around the Galactic Centre RSG IRS7 at both
near-IR and radio wavelengths.
As with these stars, the discovery of large nebulae associated with three of the 4 RSGs in Wd 1 (major axis >0.2 pc; Table 6) emphasises the role of mass loss in this evolutionary stage. NML Cyg and IRS7 are of special interest in the context of the RSGs in Wd 1, given that these stars are also located within dense stellar aggregates, namely Cyg OB2 (Morris & Jura 1983) and the Galactic Centre cluster (e.g. Yusef-Zadeh & Morris 1991) respectively. Indeed the pronounced cometary nebulae of W20 and W26 appear similar both in morphology and linear scale to that of IRS7. Consequently we attribute the shape of these nebulae to a similar physical process, namely the interaction of the ejecta/RSG stellar wind with the cluster medium/wind. Lacking dynamical information, we refrain from attempting a quantitative analysis of the nebular morphologies, but note that the unremarkable radial velocities found for these stars by Mengel & Tacconi-Garman (2007) suggest that the dominant cause of ram pressure shaping the nebulae is the expansion of the cluster wind, rather than the rapid motion of the stars through a quasi-static cluster medium. This is supported by the orientation of each of these cometary nebulae away from the cluster centre region.
The morphology of the radio nebula associated with W237 suggests it
has been less affected by the cluster wind than either W20 or W26.
Adopting an outflow velocity of 30 km s-1 for the RSG wind, the
mass of 0.07 ![]() and radius of
and radius of ![]() 0.11 pc
(Table 6) results in a kinematic age of 3600 yr
and a time averaged mass-loss rate of
0.11 pc
(Table 6) results in a kinematic age of 3600 yr
and a time averaged mass-loss rate of
![]()
![]() yr-1.
This age supports the
suggestion that the radio nebula is little affected by the cluster
wind, otherwise it likely would be ablated as observed in W20
and W26. This is consistent with its position further from the
cluster
centre than either W20 or W26. The derived mass-loss rate is
comparable to the mass-loss rates found for field RSGs, which range
from 10-6-10-4
yr-1.
This age supports the
suggestion that the radio nebula is little affected by the cluster
wind, otherwise it likely would be ablated as observed in W20
and W26. This is consistent with its position further from the
cluster
centre than either W20 or W26. The derived mass-loss rate is
comparable to the mass-loss rates found for field RSGs, which range
from 10-6-10-4 ![]() yr-1 (Jura & Kleinmann 1990; Sylvester et al. 1998), although transient rates as high as
yr-1 (Jura & Kleinmann 1990; Sylvester et al. 1998), although transient rates as high as
![]() 10-3
10-3 ![]() yr-1 are seen in NML Cyg and VY
Cma (Smith et al. 2001; Blöcker et al. 2001) and as low as a
yr-1 are seen in NML Cyg and VY
Cma (Smith et al. 2001; Blöcker et al. 2001) and as low as a ![]() few
10-7
few
10-7 ![]() in
in ![]() Cep (de Wit et al. 2008) have
been observed.
Cep (de Wit et al. 2008) have
been observed.
Moreover, both W20 and W26 have similar nebular masses to W237 and, in turn, all three are directly comparable to that of the nebula surrounding VY CMa (Smith et al. 2001). Consequently the ejecta associated with the RSGs within Wd 1 appear to be the result of similarly extreme, possibly transient mass-loss events as those that yield the nebulae around other Galactic RSGs (e.g. Smith et al. 2001). In this respect, the apparent instabilities in W26 and W237 are of interest (Clark et al. 2010).
4.4 The B hypergiants
The final subset of transitional stars to be considered are the B hypergiants, which likely represent the immediate progenitors of WN-type stars. Included in this group are the LBV W243 and the cool B-type hypergiants W7, 33 and 42. The final member is the early-B hypergiant W13, which emphasises the close physical continuity between the B hypergiants and the hydrogen-rich late-WN stars such as W44 (=WR L (WN9h); C08) detected at 8.6 GHz (Table 2 and Sect. 4.5). Of these stars, only W243 has a spectral index indicative of thermal wind emission.W243 has recently been the subject of an extensive spectroscopic study by Ritchie et al. (2009b). This confirmed the finding of C02 that W243 had substantially cooled since the previous observations (e.g. Westerlund 1987), with the stellar temperature between 2002-8 being 8-9kK, with a formal spectral classification of mid-A type and a photospheric absorption spectrum of a YHG. However, detailed non-LTE analysis were unable to simultaneously reproduce these features and the prominent H I and He I emission lines, leading Ritchie et al. (2009b) to conclude that W243 harbored a hot binary companion. Unfortunately, current spectroscopic data are unable to constrain the nature of the hot companion; nevertheless at this time W243 closely resembles the known YHG binary HR8752 (Sect. 4.3.1) and we assume that the hot companion is responsible for the ionization of its wind.
Given the current properties of W243 we adopt identical values
of Z, ![]() and
and ![]() as used for the YHG W4, leading to a
mass-loss rate of
as used for the YHG W4, leading to a
mass-loss rate of
![]() ,
which is
directly comparable to W4. This is to be expected considering their
similar radio fluxes (Table 2). This mass-loss rate
is an order of magnitude higher than that found by
Ritchie et al. (2009b), correcting for difference in assumed outflow
velocity, though it should be noted that the observed optical spectrum
is relatively insensitive to the current mass-loss rate. Assuming a
4
,
which is
directly comparable to W4. This is to be expected considering their
similar radio fluxes (Table 2). This mass-loss rate
is an order of magnitude higher than that found by
Ritchie et al. (2009b), correcting for difference in assumed outflow
velocity, though it should be noted that the observed optical spectrum
is relatively insensitive to the current mass-loss rate. Assuming a
4![]() -detection limit of 0.24 mJy for the remaining stars yields a
corresponding upper limit to the mass-loss rates of
-detection limit of 0.24 mJy for the remaining stars yields a
corresponding upper limit to the mass-loss rates of
![]() .
.
In comparison, the LBVs HR Car and HD 160529 have
mass-loss rates of ![]()
![]()
![]() yr-1determined from radio observations, with HD 80077 and
HD 168607 an
yr-1determined from radio observations, with HD 80077 and
HD 168607 an ![]() order of magnitude lower
(Leitherer et al. 1995). Therefore, we conclude that the mass-loss
behavior of the Wd 1 population of B hypergiants is consistent with
expectations drawn from the wider Galactic population. No extended
emission is associated with any of these stars, whereas a number of
Galactic LBVs are associated with radio bright nebulae. However such
nebulae are typically found to be old (
order of magnitude lower
(Leitherer et al. 1995). Therefore, we conclude that the mass-loss
behavior of the Wd 1 population of B hypergiants is consistent with
expectations drawn from the wider Galactic population. No extended
emission is associated with any of these stars, whereas a number of
Galactic LBVs are associated with radio bright nebulae. However such
nebulae are typically found to be old (![]() 103-104 yr; Clark et al. 2003) and of an extent sufficient to encompass
the central regions of Wd 1. As argued for the YHGs, we suspect that
they would quickly be disrupted by the cluster wind and/or radiation
field.
103-104 yr; Clark et al. 2003) and of an extent sufficient to encompass
the central regions of Wd 1. As argued for the YHGs, we suspect that
they would quickly be disrupted by the cluster wind and/or radiation
field.
4.5 Wolf-Rayet stars
In recent years, Wd 1 has been shown to harbour at least 24 WR stars (Crowther et al. 2006), representing 8% of the currently known galactic population. Five of these have been detected in this radio survey at a flux level typically 0.3-0.5 mJy at 8.6 GHz: WR A (=W72), B, F(=W239), L(=W44), and V(=W31b) (Crowther et al. 2006, and references therein), potentially consistent with the radio emission originating in their stellar winds.WR B is an exception, with a deduced flux of 4.3 mJy. This flux
is
![]() higher than the other detected WR stars, implying a
wind density that is
higher than the other detected WR stars, implying a
wind density that is
![]() higher than the mean value for the
other WRs. Bonanos (2007) found that WR B is an eclipsing binary
and in binary systems the flux can be raised substantially above that
from a stellar wind by emission arising in a wind-collision region
(WCR) from the colliding winds of two massive stars in a binary
(e.g Dougherty et al. 2005). More likely, the flux of WR B is biased
by being a part of a more extended emission region (A3;
Sect. 3.3), a suggestion supported by data reduction
that indicates the 8.6-GHz emission is resolved which is not expected
for typical WR winds at this distance. For comparison, the closest WR star to the Sun, WR 11 at
higher than the mean value for the
other WRs. Bonanos (2007) found that WR B is an eclipsing binary
and in binary systems the flux can be raised substantially above that
from a stellar wind by emission arising in a wind-collision region
(WCR) from the colliding winds of two massive stars in a binary
(e.g Dougherty et al. 2005). More likely, the flux of WR B is biased
by being a part of a more extended emission region (A3;
Sect. 3.3), a suggestion supported by data reduction
that indicates the 8.6-GHz emission is resolved which is not expected
for typical WR winds at this distance. For comparison, the closest WR star to the Sun, WR 11 at ![]() 0.26 kpc (van der Hucht et al. 1997) has
a stellar wind that is resolved by the ATCA at 8.6 GHz, with a size of
0.47 arcsec (Dougherty et al., in prep.). If WR 11 was at a
distance of 4 kpc, the wind would be
0.26 kpc (van der Hucht et al. 1997) has
a stellar wind that is resolved by the ATCA at 8.6 GHz, with a size of
0.47 arcsec (Dougherty et al., in prep.). If WR 11 was at a
distance of 4 kpc, the wind would be ![]() 30 mas in diameter and not
resolved. This leads us to believe that the source parameters derived
for WR B are influenced by its location in the extended emission
region A3.
30 mas in diameter and not
resolved. This leads us to believe that the source parameters derived
for WR B are influenced by its location in the extended emission
region A3.
W44 (WR L) is the only WR star that has a spectral index consistent
with a partially optically-thick stellar wind, although the lower
limit to the spectral indices of WR F leave this possibility open. For
the WNVLh star WR L we adopt ![]() ,
Z=1.0 and
,
Z=1.0 and
![]() (e.g. Leitherer et al. 1997), resulting in
(e.g. Leitherer et al. 1997), resulting in
![]()
![]() yr-1 respectively. For the WC9 star WR F
adopting
yr-1 respectively. For the WC9 star WR F
adopting ![]() ,
Z=1.1 and
,
Z=1.1 and
![]() yields
yields
![]()
![]() yr-1. Both these mass-loss rates
are comparable to those found for similar stars in the Galactic Centre
cluster by Martins et al. (2007) and other field WRs
(e.g. Cappa et al. 2004).
yr-1. Both these mass-loss rates
are comparable to those found for similar stars in the Galactic Centre
cluster by Martins et al. (2007) and other field WRs
(e.g. Cappa et al. 2004).
The remaining three WR detections (WR A, F, V) have flat, though highly uncertain, spectral indices. If they are flat, an interpretation due to composite spectra composed of both thermal and non-thermal emission components would be consistent with that observed in a number of WR+OB binaries (Dougherty & Williams 2000). Certainly, among WR stars with flat radio spectra, those that have been observed at high resolution (e.g. Williams et al. 1997; Dougherty et al. 2005; Dougherty & Williams 2000, and references therein), all have identified WCRs arising in CWBs.
Recently, Wd 1 has been observed by CHANDRA (Skinner et al. 2006; Muno et al. 2006b; Clark et al. 2007; Muno et al. 2006a) and the WR stars WR A, B, F and L are all X-ray bright (
![]() erg s-1) and hard
(kT>2.6 keV i.e.
erg s-1) and hard
(kT>2.6 keV i.e.
![]() K). These temperatures are
expected for plasma heating by shocks in a WCR (Pittard & Parkin 2009; Stevens et al. 1992; Pittard 2009), which led both Clark et al. (2007) and
Skinner et al. (2006) to suggest these WR systems are all
CWB systems. In support of this argument, each of these WR stars have exhibited photometric variations in the optical
(Bonanos 2007). WR B demonstrates clear eclipses while WR A
demonstrates a 7.63-day periodic modulation to its light curve and is
also found to be a spectroscopic binary (Crowther et al. 2006), though
such a short-period system is not anticipated to exhibit evidence of
non-thermal radio emission due to a wind collision
(Dougherty & Williams 2000). However, if all these X-ray bright WR stars
are interpreted as CWBs, then the apparently thermal radio spectrum of
WR L would be attributed to a sufficiently short-period binary where
any non-thermal radio emission from a WCR is completely absorbed by
the circumbinary stellar wind(s) or the relativistic electrons are
cooled by the intense UV radiation of a putative massive companion.
K). These temperatures are
expected for plasma heating by shocks in a WCR (Pittard & Parkin 2009; Stevens et al. 1992; Pittard 2009), which led both Clark et al. (2007) and
Skinner et al. (2006) to suggest these WR systems are all
CWB systems. In support of this argument, each of these WR stars have exhibited photometric variations in the optical
(Bonanos 2007). WR B demonstrates clear eclipses while WR A
demonstrates a 7.63-day periodic modulation to its light curve and is
also found to be a spectroscopic binary (Crowther et al. 2006), though
such a short-period system is not anticipated to exhibit evidence of
non-thermal radio emission due to a wind collision
(Dougherty & Williams 2000). However, if all these X-ray bright WR stars
are interpreted as CWBs, then the apparently thermal radio spectrum of
WR L would be attributed to a sufficiently short-period binary where
any non-thermal radio emission from a WCR is completely absorbed by
the circumbinary stellar wind(s) or the relativistic electrons are
cooled by the intense UV radiation of a putative massive companion.
The IR excess associated with WR F has been attributed to hot dust (Groh et al. 2006; Crowther et al. 2006), again supporting a CWB interpretation, since dusty WC stars are widely considered to be in binaries with OB companions where wind-wind interaction is the essential mechanism that attains the high gas densities required for dust formation (e.g. Tuthill et al. 1999; Williams et al. 2009; Williams 1999; Monnier et al. 1999)
A synthesis of the IR, X-ray and these radio observations therefore argues for a high binary fraction amongst the WR stars, with C08 suggesting that at least 70%, and possibly the complete population, of WR stars in Wd 1 are in massive binary systems. However, given the lack of radial velocity variations from spectral line observations this assertion has yet to be verified, and may be exceedingly challenging to verify.
5 Extended emission
Lastly, we consider briefly the extended emission and its origin. Trivially, optically-thin thermal emission is associated with young massive clusters still embedded in Giant H II regions, where the young massive stars ionize the remnants of the natal Giant Molecular Cloud. However, this seems unlikely for Wd 1. At an age ofAn origin in recent stellar ejecta seems to be certain for stars such
as W20 and W26 with their large cometary nebula, but may not be so
clear for other regions such as A6, where no associated stellar source
is readily apparent in the FORS2 image. The ionized mass of A6 is
estimated to be ![]() 0.5
0.5 ![]() ,
which could have certainly
originated from a stellar wind. In addition, A6 does have a
cometary-like structure that also appears to point towards the cluster
centre region, like the nebulae around W20 and W26 (see
Fig. 4). An alternative explanation for some of
the diffuse emission is that it arises in natal material left behind
when the cluster region was largely swept clear by the cluster wind,
possibly through shielding by over-dense regions in the natal
cloud. The nature and origins of the extended emission will be
explored further in a forthcoming paper.
,
which could have certainly
originated from a stellar wind. In addition, A6 does have a
cometary-like structure that also appears to point towards the cluster
centre region, like the nebulae around W20 and W26 (see
Fig. 4). An alternative explanation for some of
the diffuse emission is that it arises in natal material left behind
when the cluster region was largely swept clear by the cluster wind,
possibly through shielding by over-dense regions in the natal
cloud. The nature and origins of the extended emission will be
explored further in a forthcoming paper.
6 Summary
We have presented the results of a multi-frequency radio survey of the galactic Super Star Cluster Wd 1, and used optical, IR and X-ray observations from the literature to elucidate the nature of the radio sources detected. We detect 18 radio sources for which positional coincidence suggests an association with a cluster member. These radio stars are associated with every class of post-MS star present in the cluster. Moreover, they comprise a diverse population of point-like, unresolved sources and extended, resolved sources, with spectral indices corresponding to thermal, non-thermal and composite thermal and non-thermal emission. Nevertheless, it appears possible to understand these properties under the current evolutionary paradigm for massive (binary) stars. In brief, the radio observations reveal the following properties for the massive stars in Wd 1:
- The brightest stellar radio source in Wd 1 is W9, with an
8.6-GHz luminosity that places it amongst the most luminous radio
stars known. The emission comprises both a point source and a more
extended nebula. The flux and spectral index of the point source
implies an origin in a powerful stellar wind, with a mass-loss rate of
 yr-1. The extended nebula is
deduced to arise from an earlier mass-loss epoch with a mass-loss rate
yr-1. The extended nebula is
deduced to arise from an earlier mass-loss epoch with a mass-loss rate
 3 times higher than the current stellar wind, close to the limit
expected for a line-driven wind (Smith & Owocki 2006). An obvious
comparison to make is to LBVs, with W9 having a current mass-loss rate
similar to galactic examples e.g. the Pistol star. Likewise, the
mass-loss rate deduced for the extended nebula is comparable to
several other galactic LBV's during outburst, although orders of
magnitude less than inferred for both P Cygni and
3 times higher than the current stellar wind, close to the limit
expected for a line-driven wind (Smith & Owocki 2006). An obvious
comparison to make is to LBVs, with W9 having a current mass-loss rate
similar to galactic examples e.g. the Pistol star. Likewise, the
mass-loss rate deduced for the extended nebula is comparable to
several other galactic LBV's during outburst, although orders of
magnitude less than inferred for both P Cygni and  Carinae
during outburst (Clark et al. 2009, and references therein). The
X-ray properties of W9 imply that it is a binary system, although it
is not currently possible to constrain the nature of the companion. An
alternative scenario with significant mass loss in a common envelope
phase of stellar evolution cannot be excluded.
Carinae
during outburst (Clark et al. 2009, and references therein). The
X-ray properties of W9 imply that it is a binary system, although it
is not currently possible to constrain the nature of the companion. An
alternative scenario with significant mass loss in a common envelope
phase of stellar evolution cannot be excluded.
- Surprisingly, three of the >100 evolved OB stars (luminosity classes III-Ia) are detected, with radio fluxes an order of magnitude larger than expected for stellar winds in these types. It is suggested they may be CWBs based on potentially composite spectra of both non-thermal and thermal emission. However, none of the three detected stars exhibit X-ray emission characteristic of CWBs or evidence of RV variations due to a binary companion. Alternatively, their seemingly high radio luminosity may be due the influence of the extended emission in which they are embedded.
- All four RSGs are detected, with three associated with large
nebulae with ionized masses up to 0.26 ,
emphasising
the importance of mass loss in this evolutionary phase. Of these, the
nebulae around W20 and W26 have a pronounced cometary morphology,
suggesting significant interaction with either the intracluster medium
or cluster wind. W237 shows less evidence for such interaction and has
a kinematic age of 3600 yr and a time averaged mass-loss
rate of
 yr-1. This is consistent with other
field RSGs, although it is substantially lower than inferred for
NML Cyg and VY CMa during the formation of their nebulae.
yr-1. This is consistent with other
field RSGs, although it is substantially lower than inferred for
NML Cyg and VY CMa during the formation of their nebulae.
- The YHG W4 is argued to have a stellar wind with a mass-loss
rate of 10-5(
 yr-1, consistent with the few
estimates available for other field YHGs. The extended nebulae
associated with W4, 12a and 265 are significantly less massive than
those associated with the RSGs in Wd 1. It is argued they arise from
quiescent mass loss rather than during outburst episodes.
yr-1, consistent with the few
estimates available for other field YHGs. The extended nebulae
associated with W4, 12a and 265 are significantly less massive than
those associated with the RSGs in Wd 1. It is argued they arise from
quiescent mass loss rather than during outburst episodes.
- Since neither the YHGs nor RSGs are hot enough to ionize their own stellar winds and/or more extended nebulae, the requisite ionizing photons must arise from either an unseen companion or the cluster radiation field.
- Of the extreme B-type hypergiants, only the LBV W243 was
detected, with a spectral index consistent with thermal emission. The
corresponding mass-loss rate is directly comparable to that found for
the YHG W4, as expected given the similarity in current spectral type
and radio flux. Upper limits of
 (
yr-1 for the three other B hypergiants were found, consistent with mass-loss rates amongst field
stars of these types (Leitherer et al. 1995).
(
yr-1 for the three other B hypergiants were found, consistent with mass-loss rates amongst field
stars of these types (Leitherer et al. 1995).
- Five of the 24 WRs known in Wd 1 were detected. Of these, WR L has a partially optically-thick wind, with a mass-loss rate consistent with stars of identical spectral type in the Galactic Centre cluster and the general field population. The remaining three (WR A, B and V) are identified as having composite spectra from a CWB. The optical and X-ray properties of WR A and WR B have previously indicated these to be binaries, while this is the first hint of binarity for WR V.
The rich stellar population of Wd 1 permits us to investigate the
evolution of mass-loss rates as stars evolve from the MS. With the
reduction of O-star mass-loss rates due to wind clumping
(e.g. Repolust et al. 2004), it has been recognised that the
majority of mass loss must occur in the post-MS transitional
phase. While the exact evolutionary sequence through the transitional
``zoo'' is uncertain for stars of
![]() ,
it
is interesting that the radio mass-loss rates directly determined for
the YHG W4, the LBV W243 and the WNLh star WR L, which form a direct
evolutionary sequence in some schemes, are all closely equal to one
another.
,
it
is interesting that the radio mass-loss rates directly determined for
the YHG W4, the LBV W243 and the WNLh star WR L, which form a direct
evolutionary sequence in some schemes, are all closely equal to one
another.
However, with the exception of W9, such mass-loss rates
(![]() 10-5
10-5 ![]() yr-1) are likely insufficient to
remove the H-rich mantle unless stars remain in the transitional phase
for significantly longer than expected. This in turn suggests that an
additional mechanism is required to shed the requisite mass, with
short-lived episodes of greatly enhanced mass loss an obvious
candidate. Indeed mass-loss rates >10-4
yr-1) are likely insufficient to
remove the H-rich mantle unless stars remain in the transitional phase
for significantly longer than expected. This in turn suggests that an
additional mechanism is required to shed the requisite mass, with
short-lived episodes of greatly enhanced mass loss an obvious
candidate. Indeed mass-loss rates >10-4 ![]() yr-1 have
already been inferred for RSGs (e.g. VY CMa; Smith et al. 2001) and
directly observed for the YHG
yr-1 have
already been inferred for RSGs (e.g. VY CMa; Smith et al. 2001) and
directly observed for the YHG ![]() Cas (Lobel et al. 2003). The
nebulae around the RSGs W20, 26 and 236 already indicate that
significant mass loss has occurred for some stars within Wd 1, while
the mass-loss rate inferred for W9, over a magnitude greater than any
other transitional star, is of obvious interest. Indeed, is W9
undergoing an ``eruptive'' event currently?
Cas (Lobel et al. 2003). The
nebulae around the RSGs W20, 26 and 236 already indicate that
significant mass loss has occurred for some stars within Wd 1, while
the mass-loss rate inferred for W9, over a magnitude greater than any
other transitional star, is of obvious interest. Indeed, is W9
undergoing an ``eruptive'' event currently?
We note that both the optical spectrum and spectral energy distribution of W9 indicate that it is not a cool hypergiant, suggesting that extreme mass-loss events are likely not confined to a single evolutionary state, such as RSGs, and instead occur in both hot and cool transitional phases. Indeed long term spectroscopic observations indicate significant instability in the early-B hypergiant/WNVL, RSG and YHG populations (Clark et al. 2010). Hence one may not a priori assume a single physical mechanism leads to enhanced mass loss in post-MS stars. When combined with detailed modeling of the stellar spectra, further observations to derive the nebular properties of cluster members, such as expansion velocity and chemical abundances, would be very valuable in order to constrain the phases in which enhanced mass loss occurs; thus Wd 1 will be invaluable for investigating the physics that mediates the passage of MS O-type stars to the Wolf-Rayet phase.
AcknowledgementsWe thank Paul Crowther, Ben Davies, Simon Goodwin, Rene Oudmaijer, Julian Pittard, Ben Ritchie and Rens Waters for many stimulating discussions related to this work and for providing numerous comments on early versions of the manuscript. A special thanks to Rob Reid for advice on using the SMERF patch to DIFMAP and to Bob Sault for his extensive advise on the use of MIRIAD. The Australia Telescope Compact Array is part of the Australia Telescope which is funded by the Commonwealth of Australia for operation as a National Facility managed by CSIRO. SMD would like to thank the Anton Pannekoek Institute and Open University for their hospitality during a number of visits. JSC is supported by a UK Research Council (RCUK) Fellowship. This research is partially supported by the Spanish Ministerio de Ciencia e Innovación (MICINN) under grants AYA2008-06166-C03-03 and Consolider-GTC CSD2006-70.
Appendix A: Modelling radio emission from a circumstellar envelope
For a spherically symmetric isothermal plasma envelope of temperature T and outer radius
where

for electron temperature
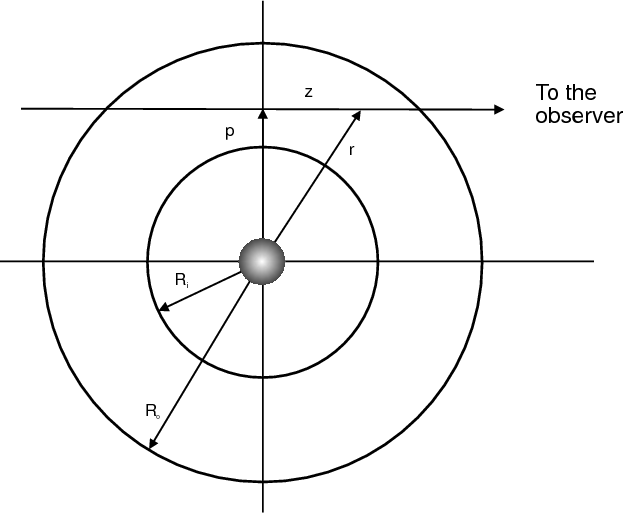
|
Figure A.1:
Geometry of a model circumstellar envelope with outer
radius |
| Open with DEXTER | |
For a steady-state, constant velocity stellar wind of mass-loss rate ![]() and terminal velocity
and terminal velocity ![]() ,
the equation of continuity
requires
,
the equation of continuity
requires
![]() ,
leading to
,
leading to

with
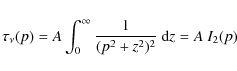
where

Analytic solutions for the integral I2(p) in Eq. (A.2) and the envelope geometry shown in Fig. A.1 can be derived, namely:
![$\displaystyle \frac{1}{2p^2} \left [\frac{(R_{\rm o}^2 - p^2)^{\frac{1}{2}}}{R_{\rm o}^2}
- \frac{(R_{\rm i}^2-p^2)^{\frac{1}{2}}}{R_{\rm i}^2}\right ]$](/articles/aa/full_html/2010/03/aa13505-09/img240.png)
![$\displaystyle +\frac{1}{2p^3}
\left [\tan^{-1}\left (\frac{(R_{\rm o}^2-p^2)^{\...
...t )
- \tan^{-1}\left (\frac{(R_{\rm i}^2-p^2)^{\frac{1}{2}}}{p}\right )\right ]$](/articles/aa/full_html/2010/03/aa13505-09/img241.png)
if
![$\displaystyle I_2(p)
=\frac{1}{2p^3}\left [\frac{p(R_{\rm o}^2-p^2)^{\frac{1}{2...
...^2} +
\tan^{-1}\left (\frac{(R_{\rm o}^2-p^2)^{\frac{1}{2}}}{p}\right )\right ]$](/articles/aa/full_html/2010/03/aa13505-09/img243.png)
if
Determining the flux from an extended nebula at any given frequency
requires using Eq. (A.2) and the two conditional cases
for I2)p) given by Eqs. (A.3)
and (A.4) to determine the opacity along a
particular line-of-sight, before solving Eq. (A.1). To model
the flux from a ``standard'' stellar wind, ![]() is set to the radius
of the underlying star R* (for the models considered here
is set to the radius
of the underlying star R* (for the models considered here
![]() ,
so it is assumed that
,
so it is assumed that
![]() )
and only the conditional
case for I2(p) given in Eq. (A.4) needs to
be considered.
)
and only the conditional
case for I2(p) given in Eq. (A.4) needs to
be considered.
References
- Abbott, D. C., Bieging, J. H., & Churchwell, E. 1981, ApJ, 250, 645 [NASA ADS] [CrossRef] [Google Scholar]
- Benjamin, R. A., Churchwell, E., Babler, B. L., et al. 2003, PASP, 115, 953 [NASA ADS] [CrossRef] [Google Scholar]
- Berghoefer, T. W., Schmitt, J. H. M. M., Danner, R., & Cassinelli, J. P. 1997, A&A, 322, 167 [NASA ADS] [Google Scholar]
- Blöcker, T., Balega, Y., Hofmann, K.-H., et al. 1999, A&A, 348, 805 [NASA ADS] [Google Scholar]
- Blöcker, T., Balega, Y., Hofmann, K.-H., & Weigelt, G. 2001, A&A, 369, 142 [NASA ADS] [CrossRef] [EDP Sciences] [Google Scholar]
- Blundell, K. M., Mioduszewski, A. J., Muxlow, T. W. B., Podsiadlowski, P., & Rupen, M. P. 2001, ApJ, 562, L79 [NASA ADS] [CrossRef] [Google Scholar]
- Bonanos, A. Z. 2007, AJ, 133, 2696 [NASA ADS] [CrossRef] [Google Scholar]
- Borgman, J., Koornneef, J., & Slingerland, J. 1970, A&A, 4, 248 [NASA ADS] [Google Scholar]
- Brandner, W., Clark, J. S., Stolte, A., et al. 2008, A&A, 478, 137 [NASA ADS] [CrossRef] [EDP Sciences] [Google Scholar]
- Cappa, C., Goss, W. M., & van der Hucht, K. A. 2004, AJ, 127, 2885 [NASA ADS] [CrossRef] [Google Scholar]
- Castro-Carrizo, A., Quintana-Lacaci, G., Bujarrabal, V., Neri, R., & Alcolea, J. 2007, A&A, 465, 457 [NASA ADS] [CrossRef] [EDP Sciences] [Google Scholar]
- Chapman, J. M., Leitherer, C., Koribalski, B., Bouter, R., & Storey, M. 1999, ApJ, 518, 890 [NASA ADS] [CrossRef] [Google Scholar]
- Clark, J. S., & Negueruela, I. 2002, A&A, 396, L25 [NASA ADS] [CrossRef] [EDP Sciences] [Google Scholar]
- Clark, J. S., & Porter, J. M. 2004, A&A, 427, 839 [NASA ADS] [CrossRef] [EDP Sciences] [Google Scholar]
- Clark, J. S., Fender, R. P., Waters, L. B. F. M., et al. 1998, MNRAS, 299, L43 [NASA ADS] [CrossRef] [Google Scholar]
- Clark, J. S., Egan, M. P., Crowther, P. A., et al. 2003, A&A, 412, 185 [NASA ADS] [CrossRef] [EDP Sciences] [Google Scholar]
- Clark, J. S., Negueruela, I., Crowther, P. A., & Goodwin, S. P. 2005, A&A, 434, 949 [NASA ADS] [CrossRef] [EDP Sciences] [Google Scholar]
- Clark, J. S., Barnes, A. D., & Charles, P. A. 2007, MNRAS, 380, 263 [NASA ADS] [CrossRef] [Google Scholar]
- Clark, J. S., Muno, M. P., Negueruela, I., et al. 2008, A&A, 477, 147 [NASA ADS] [CrossRef] [EDP Sciences] [Google Scholar]
- Clark, J. S., Crowther, P. A., Larionov, V. M., et al. 2009, A&A, 507, 1555 [NASA ADS] [CrossRef] [EDP Sciences] [Google Scholar]
- Clark, J. S., Ritchie, B. W., & Negueruela, I. 2010, A&A, accepted [Google Scholar]
- Corcoran, M. F. 2008, in Rev. Mex. Astron. Astrofis. Conf. Ser., 33, 123 [Google Scholar]
- Crowther, P. A., Hadfield, L. J., Clark, J. S., Negueruela, I., & Vacca, W. D. 2006, MNRAS, 372, 1407 [NASA ADS] [CrossRef] [Google Scholar]
- de Jager, C. 1998, A&A Rev., 8, 145 [Google Scholar]
- de Martino, D., Vittone, A. A., Rossi, C., & Giovannelli, F. 1992, A&A, 254, 266 [NASA ADS] [Google Scholar]
- de Wit, W. J., Oudmaijer, R. D., Fujiyoshi, T., et al. 2008, ApJ, 685, L75 [NASA ADS] [CrossRef] [Google Scholar]
- Dougherty, S. M., & Williams, P. M. 2000, MNRAS, 319, 1005 [NASA ADS] [CrossRef] [Google Scholar]
- Dougherty, S. M., Beasley, A. J., Claussen, M. J., Zauderer, B. A., & Bolingbroke, N. J. 2005, ApJ, 623, 447 [NASA ADS] [CrossRef] [Google Scholar]
- Duncan, R. A., & White, S. M. 2002, MNRAS, 330, 63 [NASA ADS] [CrossRef] [Google Scholar]
- Fullerton, A. W., Massa, D. L., & Prinja, R. K. 2006, ApJ, 637, 1025 [NASA ADS] [CrossRef] [Google Scholar]
- Gehrz, R. D., Hayward, T. L., Houck, J. R., et al. 1995, ApJ, 439, 417 [NASA ADS] [CrossRef] [Google Scholar]
- Groh, J. H., Damineli, A., Teodoro, M., & Barbosa, C. L. 2006, A&A, 457, 591 [NASA ADS] [CrossRef] [EDP Sciences] [Google Scholar]
- Groh, J. H., Hillier, D. J., Damineli, A., et al. 2009, ApJ, 698, 1698 [NASA ADS] [CrossRef] [Google Scholar]
- Higgs, L. A., Feldman, P. A., & Smolinski, J. 1978, ApJ, 220, L109 [NASA ADS] [CrossRef] [Google Scholar]
- Hoare, M. G., Kurtz, S. E., Lizano, S., Keto, E., & Hofner, P. 2007, in Protostars and Planets V, ed. B. Reipurth, D. Jewitt, & K. Keil, 181 [Google Scholar]
- Ignace, R., & Churchwell, E. 2004, ApJ, 610, 351 [NASA ADS] [CrossRef] [Google Scholar]
- Israelian, G., Lobel, A., & Schmidt, M. R. 1999, ApJ, 523, L145 [NASA ADS] [CrossRef] [Google Scholar]
- Jura, M., & Kleinmann, S. G. 1990, ApJS, 73, 769 [NASA ADS] [CrossRef] [Google Scholar]
- Kothes, R., & Dougherty, S. M. 2007, A&A, 468, 993 [NASA ADS] [CrossRef] [EDP Sciences] [Google Scholar]
- Lang, C. C. 2003, IAU Symp., ed. K. van der Hucht, A. Herrero, & C. Esteban, 497 [Google Scholar]
- Leitherer, C., & Robert, C. 1991, ApJ, 377, 629 [NASA ADS] [CrossRef] [Google Scholar]
- Leitherer, C., Chapman, J. M., & Koribalski, B. 1995, ApJ, 450, 289 [NASA ADS] [CrossRef] [Google Scholar]
- Leitherer, C., Chapman, J. M., & Koribalski, B. 1997, ApJ, 481, 898 [NASA ADS] [CrossRef] [Google Scholar]
- Lobel, A., Israelian, G., de Jager, C., et al. 1998, A&A, 330, 659 [NASA ADS] [Google Scholar]
- Lobel, A., Dupree, A. K., Stefanik, R. P., et al. 2003, ApJ, 583, 923 [NASA ADS] [CrossRef] [Google Scholar]
- Martins, F., Schaerer, D., Hillier, D. J., et al. 2005, A&A, 441, 735 [NASA ADS] [CrossRef] [EDP Sciences] [Google Scholar]
- Martins, F., Genzel, R., Hillier, D. J., et al. 2007, A&A, 468, 233 [NASA ADS] [CrossRef] [EDP Sciences] [Google Scholar]
- Mengel, S., & Tacconi-Garman, L. E. 2007, A&A, 466, 151 [NASA ADS] [CrossRef] [EDP Sciences] [Google Scholar]
- Moffat, A. F. J., Corcoran, M. F., Stevens, I. R., et al. 2002, ApJ, 573, 191 [NASA ADS] [CrossRef] [Google Scholar]
- Mokiem, M. R., de Koter, A., Vink, J. S., et al. 2007, A&A, 473, 603 [NASA ADS] [CrossRef] [EDP Sciences] [Google Scholar]
- Monnier, J. D., Tuthill, P. G., & Danchi, W. C. 1999, ApJ, 525, L97 [NASA ADS] [CrossRef] [PubMed] [Google Scholar]
- Morris, M., & Jura, M. 1983, ApJ, 267, 179 [NASA ADS] [CrossRef] [Google Scholar]
- Muno, M. P., Clark, J. S., Crowther, P. A., et al. 2006a, ApJ, 636, L41 [NASA ADS] [CrossRef] [Google Scholar]
- Muno, M. P., Law, C., Clark, J. S., et al. 2006b, ApJ, 650, 203 [NASA ADS] [CrossRef] [Google Scholar]
- Najarro, F., Figer, D. F., Hillier, D. J., Geballe, T. R., & Kudritzki, R. P. 2009, ApJ, 691, 1816 [NASA ADS] [CrossRef] [Google Scholar]
- Negueruela, I., & Clark, J. S. 2005, A&A, 436, 541 [NASA ADS] [CrossRef] [EDP Sciences] [Google Scholar]
- Negueruela, I., Clark, J. S., & Ritchie, B. W. 2010, A&A, submitted [Google Scholar]
- Oudmaijer, R. D., Davies, B., de Wit, W., & Patel, M. 2009, ed. D. G. Luttermoser, B. J. Smith, & R. E. Stencel, ASP Conf. Ser., 412, 17 [Google Scholar]
- Oudmaijer, R. D., Groenewegen, M. A. T., Matthews, H. E., Blommaert, J. A. D. L., & Sahu, K. C. 1996, MNRAS, 280, 1062 [NASA ADS] [CrossRef] [Google Scholar]
- Patel, M., Oudmaijer, R. D., Vink, J. S., et al. 2008, MNRAS, 385, 967 [NASA ADS] [CrossRef] [Google Scholar]
- Pittard, J. M. 2009, MNRAS, 396, 1743 [NASA ADS] [CrossRef] [Google Scholar]
- Pittard, J. M., Dougherty, S. M., Coker, R. F., O'Connor, E., & Bolingbroke, N. J. 2006, A&A, 446, 1001 [NASA ADS] [CrossRef] [EDP Sciences] [Google Scholar]
- Pittard, J. M., & Parkin, E. R. 2009, MNRAS, accepted [arXiv:0909.4383] [Google Scholar]
- Povich, M. S., Stone, J. M., Churchwell, E., et al. 2007, ApJ, 660, 346 [NASA ADS] [CrossRef] [Google Scholar]
- Reid, R. I. 2006, MNRAS, 367, 1766 [NASA ADS] [CrossRef] [Google Scholar]
- Repolust, T., Puls, J., & Herrero, A. 2004, A&A, 415, 349 [NASA ADS] [CrossRef] [EDP Sciences] [Google Scholar]
- Ritchie, B. W., Clark, J. S., Negueruela, I., & Crowther, P. A. 2009a, A&A, 507, 1585 [NASA ADS] [CrossRef] [EDP Sciences] [Google Scholar]
- Ritchie, B. W., Clark, J. S., Negueruela, I., & Najarro, F. 2009b, A&A, 507, 1597 [NASA ADS] [CrossRef] [EDP Sciences] [Google Scholar]
- Ritchie, B. W., Clark, J. S., & Negueruela, I. 2010, A&A, submitted [Google Scholar]
- Rybicki, G. B., & Lightman, A. P. 1986, Radiative Processes in Astrophysics, ed. G. B. Rybicki, & A. P. Lightman [Google Scholar]
- Sault, R. J., Teuben, P. J., & Wright, M. C. H. 1995, in Astronomical Data Analysis Software and Systems IV, ASP Conf. Ser., 77, 433 [Google Scholar]
- Schuster, M. T., Humphreys, R. M., & Marengo, M. 2006, AJ, 131, 603 [NASA ADS] [CrossRef] [Google Scholar]
- Serabyn, E., Lacy, J. H., & Achtermann, J. M. 1991, ApJ, 378, 557 [NASA ADS] [CrossRef] [Google Scholar]
- Setia Gunawan, D. Y. A., Chapman, J. M., Stevens, I. R., Rauw, G., & Leitherer, C. 2003, ed. K. van der Hucht, A. Herrero, & C. Esteban, IAU Symp., 230 [Google Scholar]
- Shepherd, M. C. 1997, in Astronomical Data Analysis Software and Systems VI, ASP Conf. Ser., 125, 77 [Google Scholar]
- Skinner, S. L., Simmons, A. E., Zhekov, S. A., et al. 2006, ApJ, 639, L35 [NASA ADS] [CrossRef] [Google Scholar]
- Smith, N., & Owocki, S. P. 2006, ApJ, 645, L45 [NASA ADS] [CrossRef] [Google Scholar]
- Smith, N., Humphreys, R. M., Davidson, K., et al. 2001, AJ, 121, 1111 [NASA ADS] [CrossRef] [Google Scholar]
- Stahl, O., Wolf, B., Aab, O., & Smolinski, J. 1991, A&A, 252, 693 [NASA ADS] [Google Scholar]
- Stevens, I. R., Blondin, J. M., & Pollock, A. M. T. 1992, ApJ, 386, 265 [NASA ADS] [CrossRef] [Google Scholar]
- Stickland, D. J., & Harmer, D. L. 1978, A&A, 70, L53 [NASA ADS] [Google Scholar]
- Sylvester, R. J., Skinner, C. J., & Barlow, M. J. 1998, MNRAS, 301, 1083 [NASA ADS] [CrossRef] [Google Scholar]
- Tafoya, D., Gómez, Y., & Rodríguez, L. F. 2004, ApJ, 610, 827 [NASA ADS] [CrossRef] [Google Scholar]
- Taylor, A. R., Pottasch, S. R., & Zhang, C. Y. 1987, A&A, 171, 178 [NASA ADS] [Google Scholar]
- Tuthill, P. G., Monnier, J. D., & Danchi, W. C. 1999, Nature, 398, 487 [NASA ADS] [CrossRef] [Google Scholar]
- van der Hucht, K. A., Schrijver, H., Stenholm, B., et al. 1997, New Astron., 2, 245 [NASA ADS] [CrossRef] [Google Scholar]
- van Loo, S., Runacres, M. C., & Blomme, R. 2006, A&A, 452, 1011 [NASA ADS] [CrossRef] [EDP Sciences] [Google Scholar]
- Voors, R. H. M., Waters, L. B. F. M., de Koter, A., et al. 2000, A&A, 356, 501 [NASA ADS] [Google Scholar]
- Watson, C., Povich, M. S., Churchwell, E. B., et al. 2008, ApJ, 681, 1341 [NASA ADS] [CrossRef] [Google Scholar]
- Westerlund, B. 1961, PASP, 73, 51 [NASA ADS] [CrossRef] [Google Scholar]
- Westerlund, B. E. 1987, A&AS, 70, 311 [Google Scholar]
- Westmoquette, M. S., Exter, K. M., Smith, L. J., & Gallagher, J. S. 2007, MNRAS, 381, 894 [NASA ADS] [CrossRef] [Google Scholar]
- Williams, P. M. 1999, in Wolf-Rayet Phenomena in Massive Stars and Starburst Galaxies, ed. K. A. van der Hucht, G. Koenigsberger, & P. R. J. Eenens, IAU Symp., 193, 267 [Google Scholar]
- Williams, P. M., Dougherty, S. M., Davis, R. J., et al. 1997, MNRAS, 289, 10 [NASA ADS] [Google Scholar]
- Williams, P. M., Marchenko, S. V., Marston, A. P., et al. 2009, MNRAS, 395, 1749 [NASA ADS] [CrossRef] [Google Scholar]
- Yusef-Zadeh, F., & Morris, M. 1991, ApJ, 371, L59 [NASA ADS] [CrossRef] [Google Scholar]
Footnotes
- ...
luminous
![[*]](/icons/foot_motif.png)
- In the absence of a bolometric correction for W9
adopting a comparable luminosity to the cool hypergiants - appropriate
considering post-MS evolution is expected to proceed at constant
bolometric evolution prior to the WR phase - suggests
log (
 ) 5.8.
- ...
)
- Note that we include implicitly the mid-B supergiants such as W70, 71 and 57 here, while deferring discussion of the more luminous, and likely more evolved, B hypergiants W7, 13, 33 42a and 243 to Sect. 4.4.
- ...
envelope
- p is often referred to as the ``impact parameter''.
All Tables
Table 1: Fluxes determined for the phase-reference 1657-56.
Table 2: Characteristics of stellar radio sources in the Wd 1 cluster.
Table 3: Number of radio emitters of given spectral type.
Table 4: Properties of the extended radio emission regions in the cluster centre.
Table 5: Best-fit parameters of the r-2 shell model applied to the continuum spectra of the compact and extended radio components of W9.
Table 6: Ionized mass estimates for the optically-thin stellar nebulae around the YHGs (top panel) and RSGs (bottom panel) in Wd 1.
All Figures
|
|
Figure 1:
The ATCA observations of Wd 1 at 8.6 GHz ( upper left),
4.8 GHz ( upper right), 2.5 GHz ( lower left) and 1.4 GHz ( lower right). In each image, contour levels are
-3, 3, 6, 12, 24, 48, 96, |
| Open with DEXTER | |
| In the text | |
|
|
Figure 2:
8.6-GHz image overlaid on a FORS R-band image. The
limiting magnitude of the R-band image is
|
| Open with DEXTER | |
| In the text | |
|
|
Figure 3:
The spectral indices of the stellar radio sources in Wd 1,
identified by their Westerlund numbers. The canonical spectral
indices for partially optically thick thermal emission from a stellar
wind (+0.6) and optically thin thermal emission (-0.1) are
highlighted by the dashed and dotted lines. Error bars are 1
sigma. The arrows denote lower limits to the derived spectral
index. Radio sources offset from potential optical counterparts by
more than 0.6
|
| Open with DEXTER | |
| In the text | |
|
|
Figure 4:
Comparison of radio emission at 8.6 (green) and 4.8-GHz
(red) observations with |
| Open with DEXTER | |
| In the text | |
|
|
Figure 5: Model fits to the continuum spectra of the unresolved partially-thick stellar wind ( top) and extended, optically-thin ( bottom) components of W9. The solid lines represent the best-fit model when the stellar wind outer radius/extended inner radii are constrained to be identical (Model 3). The dotted spectra are the best-fit models when the stellar wind outer radius and extended region inner radius are free parameters (Models 1 and 2). |
| Open with DEXTER | |
| In the text | |
|
|
Figure A.1:
Geometry of a model circumstellar envelope with outer
radius |
| Open with DEXTER | |
| In the text | |
Copyright ESO 2010
Current usage metrics show cumulative count of Article Views (full-text article views including HTML views, PDF and ePub downloads, according to the available data) and Abstracts Views on Vision4Press platform.
Data correspond to usage on the plateform after 2015. The current usage metrics is available 48-96 hours after online publication and is updated daily on week days.
Initial download of the metrics may take a while.