| Issue |
A&A
Volume 510, February 2010
|
|
|---|---|---|
| Article Number | A91 | |
| Number of page(s) | 12 | |
| Section | Stellar structure and evolution | |
| DOI | https://doi.org/10.1051/0004-6361/200913700 | |
| Published online | 17 February 2010 | |
Absolute dimensions of eclipsing binaries![[*]](/icons/foot_motif.png)
XXVII. V1130 Tauri: a metal-weak
F-type system, perhaps with preference for Y =
0.23-0.24
J. V. Clausen1 - E. H. Olsen1 - B. E. Helt1 - A. Claret2
1 - Niels Bohr Institute, Copenhagen University,
Juliane Maries Vej 30,
2100 Copenhagen Ø, Denmark
2 - Instituto de Astrofísica de Andalucía, CSIC,
Apartado 3004, 18080 Granada, Spain
Received 19 November 2009 / Accepted 4
December 2009
Abstract
Context. Double-lined, detached eclipsing binaries
are our main source for accurate stellar masses and radii. This paper
is the first in a series with focus on the upper half of the
main-sequence band and tests of 1-2 ![]() evolutionary models.
evolutionary models.
Aims. We aim to determine absolute dimensions and
abundances for the detached eclipsing binary V1130 Tau, and to
perform a detailed comparison with results from recent stellar
evolutionary models.
Methods. uvby light curves and ![]() standard photometry have been obtained with the Strömgren Automatic
Telescope, and high-resolution spectra have been acquired at the FEROS
spectrograph; both are ESO, La Silla facilities. We have applied the
Wilson-Devinney model for the photometric analysis, spectroscopic
elements are based on radial velocities measured via broadening
functions, and
standard photometry have been obtained with the Strömgren Automatic
Telescope, and high-resolution spectra have been acquired at the FEROS
spectrograph; both are ESO, La Silla facilities. We have applied the
Wilson-Devinney model for the photometric analysis, spectroscopic
elements are based on radial velocities measured via broadening
functions, and ![]() abundances have been determined from synthetic spectra and uvby calibrations.
abundances have been determined from synthetic spectra and uvby calibrations.
Results. V1130 Tau is a bright (
mV
= 6.56), nearby (![]() pc)
detached system with a circular orbit (
pc)
detached system with a circular orbit (
![]() ).
The components are deformed with filling factors above 0.9.
Their masses and radii have been established to 0.6-0.7%. We derive a
).
The components are deformed with filling factors above 0.9.
Their masses and radii have been established to 0.6-0.7%. We derive a
![]() abundance
of
abundance
of ![]() .
The measured rotational velocities,
.
The measured rotational velocities,
![]() (primary) and
(primary) and
![]() (secondary) km s-1,
are in
fair agreement with synchronization. The larger 1.39
(secondary) km s-1,
are in
fair agreement with synchronization. The larger 1.39 ![]() secondary component has evolved to the middle of the main-sequence band
and is slightly cooler than the 1.31
secondary component has evolved to the middle of the main-sequence band
and is slightly cooler than the 1.31 ![]() primary. Yonsai-Yale, BaSTI, and Granada evolutionary models for the
observed metal abundance and a ``normal'' He content of
Y
= 0.25-0.26, marginally reproduce the components at ages
between 1.8 and 2.1 Gyr. All such models are,
however, systematically about 200 K hotter than observed and
predict ages for the more massive component, which are systematically
higher than for the less massive component. These trends can not be
removed by adjusting the amount of core overshoot or envelope
convection level, or by including rotation in the model calculations.
They may be due to proximity effects in V1130 Tau, but on the
other hand, we find excellent agreement for 2.5-2.8 Gyr
Granada models with a slightly lower Y of
0.23-0.24.
primary. Yonsai-Yale, BaSTI, and Granada evolutionary models for the
observed metal abundance and a ``normal'' He content of
Y
= 0.25-0.26, marginally reproduce the components at ages
between 1.8 and 2.1 Gyr. All such models are,
however, systematically about 200 K hotter than observed and
predict ages for the more massive component, which are systematically
higher than for the less massive component. These trends can not be
removed by adjusting the amount of core overshoot or envelope
convection level, or by including rotation in the model calculations.
They may be due to proximity effects in V1130 Tau, but on the
other hand, we find excellent agreement for 2.5-2.8 Gyr
Granada models with a slightly lower Y of
0.23-0.24.
Conclusions. V1130 Tau is a valuable
addition to the very few well-studied 1-2 ![]() binaries with component(s) in the upper half of the main-sequence band,
or beyond. The stars are not evolved enough to provide new information
on the dependence of core overshoot on mass (and abundance), but might
- together with a larger sample of well-detached systems - be useful
for further tuning of the helium enrichment law. Analyses of such
systems are in progress.
binaries with component(s) in the upper half of the main-sequence band,
or beyond. The stars are not evolved enough to provide new information
on the dependence of core overshoot on mass (and abundance), but might
- together with a larger sample of well-detached systems - be useful
for further tuning of the helium enrichment law. Analyses of such
systems are in progress.
Key words: stars: evolution - stars: fundamental parameters - stars: individual: V1130 Tau - binaries: eclipsing - techniques: photometric - techniques: radial velocities
1 Introduction
In this paper, we present the first detailed study of the
bright (
mV
= 6.56), early F-type, double-lined eclipsing binary
V1130 Tau.
The orbital period is short (
![]() ),
but the system is
still detached, and for several reasons it is an interesting case.
First, it is more evolved than most of the well studied early F-type
main sequence systems; actually the more massive, larger component has
become the slightly cooler one. Next, it is reported to be metal-weak.
Finally, it is situated at a distance of only 71 pc, meaning
that it belongs to the (small) group of eclipsing binaries within
125 pc,
discussed by Popper (1998),
which could be useful for improving the
radiative flux scale.
),
but the system is
still detached, and for several reasons it is an interesting case.
First, it is more evolved than most of the well studied early F-type
main sequence systems; actually the more massive, larger component has
become the slightly cooler one. Next, it is reported to be metal-weak.
Finally, it is situated at a distance of only 71 pc, meaning
that it belongs to the (small) group of eclipsing binaries within
125 pc,
discussed by Popper (1998),
which could be useful for improving the
radiative flux scale.
In the following, we determine absolute dimensions and abundances, based on analyses of new uvby light curves and high-resolution spectra, and compare V1130 Tau to several modern stellar evolutionary models. Throughout the paper, the component eclipsed at the slightly deeper eclipse at phase 0.0 is referred to as the primary (p), and the other as the secondary (s) component.
Table 1: Photometric data for V1130 Tau and the comparison stars.
2 V1130 Tau
HD 24133 (CSV 356, HIP 17988) was confirmed
to be variable by Olsen
(1983). Based
on the uvby photometry, Olsen supplied Abt with a
list
containing about 800 potentially weak-lined
A5-G0 stars, and Abt (1986)
subsequently classified HD 24133 as F3 V wl
(A5 met) and also reported it
to be a double-lined spectroscopic binary.
Gray (1989)
classified HD 24133 as F5 V m-2, Gray
& Garrison
1989)
confirmed that its metal lines have the strength
of an A5 star, and Gray et al. (2001) found it to be
a fairly rapid rotator, but clearly metal-weak. The eclipsing nature
was discovered by Hipparcos (ESA 1997;
orbital period
![]() ),
and HD 24133 was subsequently
assigned the variable name V1130 Tau (Kazarovets
et al. 1999).
Rucinski et al. (2003)
determined a spectroscopic orbit,
leading to
),
and HD 24133 was subsequently
assigned the variable name V1130 Tau (Kazarovets
et al. 1999).
Rucinski et al. (2003)
determined a spectroscopic orbit,
leading to
![]()
![]() ,
and noted that V1130 Tau is one of the shortest period
detached early F-type systems.
Besides a few times of minima, nothing has been published on this
binary since then.
,
and noted that V1130 Tau is one of the shortest period
detached early F-type systems.
Besides a few times of minima, nothing has been published on this
binary since then.
3 Photometry
Below, we present the new photometric material for V1130 Tau and refer to Clausen et al. (2001, hereafter CHO01) for further details on observation and reduction procedures, and determination of times of minima.
3.1 Light curves for V1130 Tau
![\begin{figure}
\par\includegraphics[width=15.5cm,clip]{13700f1.ps}
\end{figure}](/articles/aa/full_html/2010/02/aa13700-09/img14.png)
|
Figure 1: y light curve and b-y and u-b colour curves (instrumental system) for V1130 Tau. |
| Open with DEXTER | |
The differential uvby light curves of
V1130 Tau were observed at the
Strömgren Automatic Telescope (SAT) at ESO, La Silla
and its 6-channel ![]() photometer on 59 nights between
October 1997 and November 1998
(JD 2 450 727-2 451 120).
They contain 583 points per band with all phases covered at
least twice.
The observations were done through an 18 arcsec diameter
circular
diaphragm at airmasses between 1.2 and 1.8.
HD 23503, HD 24552, and
HD 25059 -
all within a few degrees from V1130 Tau on the sky - were used
as
comparison stars and were all found to be constant within a few mmag;
see Table 1.
The light curves were calculated relative to HD 23503, but all
comparison
star observations were used, shifting them first to the same light
level.
The average accuracy per point is about 4-5 mmag (ybv)
and 7 mmag (u).
photometer on 59 nights between
October 1997 and November 1998
(JD 2 450 727-2 451 120).
They contain 583 points per band with all phases covered at
least twice.
The observations were done through an 18 arcsec diameter
circular
diaphragm at airmasses between 1.2 and 1.8.
HD 23503, HD 24552, and
HD 25059 -
all within a few degrees from V1130 Tau on the sky - were used
as
comparison stars and were all found to be constant within a few mmag;
see Table 1.
The light curves were calculated relative to HD 23503, but all
comparison
star observations were used, shifting them first to the same light
level.
The average accuracy per point is about 4-5 mmag (ybv)
and 7 mmag (u).
As seen from Fig. 1, V1130 Tau is detached but fairly close, with y eclipse depths of about 0.4 mag. Primary eclipse is only marginally deeper than secondary, meaning that the surface fluxes of the components are nearly identical. The light curves (Table 11) will only be available in electronic form at the CDS.
Table 2: Times of primary (P) and secondary (S) minima of V1130Tau determined from the uvby observations.
3.2 Standard photometry for V1130 Tau
Standard ![]() indices for V1130 Tau (between eclipses) and the three
comparison stars,
observed and derived as described by CHO01, are presented in
Table 1.
The indices are based on many
observations and their precision is high.
For comparison, we have included published photometry from
other sources. In general, the agreement is good, but individual
differences larger than the quoted errors occur.
indices for V1130 Tau (between eclipses) and the three
comparison stars,
observed and derived as described by CHO01, are presented in
Table 1.
The indices are based on many
observations and their precision is high.
For comparison, we have included published photometry from
other sources. In general, the agreement is good, but individual
differences larger than the quoted errors occur.
3.3 Times of minima and ephemeris for V1130 Tau
Three times of each of primary and secondary minimum have been
established
from the uvby light curve observations; see
Table 2.
A list of earlier times of minima was kindly provided by
Kreiner; see Kreiner et al. (2001) and
Kreiner (2004)![]() .
Except for two unpublished times based on Hipparcos photometry,
which showed large deviations, they were included in the ephemeris
analysis together with the recently published time of primary minimum
by
Brat et al. (2008).
.
Except for two unpublished times based on Hipparcos photometry,
which showed large deviations, they were included in the ephemeris
analysis together with the recently published time of primary minimum
by
Brat et al. (2008).
Assuming a circular orbit, we derive the following linear
ephemeris
from a weighted least squares fit to all accepted times of minima:
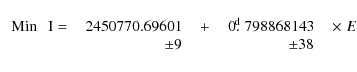
Separate weighted linear least squares fits to the times of primary and secondary minima lead to identical orbital periods, and we adopt Eq. (1) for the analyses of the uvby light curves and radial velocities.
3.4 Photometric elements
Since the relative radii of the components of V1130 Tau are
fairly large,
0.25-0.30, we have adopted the Wilson-Devinney model (Wilson &
Devinney 1971;
Wilson 1979,1990,1993; Van Hamme
& Wilson 2003)
for the light curve analyses. We have used the JKTWD code
developed by J. Southworth![]() ,
which is based on the 2003 version of the ``Binary Star Observables
Program''
by Wilson et al.
,
which is based on the 2003 version of the ``Binary Star Observables
Program''
by Wilson et al.![]() This code was recently applied for the light curve
analyses of DW Car (Southworth & Clausen 2007)
and V380 Cyg (Pavlovski et al. 2009).
This code was recently applied for the light curve
analyses of DW Car (Southworth & Clausen 2007)
and V380 Cyg (Pavlovski et al. 2009).
Mode 2 (detached binaries) was used throughout, and the
stellar atmosphere approximation functions for the uvby bands
were adopted (Van Hamme & Wilson 2003; Kurucz 1993). The effective
temperature of the primary component was kept
at 6500 K; see Sect. 6.
A linear limb darkening law was assumed with coefficients
adopted from Van Hamme (1993).
The linear coefficients by Claret (2000)
are about 0.1 larger
and lead to a ![]() lower orbital inclination, whereas the radii are practically unchanged.
Within errors, non-linear limb darkening lead to identical photometric
elements. Gravity darkening exponents corresponding to convective
atmospheres were applied, and bolometric reflection albedo coefficients
of 0.5 were chosen, again due to convection. The simple
reflection mode
(MREF = 1) was used; we note that the detailed mode
gives nearly identical elements.
The mass ratio between the components was kept at the spectroscopic
value
(
lower orbital inclination, whereas the radii are practically unchanged.
Within errors, non-linear limb darkening lead to identical photometric
elements. Gravity darkening exponents corresponding to convective
atmospheres were applied, and bolometric reflection albedo coefficients
of 0.5 were chosen, again due to convection. The simple
reflection mode
(MREF = 1) was used; we note that the detailed mode
gives nearly identical elements.
The mass ratio between the components was kept at the spectroscopic
value
(
![]() ),
and synchronous rotation was assumed.
The light curves were analysed independently with at least 10
differential parameter corrections, and continuing until they were
below 20% of the corresponding formal standard errors for all
parameters. The stability of the adopted solutions was tested by adding
100 more iterations.
),
and synchronous rotation was assumed.
The light curves were analysed independently with at least 10
differential parameter corrections, and continuing until they were
below 20% of the corresponding formal standard errors for all
parameters. The stability of the adopted solutions was tested by adding
100 more iterations.
In tables and text, we use the following symbols:
i orbital inclination;
r relative volume radius;
![]() ;
;
![]() surface potential;
u linear limb darkening coefficient;
L luminosity;
surface potential;
u linear limb darkening coefficient;
L luminosity;
![]() effective temperature.
effective temperature.
The individual solutions are presented in Table 3,
and ![]() residuals of the b observations from the
theoretical light curve are shown in Fig. 2. Equally
good
fits are obtained in the three other bands, and the rms of the
residuals
correspond closely to the observational accuracy.
As expected, the less massive, slightly hotter primary component is
also the smaller one. V1130 Tau is detached, but the filling
factors of the components are above 0.9,
and the deformation of the secondary component is significant.
The relative volume radii obtained from the four
bands agree well, except perhaps for the less precise u
result for the primary. We find no evidence of third light, neither in
the spectra nor from
the light curve solutions, and the small differences in orbital
inclinations are probably due to model and/or limb darkening effects.
The adopted photometric elements are listed in Table 4
with realistic uncertainties, which reflect the formal standard errors
and
the interagreement of the uvby results,
and also take into account the consequences of
residuals of the b observations from the
theoretical light curve are shown in Fig. 2. Equally
good
fits are obtained in the three other bands, and the rms of the
residuals
correspond closely to the observational accuracy.
As expected, the less massive, slightly hotter primary component is
also the smaller one. V1130 Tau is detached, but the filling
factors of the components are above 0.9,
and the deformation of the secondary component is significant.
The relative volume radii obtained from the four
bands agree well, except perhaps for the less precise u
result for the primary. We find no evidence of third light, neither in
the spectra nor from
the light curve solutions, and the small differences in orbital
inclinations are probably due to model and/or limb darkening effects.
The adopted photometric elements are listed in Table 4
with realistic uncertainties, which reflect the formal standard errors
and
the interagreement of the uvby results,
and also take into account the consequences of ![]() 0.1 changes of limb darkening
coefficients and the uncertainly of the mass ratio. As seen, the
relative volume radii have been established to about 0.6%.
0.1 changes of limb darkening
coefficients and the uncertainly of the mass ratio. As seen, the
relative volume radii have been established to about 0.6%.
Table 3: Photometric solutions for V1130 Tau.
![\begin{figure}
\par\includegraphics[width=8.8cm,clip]{13700f2.ps}
\end{figure}](/articles/aa/full_html/2010/02/aa13700-09/img33.png)
|
Figure 2:
(
|
| Open with DEXTER | |
4 Spectroscopy
4.1 Spectroscopic observations
For radial velocity and abundance determinations, we have obtained
18 high-resolution spectra with the FEROS fiber echelle
spectrograph at the ESO 1.52-m telescope at La Silla, Chile
(Kaufer et al. 1999,
2000).
The spectrograph, which resides in a temperature-controlled room,
covers without interruption the spectral region from the Balmer jump
to 8700 Å, at a constant velocity resolution of
2.7 km s-1 per pixel (
![]() ).
We refer to Clausen et al. (2008,
hereafter CTB08) for details on the reduction of the spectra, which
were observed between January 1999 and March 2001; an observing log is
given in Table 5.
).
We refer to Clausen et al. (2008,
hereafter CTB08) for details on the reduction of the spectra, which
were observed between January 1999 and March 2001; an observing log is
given in Table 5.
4.2 Radial velocities
The radial velocities for V1130 Tau were measured from eight
useful orders
(4020-5210 Å) of the 18 FEROS spectra, see Table 6.
The selection of this limited number of orders was based on initial
analyses, which showed that several orders give unreliable results and
have to be excluded, either because too few lines are available, or
because they contain defects or
are difficult to normalise properly.
We applied the broadening function (BF) formalism (Rucinski 1999,2002,2004),
using synthetic templates with no rotational broadening, calculated for
![]() K, log(g) = 4.0,
and
K, log(g) = 4.0,
and ![]() = -0.25.
They were produced with the bssynth tool (Bruntt,
private
communication), which applies the SYNTH software (Valenti &
Piskunov
1996) and
modified ATLAS9 models (Heiter 2002).
Line information was taken from the Vienna Atomic Line Database (VALD;
Kupka et al. 1999).
BF's were then produced for each of the selected orders of each
spectrum.
= -0.25.
They were produced with the bssynth tool (Bruntt,
private
communication), which applies the SYNTH software (Valenti &
Piskunov
1996) and
modified ATLAS9 models (Heiter 2002).
Line information was taken from the Vienna Atomic Line Database (VALD;
Kupka et al. 1999).
BF's were then produced for each of the selected orders of each
spectrum.
Table 4: Adopted photometric elements for V1130 Tau.
Table 5: Log of the FEROS observations of V1130 Tau.
Table 6: Echelle orders and wavelength ranges used for the radial velocity measurements of V1130 Tau.
Due to the deformation of the components (Table 4) and to reflection effects, the lineprofiles and thereby the BF's can not a priori be expected to be symmetric. The optimum method for radial velocity determinations is therefore to fit theoretical BF's which take the proximity effects into account; for W UMa systems, see e.g. Rucinski et al. (1993) and references therein. Such BF's were constructed, for both components at each phase and order, from synthetic rotational broadened line profiles calculated via the Wilson-Devinney (WD) model (Sect. 3.4). The radial velocities were then determined by fitting combined theoretical BF's to the observed ones, i.e. by shifting and scaling the theoretical BF's for each component until the best fit was obtained for the combination.
Since the observed BF's do not show clear asymmetries, we have also applied an approach based on simpler theoretical BF's, which assume that the stars are spherical, rigid rotators (e.g. Kaluzny et al. 2006). Before the radial velocity determination, these BF's were convolved with a Gauss profile corresponding to the instrumental resolution. In general, very good fits were obtained from this approach; see Fig. 3.
In the case of V1130 Tau, the two BF approaches result in radial velocities for all spectral orders and phases, which agree within about 1-2 km s-1, and the differences do not correlate with orbital phase and/or velocity separation. In Sect. 4.3 we present orbital solutions from both sets of radial velocities.
As described by e.g. Kaluzny et al. (2006), the projected
rotational
velocities ![]() of the components and (monochromatic)
light/luminosity ratios between them can also be obtained from analyses
of the simple broadening functions mentioned above. We have tested this
on synthetic binary spectra with input rotational velocities
of 90.0 (primary) and 110.0
(secondary) km s-1,
corresponding closely to synchronous rotation,
and a light ratio of 1.44, and we find that the method is safe
for V1130 Tau.
The rotational velocities determined from the BF analyses are within
1 km s-1
from the input values, and the light ratio is reproduced to high
precision. Analyses of the observed V1130 Tau spectra
yield mean
of the components and (monochromatic)
light/luminosity ratios between them can also be obtained from analyses
of the simple broadening functions mentioned above. We have tested this
on synthetic binary spectra with input rotational velocities
of 90.0 (primary) and 110.0
(secondary) km s-1,
corresponding closely to synchronous rotation,
and a light ratio of 1.44, and we find that the method is safe
for V1130 Tau.
The rotational velocities determined from the BF analyses are within
1 km s-1
from the input values, and the light ratio is reproduced to high
precision. Analyses of the observed V1130 Tau spectra
yield mean ![]() velocities of
velocities of
![]() (primary) and
(primary) and
![]() km s-1(secondary),
and
the mean light ratio,
km s-1(secondary),
and
the mean light ratio, ![]() ,
is in perfect agreement with
the results from the light curve analyses (Table 4). No
significant wavelength/order dependencies are seen.
,
is in perfect agreement with
the results from the light curve analyses (Table 4). No
significant wavelength/order dependencies are seen.
![\begin{figure}
\par\includegraphics[width=8cm,clip]{13700f3.ps}
\end{figure}](/articles/aa/full_html/2010/02/aa13700-09/img50.png)
|
Figure 3: Broadening function (thick) obtained for the 5090-5212 Å region and theoretical fit (thin). The FEROS spectrum was taken at phase 0.834, at HJD = 2 451 207.5446. The primary component is to the right. |
| Open with DEXTER | |
4.3 Spectroscopic elements
Table 7: Spectroscopic orbital solution for V1130 Tau.
Spectroscopic orbits have been derived through analyses of the radial velocities obtained from each of the two BF analyses of the eight selected orders. Since the components of V1130 Tau are quite close and deformed, the observed light center velocities deviate somewhat from the center of mass velocities, which are used to determine the Keplerian orbital parameters. Before analysing the velocities, we have therefore for each order applied phase dependent corrections as calculated from the Wilson-Devinney code near the corresponding wavelength range; see Sect. 3.4. At the observed phases they range between about -1.2 and +1.4 km s-1 for the primary component and between about -2.2 and +1.3 km s-1 for the secondary component. Order to order differences are less than 10% of the corrections; using average corrections leads in fact to identical orbital solutions.
Next, for each observed phase, mean values of the corrected
radial velocities from the eight selected orders were formed, and
spectroscopic orbits were then calculated using the method of
Lehman-Filhés implemented in the SBOP![]() program (Etzel 2004),
which is a modified and expanded version of
an earlier code by Wolfe et al. (1967).
A circular orbit was assumed, and the period P
and epoch T were fixed at the ephemeris
values (Eq. (1)).
Equal weights were assigned to the radial velocities,
and the two components were analysed independently
(SB1 solutions).
The elements are listed in the first two columns of Table 7, and as
seen, the results from the WD based and the simpler
symmetrical BF's agree
very well, giving minimum masses accurate to about 0.6%. For
both set of velocities, SB2 analyses yield identical semiamplitudes.
Within errors, the system velocities agree, even without accounting for
the
small difference in gravitational redshift for the components,
about 0.06 km s-1.
program (Etzel 2004),
which is a modified and expanded version of
an earlier code by Wolfe et al. (1967).
A circular orbit was assumed, and the period P
and epoch T were fixed at the ephemeris
values (Eq. (1)).
Equal weights were assigned to the radial velocities,
and the two components were analysed independently
(SB1 solutions).
The elements are listed in the first two columns of Table 7, and as
seen, the results from the WD based and the simpler
symmetrical BF's agree
very well, giving minimum masses accurate to about 0.6%. For
both set of velocities, SB2 analyses yield identical semiamplitudes.
Within errors, the system velocities agree, even without accounting for
the
small difference in gravitational redshift for the components,
about 0.06 km s-1.
As a further check, we have analysed the eight orders independently. The individual semiamplitudes differ slightly more than their typical mean errors of 0.6 km s-1, but for both BF methods, their mean values agree very well with the results presented in Table 7. Finally, applying instead mean radial velocities weighted according to the quality of the individual order solutions, and/or weighting the mean radial velocities according to the S/N ratio of the observed spectra (Table 5), lead to practically identical elements. Also, shifting first the velocities from each order by the difference between its system velocity and the mean system velocity (primary and secondary components treated individually) does not change the elements significantly.
![\begin{figure}
\par\includegraphics[width=8cm,clip]{13700f4.ps}
\end{figure}](/articles/aa/full_html/2010/02/aa13700-09/img83.png)
|
Figure 4: Spectroscopic orbital solution for V1130 Tau (solid line: primary; dashed line: secondary) and corrected radial velocities (filled circles: primary; open circles: secondary). The dotted line ( upper panel) represents the mean center-of-mass velocity of the system. Phase 0.0 corresponds to central primary eclipse. |
| Open with DEXTER | |
Based on the results mentioned above, we believe that the radial
velocity
differences from the two BF approaches, which for the mean values are
within ![]() 1 km s-1,
are more likely due to imperfections in the observed BF's, affecting
the theoretical fits differently, than to measurable (line)
asymmetries. Furthermore, the quality of the two datasets are
comparable
with about the same order-to-order spread of the velocities. We
have therefore taken the pragmatic decision to base the final orbital
elements
on the mean values of their velocities; see Table A.1.
These elements are listed in the third column of Table 7 and the
corresponding orbits are shown in Fig. 4. Finally,
we note that if the light center velocities are applied without
corrections, both semiamplitudes become 1.1 km s-1
smaller than listed
in Table 7,
and the derived masses become about
0.03
1 km s-1,
are more likely due to imperfections in the observed BF's, affecting
the theoretical fits differently, than to measurable (line)
asymmetries. Furthermore, the quality of the two datasets are
comparable
with about the same order-to-order spread of the velocities. We
have therefore taken the pragmatic decision to base the final orbital
elements
on the mean values of their velocities; see Table A.1.
These elements are listed in the third column of Table 7 and the
corresponding orbits are shown in Fig. 4. Finally,
we note that if the light center velocities are applied without
corrections, both semiamplitudes become 1.1 km s-1
smaller than listed
in Table 7,
and the derived masses become about
0.03 ![]() lower.
lower.
Our results differ slightly from those by Rucinski
et al. (2003),
![]() km s-1,
km s-1,
![]() km s-1,
and
km s-1,
and
![]() km s-1,
and are more accurate.
km s-1,
and are more accurate.
5 Chemical abundances
![\begin{figure}
\par\includegraphics[width=8.8cm,clip]{13700f5.ps}
\end{figure}](/articles/aa/full_html/2010/02/aa13700-09/img87.png)
|
Figure 5:
Part of FEROS spectrum taken at phase 0.168 (gray) and synthetic
binary spectra (thin) calculated for
|
| Open with DEXTER | |
Due to the high rotational velocities of the components (Sect. 4.2), a detailed chemical analysis of V1130 Tau based on the FEROS spectra is difficult, see Fig. 5. First, the lines with intrinsic equivalent widths below about 100 mÅ, which should preferably be used, are shallow and broad and therefore impossible to measure accurately. Next, line blending becomes a serious issue, and finally proper normalization of the spectra is difficult, especially in the blue spectral region. Line by line analyses of either the observed spectra or the reconstructed component spectra calculated from disentangled spectra have therefore not been attempted. We refer to CTB08 and Clausen et al. (2009) for details on line by line analyses of binaries. We have instead established upper and lower limits for the metal abundance of V1130 Tau by comparing the observed spectra and synthetic binary spectra calculated for a range of scaled solar compositions. The synthetic spectra were produced as described in Sect. 4.2. The overall result, based on inspection of several spectra and orders, is that synthetic spectra for metal abundances between -0.35 and -0.15 dex fit the observed spectra equally well, whereas e.g. the lines/lineblends for solar abundance spectra, as illustrated in Fig. 5, are clearly too strong.
In addition, abundances have been derived from various uvby
calibrations
and the indices listed in Tables 1
and 8.
The Holmberg et al. (2007)
calibration gives ![]() =
=
![]() for
both components, whereas
the ``blue'' calibration by Nordström et al. (2004)
gives
for
both components, whereas
the ``blue'' calibration by Nordström et al. (2004)
gives ![]() =
=
![]() .
For comparison,
the older calibration by Edvardsson et al. (1993) gives
.
For comparison,
the older calibration by Edvardsson et al. (1993) gives
![]() =
=
![]() .
.
In conclusion, we confirm that V1130 Tau is
(slightly) metal-weak, see Sect. 2, and adopt
![]() =
=
![]() .
.
6 Absolute dimensions
Absolute dimensions for the components of V1130 Tau are calculated from the elements given in Tables 4 and 7. As seen in Table 8, both masses and (volume) radii have been established to an accuracy of 0.6-0.7%.
Individual standard uvby indices are
included in Table 8,
as calculated from the combined indices of V1130 Tau outside
eclipses (Table 1)
and the luminosity ratios (Table 4).
According to the calibration by Olsen (1988) and the
combined ![]() indices at phase 0.25, there is no
significant interstellar reddening.
indices at phase 0.25, there is no
significant interstellar reddening.
The adopted effective temperatures (6650 K,
6625 K) were calculated from the
calibration by Holmberg et al. (2007), assuming
![]() = -0.25(Sect. 5). The
uncertainties include those of the uvby indices,
E(b-y),
= -0.25(Sect. 5). The
uncertainties include those of the uvby indices,
E(b-y),
![]() and the calibration itself.
Identical temperatures are obtained from the calibration by
Ramírez & Meléndez (2005),
whereas that by
Alonso et al. (1996)
leads to 100 K lower values.
2MASS photometry at phase 0.79, where V =
6.555, and the
and the calibration itself.
Identical temperatures are obtained from the calibration by
Ramírez & Meléndez (2005),
whereas that by
Alonso et al. (1996)
leads to 100 K lower values.
2MASS photometry at phase 0.79, where V =
6.555, and the ![]() calibration by Masana et al. (2006) gives an
average temperature
of 6600 K.
calibration by Masana et al. (2006) gives an
average temperature
of 6600 K.
Table 8: Astrophysical data for V1130 Tau.
The measured rotational velocities (![]() )
are close to the
projected synchronous velocities. We note that for an orbital
inclination of ``only''
)
are close to the
projected synchronous velocities. We note that for an orbital
inclination of ``only''
![]() ,
the true equatorial velocities
are about 4% higher. The turbulent dissipation and radiative
damping formalism of Zahn
(1977,1989) predicts
synchronization times scales of
,
the true equatorial velocities
are about 4% higher. The turbulent dissipation and radiative
damping formalism of Zahn
(1977,1989) predicts
synchronization times scales of
![]() yr
(primary) and
yr
(primary) and
![]() yr (secondary),
and a time scale for circularization of
yr (secondary),
and a time scale for circularization of
![]() yr.
yr.
The distance to V1130 Tau was calculated from the
``classical'' relation
(see e.g. CTB08), adopting the solar values and bolometric corrections
given in Table 8
and accounting for all error sources.
Other BC scales (e.g. Code et al.
1976; Bessell
et al. 1998;
Girardi et al. 2002)
give nearly identical results. As seen, the distances obtained for the
two components agree well.
The mean distance, 71.2 pc, which has been established to
about 3%, is close to the result from the
new Hipparcos reduction by van Leeuwen (2007),
![]() pc,
but
is marginally larger than the original Hipparcos result
pc,
but
is marginally larger than the original Hipparcos result
![]() pc
(ESA 1997).
Finally, we note that V1130 Tau belongs to the group of
eclipsing binaries within 125 pc, discussed by Popper (1998), which could be
useful for improving the radiative flux scale.
pc
(ESA 1997).
Finally, we note that V1130 Tau belongs to the group of
eclipsing binaries within 125 pc, discussed by Popper (1998), which could be
useful for improving the radiative flux scale.
7 Discussion
Below, we first compare the absolute dimensions obtained for V1130 Tau with properties of recent theoretical stellar evolutionary models, and we then discuss V1130 Tau together with the few other similar well-studied eclipsing binaries available.
7.1 Comparison with stellar models
Figures 6-8 illustrate
the results from comparisons with the
Yonsei-Yale (Y2) evolutionary
tracks and isochrones by Demarque et al.
(2004)![]() .
They include core overshoot where
.
They include core overshoot where
![]() depends
on mass and also takes into account the composition dependence of
depends
on mass and also takes into account the composition dependence of
![]()
![]() .
The mixing length parameter in convective envelopes is calibrated using
the Sun, and is held fixed at
.
The mixing length parameter in convective envelopes is calibrated using
the Sun, and is held fixed at
![]() .
The enrichment law Y
= 0.23 + 2Z is adopted, together with the solar
mixture by Grevesse et al. (1996),
leading to
(X, Y, Z)
.
The enrichment law Y
= 0.23 + 2Z is adopted, together with the solar
mixture by Grevesse et al. (1996),
leading to
(X, Y, Z)![]() = (0.71564,
0.26624, 0.01812).
A brief description of other aspects of their
up-to-date input physics in given by CTB08. Only models for
= (0.71564,
0.26624, 0.01812).
A brief description of other aspects of their
up-to-date input physics in given by CTB08. Only models for
![]() = 0.0
have been included in the figures.
We have used the abundance, mass, and age interpolation routines
provided by the Y2 group.
= 0.0
have been included in the figures.
We have used the abundance, mass, and age interpolation routines
provided by the Y2 group.
![\begin{figure}
\par\includegraphics[width=8cm,clip]{13700f6.ps}
\end{figure}](/articles/aa/full_html/2010/02/aa13700-09/img142.png)
|
Figure 6:
V1130 Tau compared to Y2
models
calculated for |
| Open with DEXTER | |
![\begin{figure}
\par\includegraphics[width=8cm,clip]{13700f7.ps}
\end{figure}](/articles/aa/full_html/2010/02/aa13700-09/img143.png)
|
Figure 7:
V1130 Tau compared to Y2
models
calculated for |
| Open with DEXTER | |
![\begin{figure}
\par\includegraphics[width=8cm,clip]{13700f8.ps}
\end{figure}](/articles/aa/full_html/2010/02/aa13700-09/img144.png)
|
Figure 8:
V1130 Tau compared to Y2 models
calculated for |
| Open with DEXTER | |
![\begin{figure}
\par\includegraphics[width=8cm,clip]{13700f9.ps}
\end{figure}](/articles/aa/full_html/2010/02/aa13700-09/img145.png)
|
Figure 9: V1130 Tau compared to the models listed in Table 9. Isochrones for the average ages inferred from masses and radii are shown. Y2: thick full drawn (black). BaSTI overshoot: thin full drawn (blue). BaSTI standard: dotted (blue). Victoria-Regina: dashed (red). |
| Open with DEXTER | |
As seen from Fig. 6,
models for the observed
masses and abundance, ![]() =-0.25,
equivalent to
(X, Y, Z)
=-0.25,
equivalent to
(X, Y, Z)![]() = (0.7385,
0.2510, 0.0105),
are about 200 K hotter than observed. The uncertainty of
= (0.7385,
0.2510, 0.0105),
are about 200 K hotter than observed. The uncertainty of
![]() is
is
![]() dex, and
tracks for
dex, and
tracks for ![]() = -0.15,
equivalent to
(X, Y, Z) = (0.7310,
0.2560, 0.0130), fit the components at an age of about
2.2 Gyr. This can also be reached for
= -0.15,
equivalent to
(X, Y, Z) = (0.7310,
0.2560, 0.0130), fit the components at an age of about
2.2 Gyr. This can also be reached for
![]() = -0.25, if
a slight hypothetical
= -0.25, if
a slight hypothetical ![]() -element
enrichment of
-element
enrichment of
![]() = 0.15 is
introduced.
The more massive secondary component has evolved to the middle
of the main sequence band.
= 0.15 is
introduced.
The more massive secondary component has evolved to the middle
of the main sequence band.
From a binary perspective, the most fundamental comparison
is that based on the scale-independent masses and radii, as shown in
Fig. 7.
The ![]() = -0.25
model isochrone for 2.13 Gyr marginally fits
both components, but within the abundance uncertainty, the
general trend is that the Y2
isochrones predict a higher age for the secondary component than for
the primary. Although less evident, this is also seen in the
mass-luminosity
diagram (Fig. 8).
= -0.25
model isochrone for 2.13 Gyr marginally fits
both components, but within the abundance uncertainty, the
general trend is that the Y2
isochrones predict a higher age for the secondary component than for
the primary. Although less evident, this is also seen in the
mass-luminosity
diagram (Fig. 8).
In Fig. 9 we
have included mass-radius comparisons with the Victoria-Regina (VRSS
grid; VandenBerg et al.
2006)![]() and BaSTI (Pietrinferni et al. 2004)
and BaSTI (Pietrinferni et al. 2004)![]() models, which differ from Y2,
e.g. with respect to input physics,
He enrichment law, and core overshoot treatment. We refer to CTB08 for
a brief description. Basic parameters for the models,
all with solar scaled abundances, are given in Table 9.
Like the Y2 models,
both the standard and overshoot BaSTI models marginally
fit both components, but at a lower age.
However, the Victoria-Regina models do not fit V1130 Tau well.
To us, this is surprising, because these models are carefully
calibrated by cluster and binary observations. Models with
models, which differ from Y2,
e.g. with respect to input physics,
He enrichment law, and core overshoot treatment. We refer to CTB08 for
a brief description. Basic parameters for the models,
all with solar scaled abundances, are given in Table 9.
Like the Y2 models,
both the standard and overshoot BaSTI models marginally
fit both components, but at a lower age.
However, the Victoria-Regina models do not fit V1130 Tau well.
To us, this is surprising, because these models are carefully
calibrated by cluster and binary observations. Models with
![]() = 0.3
(VR2A grid) can reproduce V1130 Tau at an age of
about 2.15 Gyr, but only for
= 0.3
(VR2A grid) can reproduce V1130 Tau at an age of
about 2.15 Gyr, but only for
![]() around
-0.40 dex.
around
-0.40 dex.
Table 9: Models information and average ages inferred from masses and radii; see Fig. 9.
Table 10: Information on the Claret models and ages inferred from radii; see Figs. 10 and 11.
![\begin{figure}
\par\includegraphics[width=8cm,clip]{13700f10.ps}
\end{figure}](/articles/aa/full_html/2010/02/aa13700-09/img160.png)
|
Figure 10:
V1130 Tau compared to Claret models for the observed
masses and |
| Open with DEXTER | |
Thus, except for the Victoria-Regina models, all the models with solar
scaled abundances we have tested are marginally able to
reproduce V1130 Tau, but
we see two general trends: first, models for the observed
![]() are about
200 K too hot. Second, they systematically predict higher ages
for the more massive secondary component than for the primary.
In order to look in more detail into this, we have calculated dedicated
models for the component masses with various parameters tuned. For all
models, we have adopted Z = 0.010, which is
equivalent to the observed
are about
200 K too hot. Second, they systematically predict higher ages
for the more massive secondary component than for the primary.
In order to look in more detail into this, we have calculated dedicated
models for the component masses with various parameters tuned. For all
models, we have adopted Z = 0.010, which is
equivalent to the observed ![]() .
We have applied the Granada code by
Claret (2004),
which assumes an enrichment law of
Y
= 0.24 + 2.0Ztogether with the solar mixture by
Grevesse & Sauval (1998),
leading to (X, Y, Z)
.
We have applied the Granada code by
Claret (2004),
which assumes an enrichment law of
Y
= 0.24 + 2.0Ztogether with the solar mixture by
Grevesse & Sauval (1998),
leading to (X, Y, Z)![]() = (0.704,
0.279, 0.017).
The envelope mixing length parameter needed to reproduce the Sun is
= (0.704,
0.279, 0.017).
The envelope mixing length parameter needed to reproduce the Sun is
![]() .
The amount of core overshooting is given, in units of
the pressure scale height, by
.
The amount of core overshooting is given, in units of
the pressure scale height, by
![]() .
.
Table 10
lists the models we have investigated.
As seen in Fig. 10,
the overshoot models (1)
with Y calculated from the adopted
enrichment law are too hot, as seen
for the other grids. The same is true for models without overshoot (2,
not shown).
Since the components of V1130 Tau are rotating quite
fast (Table 8),
we have calculated models which include rotation as described by Claret
(1999). Angular
velocities for the models were tuned to reproduce the
observed equatorial rotational velocities of the components.
As expected, such models (3) are cooler than similar ones without
rotation (1), but the effect is small compared to the about
200 K discrepancy.
Next, the components of V1130 Tau have (thin) outer convection
zones, and we have
therefore investigated the effect of modifying the envelope mixing
length parameter. 2D radiation hydrodynamic calculations by
Ludwig et al. (1999;
see also Clausen et al. 2009)
predict parameters, which are about 0.2 lower than for the
Sun, and we have therefore adopted 1.50.
The models (4) become cooler, but again the effect is too small.
Finally, we have calculated models with a He abundance slightly lower
than Y = 0.26, as given by the enrichment law for Z
= 0.01. Tracks for Y = 0.24 (5) and 0.23
(6, not shown) actually fit V1130 Tau well. If we now turn to
the ages, as determined from the radii, Fig. 11 shows
that these models with lower Y also predict
practically identical ages for the components.
In fact, this also holds if lower
![]() values
are adopted;
models without overshoot place the primary component just at the
end of the core hydrogen burning phase. On the other hand, all the
Granada models for Y = 0.26 predict higher ages for
the secondary component than for the primary, as seen for the other
grids.
values
are adopted;
models without overshoot place the primary component just at the
end of the core hydrogen burning phase. On the other hand, all the
Granada models for Y = 0.26 predict higher ages for
the secondary component than for the primary, as seen for the other
grids.
![\begin{figure}
\par\includegraphics[width=8.5cm,clip]{13700f11.ps}
\end{figure}](/articles/aa/full_html/2010/02/aa13700-09/img162.png)
|
Figure 11:
V1130 Tau compared to Claret models for the observed
masses and |
| Open with DEXTER | |
Before finishing these comparisons and drawing any definite conclusions about the need to adjust basic physical or chemical ingredients of the models, it is worth remembering that besides being fast rotating, the components of V1130 Tau are influenced by their mutual gravitational and radiative interactions. They cause not only additional deformation, but also expansion and some heating, and these effects are probably somewhat different for the two stars. We will not elaborate further on the possible implications for the model comparisons until additional, similar, but more detached binaries have been studied.
7.2 Comparison with other binaries
Binaries like V1130 Tau with component(s) that have
evolved to the upper
half of the main sequence band, or beyond, may give important
information
on core overshoot.
Already 20 years ago, such systems were found to provide
strong evidence for convective core overshoot in intermediate mass
(1.5-2.5 ![]() )
stars (Andersen et al. 1990).
From a sample of 2-12
)
stars (Andersen et al. 1990).
From a sample of 2-12 ![]() systems, Ribas et al. (2000)
found a significantly increasing of the amount of overshoot with
increasing stellar mass, whereas Claret (2007) found that it is
less pronounced and
more uncertain.
systems, Ribas et al. (2000)
found a significantly increasing of the amount of overshoot with
increasing stellar mass, whereas Claret (2007) found that it is
less pronounced and
more uncertain.
From the onset of core convection up to about 1.5 ![]() there are, however, only a few relevant, well-studied binaries:
(excluding active systems and systems with nearly identical
components):
AI Phe, BK Peg,
BW Aqr, and GX Gem. Andersen
et al. (1988)
found that models without core overshoot
were able to reproduce AI Phe
(1.24 + 1.20
there are, however, only a few relevant, well-studied binaries:
(excluding active systems and systems with nearly identical
components):
AI Phe, BK Peg,
BW Aqr, and GX Gem. Andersen
et al. (1988)
found that models without core overshoot
were able to reproduce AI Phe
(1.24 + 1.20 ![]() ,
components above the main sequence) remarkably well for a normal helium
abundance
,
components above the main sequence) remarkably well for a normal helium
abundance![]() ,
whereas Clausen (1991)
found that models including moderate overshoot gave better fits for
especially the primary components of the slightly more massive systems
BW Aqr (1.49 + 1.39
,
whereas Clausen (1991)
found that models including moderate overshoot gave better fits for
especially the primary components of the slightly more massive systems
BW Aqr (1.49 + 1.39 ![]() )
and BK Peg
(1.43 + 1.28
)
and BK Peg
(1.43 + 1.28 ![]() ). The latter is consistent
with a lower limit of
). The latter is consistent
with a lower limit of ![]() of about 0.18 for GX Gem
(1.49 + 1.47
of about 0.18 for GX Gem
(1.49 + 1.47 ![]() ), as established by Lacy
et al. (2008).
), as established by Lacy
et al. (2008).
We had hoped and expected, that V1130 Tau could fill
the mass gap between
these systems, but as mentioned in Sect. 7.1 this is not
the
case - Claret models with ![]() from 0 to at least 0.2 can reproduce it perfectly
well for Y = 0.23-0.24.
In contradiction to this, Tomasella et al. (2008a,b) report
determination of
from 0 to at least 0.2 can reproduce it perfectly
well for Y = 0.23-0.24.
In contradiction to this, Tomasella et al. (2008a,b) report
determination of ![]() from the much younger systems V505 Per
and V570 Per.
from the much younger systems V505 Per
and V570 Per.
It is, however, still important to try to calibrate core
overshoot
better from its onset to say 2 ![]() .
For the Victoria-Regina model grids,
VandenBerg et al. (2006)
adopt, from binary and cluster information, a mass and abundance
dependent amount, setting in around 1.1
.
For the Victoria-Regina model grids,
VandenBerg et al. (2006)
adopt, from binary and cluster information, a mass and abundance
dependent amount, setting in around 1.1 ![]() and gradually increasing up to about 1.7
and gradually increasing up to about 1.7 ![]() .
Demarque et al. (2004)
apply a different ramping algorithm for the Y2isochrones,
as do Pietrinferni et al. (2004)
for the BaSTI calculations. These recipes, and others, need further
empirical tests, and we plan to address that issue in forthcoming
re-analyses of BW Aqr and BK Peg, which will include
abundance determinations, as well as through new complete analyses of
AL Leo, HD76196, and possibly also the
NGC752 member DS And.
.
Demarque et al. (2004)
apply a different ramping algorithm for the Y2isochrones,
as do Pietrinferni et al. (2004)
for the BaSTI calculations. These recipes, and others, need further
empirical tests, and we plan to address that issue in forthcoming
re-analyses of BW Aqr and BK Peg, which will include
abundance determinations, as well as through new complete analyses of
AL Leo, HD76196, and possibly also the
NGC752 member DS And.
Another important aspect is the He abundance and the
helium-to-metal enrichment ratio, and, through extrapolation, the
primordial He/H abundance ratio. As discussed in Sect. 7.1,
V1130 Tau points towards a lower He abundance and/or
enrichment ratio than the four different Y,Z
prescriptions adopted by the model grids studied.
We refer to Casagrande et al. (2007) for at recent
determination of ![]() based on K dwarfs (
based on K dwarfs (
![]() ), to Blaser (2006) for a HII based
study (
), to Blaser (2006) for a HII based
study (
![]() )
with references to a variety of methods and results, and to Ribas
et al. (2000)
and Claret & Willems (2002)
for determinations based on samples of eclipsing binaries (
)
with references to a variety of methods and results, and to Ribas
et al. (2000)
and Claret & Willems (2002)
for determinations based on samples of eclipsing binaries (
![]() and
and
![]() ,
respectively).
We believe binaries can give an even better constraint, provided
detailed
heavy element abundance determinations become available for a
sufficiently large sample
,
respectively).
We believe binaries can give an even better constraint, provided
detailed
heavy element abundance determinations become available for a
sufficiently large sample![]() .
Such investigations are in progress for several systems, and we will
return to this matter in forthcoming papers.
.
Such investigations are in progress for several systems, and we will
return to this matter in forthcoming papers.
Here, we close the issue with a brief historical remark: the use of binaries to determine the hydrogen content of stars was pioneered by Eddington (1932) and Strömgren (1932, 1933), and a few years later Strömgren (1938) also used binaries in his classical discussion of the helium content of the interior of the stars. Later, binary based helium-hydrogen abundance ratio determinations (for Population I stars) were published by Strömgren (1967) and Popper et al. (1970).
8 Summary and conclusions
From state-of-the-art observations and analyses, precise (0.6-0.7%) absolute dimensions have been established for the nearby, early F-type, double-lined, detached eclipsing binary V1130 Tau. From synthetic spectra and uvby calibrations, a metal abundance ofYonsai-Yale, BaSTI, and Granada evolutionary models for the observed metal abundance and a ``normal'' He content of Y = 0.25-0.26, as established from the adopted helium enrichment laws, marginally reproduce the components at ages between 1.8 and 2.1 Gyr. All such models are, however, systematically about 200 K hotter than observed, and predict ages for the more massive component, which are systematically higher than for the less massive component. The latter is even more pronounced for Victoria-Regina models. The two trends can not be removed by adjusting the amount of core overshoot or envelope convection level, or by including rotation in the model calculations. They may be due to proximity effects in V1130 Tau, but on the other hand, we find excellent agreement for 2.5-2.8 Gyr Granada models with a slightly lower Y of 0.23-0.24.
We had expected that V1130 Tau is sufficiently
evolved to provide new information on the level of core overshoot in
the 1.1-1.7 ![]() interval,
where it is believed to ramp up, but this is not the case.
V1130 Tau can be reproduced by models calculated for
interval,
where it is believed to ramp up, but this is not the case.
V1130 Tau can be reproduced by models calculated for
![]() from 0.0
to at least 0.2. The preference for a helium
content of 0.23-0.24 is interesting,
but more well-detached systems with measured metal abundances are
needed for any firm conclusions on the implications for example for the
helium enrichment law. We will return to these issues in forthcoming
papers on other systems recently observed within the Copenhagen binary
project.
from 0.0
to at least 0.2. The preference for a helium
content of 0.23-0.24 is interesting,
but more well-detached systems with measured metal abundances are
needed for any firm conclusions on the implications for example for the
helium enrichment law. We will return to these issues in forthcoming
papers on other systems recently observed within the Copenhagen binary
project.
Appendix A: Radial velocity observations
Table A.1: Mean radial velocities for V1130 Tau.
AcknowledgementsWe thank B. R. Jørgensen, J. Mouette, and N. T. Kaltcheva for participating in the (semi)automatic observations of V1130 Tau at the SAT. A. Kaufer, O. Stahl, S. Tubbesing, and B. Wolf kindly obtained seven FEROS spectra of V1130 Tau during Heidelberg/Copenhagen guaranteed time in 1999. Excellent technical support was received from the staffs of Copenhagen University and ESO, La Silla. We thank J. M. Kreiner for providing a complete list of published times of eclipse for V1130 Tau, H. Bruntt for making his bssynth software available, and J. Southworth for access to his JKTWD code. The projects ``Stellar structure and evolution - new challenges from ground and space observations'' and ``Stars: Central engines of the evolution of the Universe'', carried out at Copenhagen University and Aarhus University, are supported by the Danish National Science Research Council. The following internet-based resources were used in research for this paper: the NASA Astrophysics Data System; the SIMBAD database and the VizieR service operated by CDS, Strasbourg, France; the ariv scientific paper preprint service operated by Cornell University; the VALD database made available through the Institute of Astronomy, Vienna, Austria. This publication makes use of data products from the Two Micron All Sky Survey, which is a joint project of the University of Massachusetts and the Infrared Processing and Analysis Center/ California Institute of Technology, funded by the National Aeronautics and Space Administration and the National Science Foundation.
References
- Abt, H. A. 1986, ApJ, 309, 260 [NASA ADS] [CrossRef] [Google Scholar]
- Alonso, A., Arribas, S., & Martínez-Roger, C. 1996, A&A, 313, 873 [NASA ADS] [Google Scholar]
- Andersen, J., Clausen, J. V., Gustafsson, B., Nordström, B., & VandenBerg, D. A. 1988, A&A, 196, 128 [NASA ADS] [Google Scholar]
- Andersen, J., Nordström, B., & Clausen, J. V. 1990, ApJ, 363, L33 [NASA ADS] [CrossRef] [Google Scholar]
- Balser, D. S. 2006, AJ, 132, 2326 [NASA ADS] [CrossRef] [Google Scholar]
- Bessell, M. S., Castelli, F., & Plez, B. 1998, A&A, 333, 231 [NASA ADS] [Google Scholar]
- Brat, L., Smelcer, L., Kucakova, H., et al. 2008, Open Eur. Jour. Var. Stars, 94, 1 [Google Scholar]
- Casagrande, L., Flynn, C., Portinari, L., Girardi, L., & Jimenez, R. 2007, MNRAS, 382, 1516 [NASA ADS] [CrossRef] [Google Scholar]
- Claret, A. 1999, A&A, 350, 56 [NASA ADS] [Google Scholar]
- Claret, A. 2000, A&A, 363, 1081 [NASA ADS] [Google Scholar]
- Claret, A. 2004, A&A, 424, 919 [NASA ADS] [CrossRef] [EDP Sciences] [Google Scholar]
- Claret, A. 2007, A&A, 475, 1019 [NASA ADS] [CrossRef] [EDP Sciences] [Google Scholar]
- Claret, A., & Willems, B. 2002, A&A, 388, 518 [NASA ADS] [CrossRef] [EDP Sciences] [Google Scholar]
- Clausen, J. V. 1991, A&A, 246, 397 [NASA ADS] [Google Scholar]
- Clausen, J. V., Helt, B. E., & Olsen, E. H. 2001, A&A, 374, 980 (CHO01) [NASA ADS] [CrossRef] [EDP Sciences] [Google Scholar]
- Clausen, J. V., Torres, G., Bruntt, H., et al. 2008, A&A, 487, 1095 (CTB08) [NASA ADS] [CrossRef] [EDP Sciences] [Google Scholar]
- Clausen, J. V., Bruntt, H., Claret, A., et al. 2009, A&A, 502, 353 [Google Scholar]
- Code, A. D., Bless, R. C., Davis, J., & Brown, R. H. 1976, ApJ, 203, 417 [NASA ADS] [CrossRef] [Google Scholar]
- Demarque, P., Woo, J.-H., Kim, Y.-C., & Yi, S. K. 2004, ApJS, 155, 667 [NASA ADS] [CrossRef] [Google Scholar]
- Eddington, A. S., MNRAS, 92, 471 [Google Scholar]
- Edvardsson, B., Andersen, J., Gustafsson, B., et al. 1993, A&A, 275, 101 [NASA ADS] [Google Scholar]
- ESA 1997, The Hipparcos and Tycho Catalogues, ESA SP-1200 [Google Scholar]
- Etzel, P. B. 2004, SBOP: Spectroscopic Binary Orbit Program San Diego State University [Google Scholar]
- Flower, P. J. 1996, ApJ, 469, 355 [NASA ADS] [CrossRef] [Google Scholar]
- Franco, G. A. P. 1988, A&AS, 74, 73 [Google Scholar]
- Grevesse, N., & Sauval, A. J. 1998, Space Sci. Rev., 85, 161 [NASA ADS] [CrossRef] [Google Scholar]
- Grevesse, N., Noels, A., & Sauval, A. J. 1996, in Cosmic Abundances, ed. S. S. Holt, & G. Sonneborn (San Francisco: ASP), 117 [Google Scholar]
- Girardi, L., Bertelli, G., Bressan, A., et al. 2002, A&A, 391, 195 [NASA ADS] [CrossRef] [EDP Sciences] [Google Scholar]
- Gray, R. O. 1989, AJ, 98, 1049 [NASA ADS] [CrossRef] [Google Scholar]
- Gray, R. O., & Garrison, R. F. 1989, ApJS, 69, 301 [NASA ADS] [CrossRef] [Google Scholar]
- Gray, R. O., Napier, M. G., & Winkler, L. I. 2001, AJ, 121, 2148 [NASA ADS] [CrossRef] [Google Scholar]
- Heiter, U., Kupka, F., van't Menneret, C., et al. 2002, A&A, 392, 619 [NASA ADS] [CrossRef] [EDP Sciences] [Google Scholar]
- Holmberg, J., Nordström, B., & Andersen, J. 2007 A&A, 475, 519 [Google Scholar]
- Houk, N., & Swift, C. 1999, Michigan Catalogue of two-dimensional spectraltypes for HD stars, 5, Dep. Astron., Univ. Michigan, Ann Arbor, Michigan, USA [Google Scholar]
- Kaluzny, J., Pych, W., Rucinski, S. M., & Thompson, I. B. 2006, , 56, 237 [Google Scholar]
- Kaufer, A., Stahl, O., Tubbesing, S., et al. 1999, The ESO Messenger, 95, 8 [NASA ADS] [Google Scholar]
- Kaufer, A., Stahl, O., Tubbesing, S., et al. 2000, in Optical and IR Telescope Instrumentation and Detectors, ed. M. Iye, & A. F. Morwood, Proc. SPIE, 4008, 459 [Google Scholar]
- Kazarovets, E. V., Samus, N. N., Durlevich, O. V., et al. 1991, Inf. Bull. Var. Stars, 4659 [Google Scholar]
- Kreiner, J. M. 2004, , 54, 207 [Google Scholar]
- Kreiner, J. M., Kim, C. H., & Nha, I. S. 2001, An Atlas of O-C Diagrams of Eclipsing Binary Stars (Krakow: Wydawnictwo Naukowe Akad. Pedagogicznej) [Google Scholar]
- Kupka, F., Piskunov, N., Ryabchikova, T. A., Stempels, H. C., & Weiss, W. 1999, A&AS, 138, 119 [NASA ADS] [CrossRef] [EDP Sciences] [MathSciNet] [PubMed] [Google Scholar]
- Kurucz, R. L. 1993, in Light Curve Modelling of Eclipsing Binary Stars, ed. E. F. Milone (Springer Verlag), 93 [Google Scholar]
- Lacy, C. H. S., Torres, G., & Claret, A. 2008, AJ, 135, 1757 [NASA ADS] [CrossRef] [Google Scholar]
- Ludwig, H.-G., Freytag, B., & Steffen, M. 1999, [Google Scholar]
- Masana, E., Jordi, C., & Ribas, I. 2006, A&A, 450, 735 [NASA ADS] [CrossRef] [EDP Sciences] [Google Scholar]
- Nordström, B., Mayor, M., Andersen, J., et al. 2004, A&A, 418, 989 [NASA ADS] [CrossRef] [EDP Sciences] [Google Scholar]
- Olsen, E. H. 1983, A&AS, 54, 55 [Google Scholar]
- Olsen, E. H. 1988, A&A, 189, 173 [NASA ADS] [Google Scholar]
- Olsen, E. H. 1993, A&AS, 102, 89 [Google Scholar]
- Olsen, E. H. 1994, A&AS, 106, 257 [Google Scholar]
- Pavlovski, K., Tamajo, E., Koubský, P., et al. 2009, MNRAS, 400, 791 [NASA ADS] [CrossRef] [Google Scholar]
- Pietrinferni, A., Cassisi, S., & Salaris, M. 2004, Mem. Soc. Astron. It., 75, 170 [Google Scholar]
- Popper, D. M. 1983, AJ, 88, 124 [NASA ADS] [CrossRef] [Google Scholar]
- Popper, D. M. 1998, PASP, 110, 919 [NASA ADS] [CrossRef] [Google Scholar]
- Popper, D. M., J▯rgensen, H. E., Morton, D. C., & Leckrone, D. S. 1970, ApJ, 161, L57 [NASA ADS] [CrossRef] [Google Scholar]
- Ramírez, I., & Meléndez, J. 2005, AJ, 626, 465 [Google Scholar]
- Ribas, I., Jordi, C., & Giménez, A. 2000, MNRAS, 318, L55 [NASA ADS] [CrossRef] [Google Scholar]
- Ribas, I., Jordi, C., Torra, J., & Giménez, A. 2000, MNRAS, 313, 99 [NASA ADS] [CrossRef] [Google Scholar]
- Rucinski, S. M. 1999, in Precise Stellar Radial Velocities, ed. J. B. Hearnshaw, & C. D. Scarfe, IAU Coll., 170, ASP Conf. Ser., 185, 82 [Google Scholar]
- Rucinski, S. M. 2002, AJ, 124, 1746 [NASA ADS] [CrossRef] [Google Scholar]
- Rucinski, S. M. 2004, in IAU Symp. 215, ed. A. Maeder, & P. Eenens, Stellar Rotation, 17 [Google Scholar]
- Rucinski, S. M., Lu, W. X., & Shi, J. 1993, AJ, 106, 1174 [NASA ADS] [CrossRef] [Google Scholar]
- Rucinski, S. M., Capobianco, S. C., Lu, W., et al. 2003, AJ, 125, 3257 [Google Scholar]
- Southworth, J., & Clausen, J. V. 2007, A&A, 461, 1077 [NASA ADS] [CrossRef] [EDP Sciences] [Google Scholar]
- Strömgren, B. 1932, ZAp, 4, 118 [NASA ADS] [Google Scholar]
- Strömgren, B. 1933, ZAp, 7, 222 [NASA ADS] [Google Scholar]
- Strömgren, B. 1938, ApJ, 87, 520 [NASA ADS] [CrossRef] [Google Scholar]
- Strömgren, B. 1967, in Modern Astrophysics: A Memorial to Otto Struve, ed. M. Hack, 185 [Google Scholar]
- Tomasella, L., Munari, U., Siviero, A., et al. 2008a, A&A, 480, 465 [NASA ADS] [CrossRef] [EDP Sciences] [Google Scholar]
- Tomasella, L., Munari, U., Cassisi, S., et al. 2008b, A&A, 483, 263 [Google Scholar]
- Torres, G., Andersen, J., & Giménez, A. 2009, A&ARv, in press [Google Scholar]
- Valenti, J., & Piskunov, N. 1996, A&AS, 118, 595 [NASA ADS] [CrossRef] [EDP Sciences] [Google Scholar]
- VandenBerg, D. A., Bergbusch, P. A., & Dowler, P. D. 2006 [Google Scholar]
- Van Hamme, W. 1993, AJ, 106, 2096 [NASA ADS] [CrossRef] [Google Scholar]
- Van Hamme, W., & Wilson, R. E. 2003, in GAIA Spectroscopy: Science and Technology, ed. U. Munari (San Fransisco: ASP), ASP Conf. Ser., 298, 323 [Google Scholar]
- van Leeuwen, F. 2007, Hipparcos, the new reduction of the raw data (Dordrecht: Springer) [Google Scholar]
- Wilson, R. E. 1979, ApJ, 234, 1054 [NASA ADS] [CrossRef] [Google Scholar]
- Wilson, R. E. 1990, ApJ, 356, 613 [NASA ADS] [CrossRef] [Google Scholar]
- Wilson, R. E. 1993, in New Frontiers in Binary Star Research, ed. K. C. Leung, & I. S. Nha (San Fransisco: ASP), ASP Conf. Ser., 38, 91 [Google Scholar]
- Wilson, R. E., & Devinney, E. J. 1971, ApJ, 166, 605 [NASA ADS] [CrossRef] [Google Scholar]
- Wolfe, R. H., Horak, H. G., Storer, N. W. 1967, in Modern Astrophysics: A Memorial to Otto Struve, ed. M. Hack, 251 [Google Scholar]
- Zahn, J.-P. 1977, A&A, 57, 383 [NASA ADS] [Google Scholar]
- Zahn, J.-P. 1989, A&A, 220, 112 [NASA ADS] [Google Scholar]
Footnotes
- ... binaries
- Based on observations carried out at the Strömgren Automatic Telescope (SAT) and the 1.5 m telescope at ESO, La Silla (62.H-0319, 62.L-0284, 63.H-0080, 64.L-0031, 66.D-0178).
- ... 0.23-0.24
- Table 11 is available in electronic form at the CDS via anonymous ftp to cdsarc.u-strasbg.fr (130.79.128.5) or via http://cdsweb.u-strasbg.fr/cgi-bin/qcat?J/A+A/510/A91
- ...2004)
- http://www.as.ap.krakow.pl/ephem
- ... Southworth
- http://www.astro.keele.ac.uk/ jkt/
- ... et al.
- ftp://ftp.astro.ufl.edu/pub/wilson/
- ... SBOP
- Spectroscopic Binary Orbit Program, http://mintaka.sdsu.edu/faculty/etzel/
- ...2004)
- http://www.astro.yale.edu/demarque/yystar.html
- ...

- Defined as ``the mass above which stars continue to have a substantial convective core even after the end of the pre-MS phase.''
- ...2006)
- http://www1.cadc-ccda.hia-iha.nrc-cnrc.gc.ca/cvo/ community/VictoriaReginaModels/
- ...2004)
- http://www.te.astro.it/BASTI/index.php
- ...
abundance
- See also Torres et al. (2009).
- ...
sample
- See Torres et al. (2009) Table 3 for the limited material available today.
All Tables
Table 1: Photometric data for V1130 Tau and the comparison stars.
Table 2: Times of primary (P) and secondary (S) minima of V1130Tau determined from the uvby observations.
Table 3: Photometric solutions for V1130 Tau.
Table 4: Adopted photometric elements for V1130 Tau.
Table 5: Log of the FEROS observations of V1130 Tau.
Table 6: Echelle orders and wavelength ranges used for the radial velocity measurements of V1130 Tau.
Table 7: Spectroscopic orbital solution for V1130 Tau.
Table 8: Astrophysical data for V1130 Tau.
Table 9: Models information and average ages inferred from masses and radii; see Fig. 9.
Table 10: Information on the Claret models and ages inferred from radii; see Figs. 10 and 11.
Table A.1: Mean radial velocities for V1130 Tau.
All Figures
|
|
Figure 1: y light curve and b-y and u-b colour curves (instrumental system) for V1130 Tau. |
| Open with DEXTER | |
| In the text | |
|
|
Figure 2:
(
|
| Open with DEXTER | |
| In the text | |
|
|
Figure 3: Broadening function (thick) obtained for the 5090-5212 Å region and theoretical fit (thin). The FEROS spectrum was taken at phase 0.834, at HJD = 2 451 207.5446. The primary component is to the right. |
| Open with DEXTER | |
| In the text | |
|
|
Figure 4: Spectroscopic orbital solution for V1130 Tau (solid line: primary; dashed line: secondary) and corrected radial velocities (filled circles: primary; open circles: secondary). The dotted line ( upper panel) represents the mean center-of-mass velocity of the system. Phase 0.0 corresponds to central primary eclipse. |
| Open with DEXTER | |
| In the text | |
|
|
Figure 5:
Part of FEROS spectrum taken at phase 0.168 (gray) and synthetic
binary spectra (thin) calculated for
|
| Open with DEXTER | |
| In the text | |
|
|
Figure 6:
V1130 Tau compared to Y2
models
calculated for |
| Open with DEXTER | |
| In the text | |
|
|
Figure 7:
V1130 Tau compared to Y2
models
calculated for |
| Open with DEXTER | |
| In the text | |
|
|
Figure 8:
V1130 Tau compared to Y2 models
calculated for |
| Open with DEXTER | |
| In the text | |
|
|
Figure 9: V1130 Tau compared to the models listed in Table 9. Isochrones for the average ages inferred from masses and radii are shown. Y2: thick full drawn (black). BaSTI overshoot: thin full drawn (blue). BaSTI standard: dotted (blue). Victoria-Regina: dashed (red). |
| Open with DEXTER | |
| In the text | |
|
|
Figure 10:
V1130 Tau compared to Claret models for the observed
masses and |
| Open with DEXTER | |
| In the text | |
|
|
Figure 11:
V1130 Tau compared to Claret models for the observed
masses and |
| Open with DEXTER | |
| In the text | |
Copyright ESO 2010
Current usage metrics show cumulative count of Article Views (full-text article views including HTML views, PDF and ePub downloads, according to the available data) and Abstracts Views on Vision4Press platform.
Data correspond to usage on the plateform after 2015. The current usage metrics is available 48-96 hours after online publication and is updated daily on week days.
Initial download of the metrics may take a while.