| Issue |
A&A
Volume 510, February 2010
|
|
|---|---|---|
| Article Number | A87 | |
| Number of page(s) | 12 | |
| Section | Interstellar and circumstellar matter | |
| DOI | https://doi.org/10.1051/0004-6361/200913077 | |
| Published online | 16 February 2010 | |
CHAMP+ observations of warm gas in M 17 SW
J. P. Pérez-Beaupuits1 - M. Spaans1 - M. R. Hogerheijde2 - R. Güsten3 - A. Baryshev4 - W. Boland2,5
1 - Kapteyn Astronomical Institute, Rijksuniversiteit Groningen, 9747
AV Groningen, The Netherlands
2 - Leiden Observatory, Leiden University, PO Box 9513, 2300 RA,
Leiden, The Netherlands
3 - Max-Planck-Institut für Radioastronomie, Auf dem Hügel 69, 53121
Bonn, Germany
4 - SRON Netherlands Institute for Space Research , PO Box 800, 9700 AV
Groningen, The Netherlands
5 - Nederlandse Onderzoeksschool Voor Astronomie (NOVA), PO Box 9513,
2300 RA Leiden, The Netherlands
Received 6 August 2009 / Accepted 26 October 2009
Abstract
Context. Sub-millimeter and Far-IR observations have
shown the presence of a significant amount of warm (few
hundred K) and dense (
![]() )
gas in sources ranging from active star-forming regions to the vicinity
of the Galactic center. Since the main cooling lines of the gas phase
are important tracers of the interstellar medium in Galactic and
extragalactic sources, proper and detailed understanding of their
emission and the ambient conditions of the emitting gas, is necessary
for a robust interpretation of the observations.
)
gas in sources ranging from active star-forming regions to the vicinity
of the Galactic center. Since the main cooling lines of the gas phase
are important tracers of the interstellar medium in Galactic and
extragalactic sources, proper and detailed understanding of their
emission and the ambient conditions of the emitting gas, is necessary
for a robust interpretation of the observations.
Aims. With high resolution (7''-9'') maps (![]()
![]() pc2)
of mid-J molecular lines we aim to probe the
physical conditions and spatial distribution of the warm (50 to several
hundred K) and dense gas (
pc2)
of mid-J molecular lines we aim to probe the
physical conditions and spatial distribution of the warm (50 to several
hundred K) and dense gas (
![]() )
across the interface region of the nearly edge-on M 17 SW
nebula.
)
across the interface region of the nearly edge-on M 17 SW
nebula.
Methods. We have used the dual color multiple pixel
receiver CHAMP+ on the APEX telescope to obtain
a
![]() map
of the
map
of the ![]() and
and ![]() transitions of 12CO, the 13CO
transitions of 12CO, the 13CO
![]() line,
and the
line,
and the
![]() 370
370 ![]() m
fine-structure transition of [C I] in M 17
SW. LTE and non-LTE radiative transfer models are used to constrain the
ambient conditions.
m
fine-structure transition of [C I] in M 17
SW. LTE and non-LTE radiative transfer models are used to constrain the
ambient conditions.
Results. The warm gas extends up to a distance of ![]() 2.2 pc
from the M 17 SW ridge. The 13CO
2.2 pc
from the M 17 SW ridge. The 13CO
![]() and [C I] 370
and [C I] 370 ![]() m lines have
a narrower spatial extent of about 1.3 pc along a strip line
at
m lines have
a narrower spatial extent of about 1.3 pc along a strip line
at ![]() .
The structure and distribution of the [C I]
.
The structure and distribution of the [C I]
![]() 370
370 ![]() m map
indicate that its emission arises from the interclump medium with
densities on the order of
m map
indicate that its emission arises from the interclump medium with
densities on the order of
![]() .
.
Conclusions. The warmest gas is located along the
ridge of the cloud, close to the ionization front. An LTE approximation
indicates that the excitation temperature of the embedded clumps
reaches ![]() 120 K.
The non-LTE model suggests that the kinetic temperature at four
selected positions cannot exceed 230 K in clumps of a density
of
120 K.
The non-LTE model suggests that the kinetic temperature at four
selected positions cannot exceed 230 K in clumps of a density
of
![]() and that
the warm (
and that
the warm (
![]() K) and dense (
K) and dense (
![]() )
gas traced by the mid-J 12CO lines
represents just about 2% of the bulk of the molecular gas. The clump
volume-filling factor ranges between 0.04 and 0.11 at these positions.
)
gas traced by the mid-J 12CO lines
represents just about 2% of the bulk of the molecular gas. The clump
volume-filling factor ranges between 0.04 and 0.11 at these positions.
Key words: ISM: general - ISM: atoms - ISM: molecules
1 Introduction
The heating and cooling balance in photon-dominated regions (PDRs)
remains an active study of research.
The comprehensive understanding of PDRs requires observations of large
areas close to radiation sources and of a wide wavelength range
covering various emissions of atoms, molecules, and grains.
In particular, mid-J CO lines have been
detected in almost all known massive Galactic star forming regions
(e.g. Orion Nebula, W51, Cepheus A, NGC 2024). This
indicates that warm (
![]() K) and dense (
K) and dense (
![]() )
gas is common and probably of importance in most OB star forming
regions. The mid-J CO lines detected in
regions like e.g. M 17, Cepheus A and W51 have
relatively narrow line widths of 5-10
)
gas is common and probably of importance in most OB star forming
regions. The mid-J CO lines detected in
regions like e.g. M 17, Cepheus A and W51 have
relatively narrow line widths of 5-10
![]() ,
although not as narrow as the line widths observed in cold quiescent
cloud cores.
,
although not as narrow as the line widths observed in cold quiescent
cloud cores.
Observations of the
![]() and
and
![]() transitions of 12CO in several massive
star forming regions indicate that the warm emitting gas is confined to
narrow (<1 pc) zones close to the ionization front.
These observations favor photoelectric heating of the warm gas by UV
radiation fields outside the HII regions (e.g. Harris et al. 1987; Graf
et al. 1993;
Yamamoto et al. 2001; Kramer
et al. 2004
and 2008).
Nevertheless, shocks may also be an important source of heating in high
velocity wing sources like Orion, W51 and W49 (Jaffe et al. 1987).
transitions of 12CO in several massive
star forming regions indicate that the warm emitting gas is confined to
narrow (<1 pc) zones close to the ionization front.
These observations favor photoelectric heating of the warm gas by UV
radiation fields outside the HII regions (e.g. Harris et al. 1987; Graf
et al. 1993;
Yamamoto et al. 2001; Kramer
et al. 2004
and 2008).
Nevertheless, shocks may also be an important source of heating in high
velocity wing sources like Orion, W51 and W49 (Jaffe et al. 1987).
Because of its nearly edge-on geometry and the large amount of observational data available in the literature, M 17 SW is one of the best Galactic regions to study the entire structure of PDRs from the exciting sources to the ionization front, and the succession (or not) of H2, [C I] and CO emissions, as predicted by PDR models (Icke et al. 1980; Felli et al. 1984; Meixner et al. 1992; Meijerink & Spaans 2005). M 17 SW is also one of the few star-forming regions for which the magnetic field strength can be measured in the PDR interface and where the structure of the neutral and molecular gas seems to be dominated by magnetic pressure rather than by gas pressure (Pellegrini et al. 2007).
M 17 SW is a giant molecular cloud at a distance
of 2.2 kpc,
illuminated by a highly obscured (
![]() mag) cluster of
several OB stars (among
mag) cluster of
several OB stars (among ![]() 100 stars)
at about 1 pc to the east (Beetz et al. 1976; Hanson
et al. 1997).
It also harbours a number of candidate young stellar objects that have
recently been found (Povich et al. 2009).
Several studies of molecular emission, excitation and line profiles
(e.g. Snell et al. 1984; Martin
et al. 1984;
Stutzki & Güsten 1990)
from the M 17 SW core indicate that the structure of the gas
is highly clumped rather than homogeneous.
Emission of [C I] and [C II] was
detected more than a parsec into
the molecular cloud along cuts through the interface region (Keene
et al. 1985;
Genzel et al. 1988;
Stutzki et al. 1988).
These results, as well as those found in other star-forming regions
like S106, the Orion Molecular Cloud, and the NGC 7023 Nebula
(e.g. Gerin & Phillips 1998;
Yamamoto et al. 2001;
Schneider et al. 2002,
2003;
Mookerjea et al. 2003)
do not agree with the atomic and molecular stratification predicted by
standard steady-state PDR models.
However, the extended [C I]
100 stars)
at about 1 pc to the east (Beetz et al. 1976; Hanson
et al. 1997).
It also harbours a number of candidate young stellar objects that have
recently been found (Povich et al. 2009).
Several studies of molecular emission, excitation and line profiles
(e.g. Snell et al. 1984; Martin
et al. 1984;
Stutzki & Güsten 1990)
from the M 17 SW core indicate that the structure of the gas
is highly clumped rather than homogeneous.
Emission of [C I] and [C II] was
detected more than a parsec into
the molecular cloud along cuts through the interface region (Keene
et al. 1985;
Genzel et al. 1988;
Stutzki et al. 1988).
These results, as well as those found in other star-forming regions
like S106, the Orion Molecular Cloud, and the NGC 7023 Nebula
(e.g. Gerin & Phillips 1998;
Yamamoto et al. 2001;
Schneider et al. 2002,
2003;
Mookerjea et al. 2003)
do not agree with the atomic and molecular stratification predicted by
standard steady-state PDR models.
However, the extended [C I]
![]() and
13CO
and
13CO
![]() emissions in S140 have been
successfully explained by a stationary but
clumpy PDR model (Spaans 1996; Spaans & van Dishoeck 1997).
Hence, the lack of stratification in [C I] ,
[C II] and CO is a result
that can be expected for inhomogeneous clouds, where each clump acts
as an individual PDR. On the other hand, a partial face-on illumination
of the molecular clouds would also suppress stratification.
emissions in S140 have been
successfully explained by a stationary but
clumpy PDR model (Spaans 1996; Spaans & van Dishoeck 1997).
Hence, the lack of stratification in [C I] ,
[C II] and CO is a result
that can be expected for inhomogeneous clouds, where each clump acts
as an individual PDR. On the other hand, a partial face-on illumination
of the molecular clouds would also suppress stratification.
Based on analysis of low-J lines of 12CO,
13CO and CH3CCH
data, the temperature towards the M 17 SW cloud core has been
estimated as 50-60 K, whereas the mean cloud temperature has
been found to be about 30-35 K
(e.g. Güsten & Fiebig 1988;
Bergin et al. 1994;
Wilson et al. 1999;
Howe et al. 2000;
Snell et al. 2000).
Temperatures of ![]() 275 K
have been estimated from NH3 observations
(Güsten & Fiebig 1988)
towards the VLA continuum arc, which agrees with estimates from highly
excited 12CO transitions (Harris
et al. 1987).
Multitransition CS and HC3N observations
indicate that the density at the core region
of M 17 SW is about
275 K
have been estimated from NH3 observations
(Güsten & Fiebig 1988)
towards the VLA continuum arc, which agrees with estimates from highly
excited 12CO transitions (Harris
et al. 1987).
Multitransition CS and HC3N observations
indicate that the density at the core region
of M 17 SW is about
![]() (e.g.,
Snell et al. 1984;
Wang et al. 1993;
Bergin et al. 1996).
On the other hand, densities up to
(e.g.,
Snell et al. 1984;
Wang et al. 1993;
Bergin et al. 1996).
On the other hand, densities up to
![]() have
been estimated towards the north rim with multitransition
observations of NH3, which indicates that
ammonia is coexistent with high density material traced in CS
and HCN (Güsten & Fiebig 1988).
The UV radiation field G0
has been estimated to be on the order of 104 in
units of the ambient interstellar radiation field (
have
been estimated towards the north rim with multitransition
observations of NH3, which indicates that
ammonia is coexistent with high density material traced in CS
and HCN (Güsten & Fiebig 1988).
The UV radiation field G0
has been estimated to be on the order of 104 in
units of the ambient interstellar radiation field (
![]() ,
Habing 1968;
Meixner et al. 1992).
,
Habing 1968;
Meixner et al. 1992).
However, most of the millimeter-wave molecular observations in
M 17 SW are sensitive only to low temperatures
(<100 K),
and the few available data of mid-J CO and
[C I] lines (consisting mostly of cuts across the
ionization front and observations at a few selected positions) are
limited in spatial resolution and extent (e.g. Harris et al. 1987; Stutzki
et al. 1988;
Genzel et al. 1988;
Stutzki & Güsten 1990;
Meixner et al. 1992;
Graf et al. 1993;
Howe et al. 2000).
Therefore, in this work we present maps (![]()
![]() pc2)
of mid-J molecular (12CO and 13CO
pc2)
of mid-J molecular (12CO and 13CO ![]() )
and atomic ([C I]
)
and atomic ([C I] ![]() )
gas with an excellent
high resolution (
9.4''-7.7''), which advances
existing work in M 17 SW.
)
gas with an excellent
high resolution (
9.4''-7.7''), which advances
existing work in M 17 SW.
The observations were done with CHAMP+
(Carbon Heterodyne Array of the MPIfR) on the Atacama Pathfinder
EXperiment (APEX![]() )
(Güsten et al. 2006).
The multiple pixels at two submm frequencies of CHAMP+ allow the
efficient mapping of
)
(Güsten et al. 2006).
The multiple pixels at two submm frequencies of CHAMP+ allow the
efficient mapping of ![]() arcmin
regions, and provide the ability to observe simultaneously the emission
from the
arcmin
regions, and provide the ability to observe simultaneously the emission
from the ![]() and
and ![]() rotational transitions of 12CO at 691.473 GHz
and 806.652 GHz, respectively.
We also observed the
rotational transitions of 12CO at 691.473 GHz
and 806.652 GHz, respectively.
We also observed the ![]() transition of 13CO at
661.067 GHz and the
transition of 13CO at
661.067 GHz and the
![]() 370
370 ![]() m
(hereafter:
m
(hereafter: ![]() )
fine-structure transition of
[C I] at 809.342 GHz.
)
fine-structure transition of
[C I] at 809.342 GHz.
Since the gas phase cools mainly via the atomic fine structure
lines of [O I] ![]() ,
[C II]
,
[C II] ![]() ,
[C I] and the rotational CO lines (e.g.
Kaufman et al. 1999;
Meijerink & Spaans 2005),
these carbon bearing species presented here are very important coolants
in the interstellar medium (ISM) of a variety of sources in the
Universe, from Galactic star forming regions, the Milky Way as a
galaxy, and external galaxies up to high redshifts (e.g. Fixsen
et al. 1999;
Weiss et al. 2003;
Kramer et al. 2005;
Bayet et al. 2006;
Jakob et al. 2007).
,
[C I] and the rotational CO lines (e.g.
Kaufman et al. 1999;
Meijerink & Spaans 2005),
these carbon bearing species presented here are very important coolants
in the interstellar medium (ISM) of a variety of sources in the
Universe, from Galactic star forming regions, the Milky Way as a
galaxy, and external galaxies up to high redshifts (e.g. Fixsen
et al. 1999;
Weiss et al. 2003;
Kramer et al. 2005;
Bayet et al. 2006;
Jakob et al. 2007).
The case of M 17 SW can be considered as a proxy for
extra galactic star forming regions. M 17 SW is not special,
nor does it need to be, compared to other
massive star-forming regions like Orion, W49, Cepheus A, or
W51. Still, it does allow
feedback effects, expected to be important for starburst and active
galaxies, to be
studied in great spatial detail. A comparison of the local line ratios
to
the extra-galactic regions can then shed light on the properties of
massive
star-forming regions that drive the energetics of active galaxies.
Our results will be of great use for future high resolution
observations, since molecular clouds of the size of the maps we present
will be resolved by ALMA at the distance (![]() 14 Mpc) of galaxies like
NGC 1068.
14 Mpc) of galaxies like
NGC 1068.
The main purpose of this work is to explore the actual spatial
distribution of the mid-J 12CO
and [C I] lines in M 17 SW and to test the
ambient conditions of the warm gas.
A simple LTE model based on the ratio between the 12CO and
13CO
![]() lines is used to
probe the temperature of the warm (
lines is used to
probe the temperature of the warm (
![]() K) and dense (
K) and dense (
![]() )
molecular gas.
Then a non-LTE model is used to test the ambient conditions at four
selected positions.
In a follow-up work we will present an elaborate model of these high
resolution data.
)
molecular gas.
Then a non-LTE model is used to test the ambient conditions at four
selected positions.
In a follow-up work we will present an elaborate model of these high
resolution data.
The most frequent references to Stutzki et al. (1988), Stutzki & Güsten (1990) and Meixner et al. (1992) will be cited as S88, SG90 and M92, respectively. The organization of this article is as follows. In Sect. 2 we describe the observations. The maps of the four lines observed are presented in Sect. 3. The modeling and analysis of the ambient conditions are presented in Sect. 4, and the conclusions and final remarks are presented in Sect. 5.
2 Observations
We have used the dual color heterodyne array receiver CHAMP+
(Kasemann et al. 2006;
Güsten et al. 2008),
providing ![]() pixels,
on the APEX telescope during July 2008 to map the
pixels,
on the APEX telescope during July 2008 to map the
![]() and
and
![]() lines of 12CO simultaneously, and - in
a second coverage - the 13CO
lines of 12CO simultaneously, and - in
a second coverage - the 13CO
![]() and [C I]
and [C I]
![]() .
We observed a region of about
.
We observed a region of about
![]() (3.4 pc
(3.4 pc
![]() 3.0 pc)
in on-the-fly (OTF) slews in RA (
3.0 pc)
in on-the-fly (OTF) slews in RA (![]() 320 arcsec
long), subsequent scans spaced by 4'' in declination.
The observations were done in total power mode, nodding the antenna
prior to each OTF slew to a reference position 180'' east of the SAO
star 161357. The latter is used as a reference throughout the paper,
with RA(J2000)=18:20:27.64 and Dec(J2000)=-16:12:00.90. We used
Sgr B2(N) as a reference for continuum poiting.
Calibration measurements were performed regularly every
320 arcsec
long), subsequent scans spaced by 4'' in declination.
The observations were done in total power mode, nodding the antenna
prior to each OTF slew to a reference position 180'' east of the SAO
star 161357. The latter is used as a reference throughout the paper,
with RA(J2000)=18:20:27.64 and Dec(J2000)=-16:12:00.90. We used
Sgr B2(N) as a reference for continuum poiting.
Calibration measurements were performed regularly every ![]() 10 min
with a cold liquid nitrogen (LN2) load and an ambient temperature load.
The data were processed with the APEX real-time calibration software
(Muders et al. 2006),
assuming an image sideband suppression of 10 dB.
10 min
with a cold liquid nitrogen (LN2) load and an ambient temperature load.
The data were processed with the APEX real-time calibration software
(Muders et al. 2006),
assuming an image sideband suppression of 10 dB.
We used the Fast Fourier Transform Spectrometer (FFTS) as
backend with a fixed bandwidth of 1.5 GHz
and 1024 channels. We used the two IF groups of the
FFTS with an offset of ![]() 460 MHz between them.
The spectral resolution was smoothed to about 1
460 MHz between them.
The spectral resolution was smoothed to about 1
![]() ,
while the line widths are between 4
,
while the line widths are between 4
![]() and 9
and 9
![]() ,
so they are well resolved.
The on-source integration time per dump and pixel
was 1 s only.
However, oversampling with 4'' spacing, all the seven pixels of CHAMP+
covered a given grid position at least once. So, after adding all the
subscans from both IF channels, and after convolving the maps with the
corresponding beam size, the total integration time in the central
,
so they are well resolved.
The on-source integration time per dump and pixel
was 1 s only.
However, oversampling with 4'' spacing, all the seven pixels of CHAMP+
covered a given grid position at least once. So, after adding all the
subscans from both IF channels, and after convolving the maps with the
corresponding beam size, the total integration time in the central
![]() region
of the maps varied between about 50 and 80 s
per grid cell.
region
of the maps varied between about 50 and 80 s
per grid cell.
The SSB system temperatures are typically
about 2000 K and 6000 K
respectively for the low and high frequency bands. The spatial
resolution varies between 9.4'' for the 13CO
![]() transition
in the low frequency band (at 661 GHz - the nominal beam at
691 GHz is 8.4'') and 7.7'' for the high frequency band
(809 GHz).
All data in the paper were converted to the line brightness temperature
transition
in the low frequency band (at 661 GHz - the nominal beam at
691 GHz is 8.4'') and 7.7'' for the high frequency band
(809 GHz).
All data in the paper were converted to the line brightness temperature
![]() ,
using a forward efficiency (
,
using a forward efficiency (
![]() )
of 0.95 and beam coupling efficiencies (
)
of 0.95 and beam coupling efficiencies (
![]() )
of 0.45 and 0.43 (at 661 GHz and 809 GHz,
respectively) as determined towards Jupiter
)
of 0.45 and 0.43 (at 661 GHz and 809 GHz,
respectively) as determined towards Jupiter![]() (Güsten et al. 2008).
We assumed brightness temperatures of 150 K (at
660 GHz) and 145 (at 815 GHz) for Jupiter (Griffin
et al. 1986).
This coupling efficiency was chosen because in velocity-space (velocity
channels) the size of the M 17 clumps is Jupiter-like, which
had a size
(Güsten et al. 2008).
We assumed brightness temperatures of 150 K (at
660 GHz) and 145 (at 815 GHz) for Jupiter (Griffin
et al. 1986).
This coupling efficiency was chosen because in velocity-space (velocity
channels) the size of the M 17 clumps is Jupiter-like, which
had a size ![]() 38.7''
at the time of the observations.
The calibrated data were reduced with the GILDAS
38.7''
at the time of the observations.
The calibrated data were reduced with the GILDAS![]() package CLASS90.
package CLASS90.
3 Results
3.1 Integrated line temperature maps
![\begin{figure}
\par\includegraphics[width=8.5cm,clip]{13077f1a-cmjn.eps}\par\vspace*{2mm} \includegraphics[width=8.5cm,clip]{13077f1b-cmjn.eps}
\end{figure}](/articles/aa/full_html/2010/02/aa13077-09/img63.png)
|
Figure 1:
Top - Color map of the integrated temperature
of 12CO
|
| Open with DEXTER | |
![\begin{figure}
\par\includegraphics[width=8.5cm,clip]{13077f2a-cmjn.eps}
\end{figure}](/articles/aa/full_html/2010/02/aa13077-09/img64.png)
|
Figure 2:
Color map of the 21 cm continuum emission (Jy beam-1)
in M 17 SW with a
|
| Open with DEXTER | |
![\begin{figure}
\par\includegraphics[width=7.5cm,clip]{13077f3a-cmjn.eps}\par\vspace*{2mm}
\includegraphics[width=7.5cm,clip]{13077f3b-cmjn.eps}
\end{figure}](/articles/aa/full_html/2010/02/aa13077-09/img65.png)
|
Figure 3:
Top panel - strip lines of the velocity
integrated intensities of 12CO J=7-6
(black), 12CO J=6-5
(red), 12CO J=2-1
(green) (adapted from S88), 13CO J=6-5
(blue) and [C I] J=2-1 (cyan) at
|
| Open with DEXTER | |
Figure 1
shows the maps of the temperatures, integrated between 5
![]() and 35
and 35
![]() ,
of
12CO
,
of
12CO
![]() (top) with
the contour lines of 12CO
(top) with
the contour lines of 12CO
![]() ,
and the velocity integrated temperature of 13CO
,
and the velocity integrated temperature of 13CO
![]() (bottom)
with the contour lines corresponding to [C I]
(bottom)
with the contour lines corresponding to [C I]
![]() .
All the maps were convolved to the largest beam size (9.4'') of the
13CO
.
All the maps were convolved to the largest beam size (9.4'') of the
13CO
![]() line, obtaining a grid size of
about
line, obtaining a grid size of
about ![]() .
The peak
integrated temperatures of the 12CO
.
The peak
integrated temperatures of the 12CO
![]() and
and
![]() lines
are 852 K
lines
are 852 K
![]() and 925 K
and 925 K
![]() respectively. These lines follow a similar spatial distribution.
The peak integrated temperatures of 13CO
respectively. These lines follow a similar spatial distribution.
The peak integrated temperatures of 13CO
![]() and
[C I]
and
[C I]
![]() are 420 K
and 282 K.
respectively, and the peak of [C I] is shifted
towards the inner side of the interface region at
about 0.55 pc (
are 420 K
and 282 K.
respectively, and the peak of [C I] is shifted
towards the inner side of the interface region at
about 0.55 pc (![]() 50'').
The ionization front traced by the high resolution (
50'').
The ionization front traced by the high resolution (
![]() )
map of the 21 cm continuum emission (Brogan & Troland 2001) as well as
the ionizing stars identified by Beetz et al. (1976) and Hanson
et al. (1997)
are shown in Fig. 2,
with 12CO
)
map of the 21 cm continuum emission (Brogan & Troland 2001) as well as
the ionizing stars identified by Beetz et al. (1976) and Hanson
et al. (1997)
are shown in Fig. 2,
with 12CO
![]() (white contour lines) and
[C I]
(white contour lines) and
[C I]
![]() (green contour lines)
overlaid. The transition between the hot (
(green contour lines)
overlaid. The transition between the hot (
![]() K) atomic gas and
the warm (
K) atomic gas and
the warm (
![]() K) molecular gas can
be seen due to the almost edge-on geometry of M 17 SW.
K) molecular gas can
be seen due to the almost edge-on geometry of M 17 SW.
The top panel of Fig. 3 shows the
variation of the integrated temperature of all the lines across the
ionization front (strip line at
![]() in
Fig. 1).
Due to the limited S/N the 12CO
in
Fig. 1).
Due to the limited S/N the 12CO
![]() and [C I]
and [C I]
![]() strip lines have been smoothed
spatially with respect to the strip
direction.
The [C I]
strip lines have been smoothed
spatially with respect to the strip
direction.
The [C I]
![]() line
starts peaking up at about 0.1 pc (
line
starts peaking up at about 0.1 pc (![]() 10'') after
the molecular lines and presents a smooth transition towards the inner
part of the cloud, forming a plateau at about
10'') after
the molecular lines and presents a smooth transition towards the inner
part of the cloud, forming a plateau at about
![]() ,
from where it increases its emission until the peak is reached at about
,
from where it increases its emission until the peak is reached at about
![]() .
The peak of [C I] correlates with a secondary peak
seen in 13CO. However, the main peak emission
of the latter correlates with the peak of the 12CO
lines along this strip line.
.
The peak of [C I] correlates with a secondary peak
seen in 13CO. However, the main peak emission
of the latter correlates with the peak of the 12CO
lines along this strip line.
The strip line at
![]() (bottom
panel of Fig. 3) can be
compared with Fig. 5 in M92, and Fig. 2 in S88. At
this position angle, there is no marked plateau in the
[C I] emission, and the peak of the
[C I] line is closer to the peaks of the 12CO
and 13CO lines. The dip in 12CO
(bottom
panel of Fig. 3) can be
compared with Fig. 5 in M92, and Fig. 2 in S88. At
this position angle, there is no marked plateau in the
[C I] emission, and the peak of the
[C I] line is closer to the peaks of the 12CO
and 13CO lines. The dip in 12CO
![]() at
about
at
about ![]() is an artifact.
The integrated temperature of the 12CO
is an artifact.
The integrated temperature of the 12CO
![]() ,
,
![]() and
and
![]() lines have a comparable strength deep (
lines have a comparable strength deep (
![]() )
into the M 17 SW complex.
)
into the M 17 SW complex.
3.2 The complex internal structure of M 17 SW
Figure 4
shows the spectra at selected positions along the NE-SW strip
line at PA
![]() .
The main-beam temperature of the spectra is shifted
by 70 K at each offset position.
This set of spectra can be compared with the 12CO
and C18O
.
The main-beam temperature of the spectra is shifted
by 70 K at each offset position.
This set of spectra can be compared with the 12CO
and C18O
![]() spectra along the same strip
line of Fig. 8 in S88. The warm
gas (
spectra along the same strip
line of Fig. 8 in S88. The warm
gas (
![]() K), traced by the
mid-J 12CO lines,
is as extended as the cold gas (
K), traced by the
mid-J 12CO lines,
is as extended as the cold gas (
![]() K) traced by the 12CO
K) traced by the 12CO
![]() line
deeper into the cloud. On the other hand, the 13CO
line
deeper into the cloud. On the other hand, the 13CO
![]() and [C I]
and [C I]
![]() lines
are strongly detected in a narrower spatial extent of about
1.3 pc, similar to the extent of the C18O
lines
are strongly detected in a narrower spatial extent of about
1.3 pc, similar to the extent of the C18O
![]() emission.
emission.
![\begin{figure}
\par\mbox{\includegraphics[height=14cm,angle=0]{13077f4a.eps}\hsp...
...ce{-0.2cm}
\includegraphics[height=14cm,angle=0]{13077f4d.eps} }
\end{figure}](/articles/aa/full_html/2010/02/aa13077-09/img73.png)
|
Figure 4:
Selected spectra of 12CO
|
| Open with DEXTER | |
Multilevel molecular line observations in CS, 12CO,
13CO and C18O
and in several fine structure lines ([C I], [C II],
[Si II], [O I]) indicate that M 17 SW
consists of numerous high density clumps (
![]() )
from which the [O I], [Si II] and mid-J
CO lines emanate. This dense gas is found within a relatively
warm (
)
from which the [O I], [Si II] and mid-J
CO lines emanate. This dense gas is found within a relatively
warm (![]() 50 K)
and less dense (
50 K)
and less dense (
![]() )
molecular gas (interclump medium), which in turn is surrounded by a
diffuse halo (
)
molecular gas (interclump medium), which in turn is surrounded by a
diffuse halo (
![]() )
which is the source of the very extended [C I] and
[C II] emission (Snell et al. 1984, 1986; Evans
et al. 1987;
S88; SG90; M92).
)
which is the source of the very extended [C I] and
[C II] emission (Snell et al. 1984, 1986; Evans
et al. 1987;
S88; SG90; M92).
From the C18O observations in
M 17 SW a beam-averaged (13'') column density of ![]()
![]() has
been estimated for the cloud core and masses in the range
has
been estimated for the cloud core and masses in the range ![]()
![]() for the CO clumps
(SG90). A comparable mass range (
for the CO clumps
(SG90). A comparable mass range (![]()
![]() )
was lately estimated from submillimeter continuum observations in the
northern part of M 17 (Reid & Wilson 2006), although
the region mapped by Reid & Wilson (2006) adjoins, but
does not overlap with M 17 SW.
)
was lately estimated from submillimeter continuum observations in the
northern part of M 17 (Reid & Wilson 2006), although
the region mapped by Reid & Wilson (2006) adjoins, but
does not overlap with M 17 SW.
Figure 5
shows representative velocity channel maps of the 12CO
![]() (top
left) and
(top
left) and ![]() (top right) lines in M 17 SW. These are the
main-beam brightness temperatures averaged over two and three velocity
channels between 18.2
(top right) lines in M 17 SW. These are the
main-beam brightness temperatures averaged over two and three velocity
channels between 18.2
![]() and 19.9
and 19.9
![]() .
These are similar to the velocity channels shown in Fig. 3 by
SG90. The fact that the C18O
.
These are similar to the velocity channels shown in Fig. 3 by
SG90. The fact that the C18O
![]() line traces colder (
line traces colder (
![]() K) and less dense (
K) and less dense (
![]() )
gas than the 12CO lines is reflected
in the different velocity integrated maps (Fig. 1) and in the
channel maps of these lines. In theory the critical densities (at
)
gas than the 12CO lines is reflected
in the different velocity integrated maps (Fig. 1) and in the
channel maps of these lines. In theory the critical densities (at
![]() K)
of the 12CO
K)
of the 12CO
![]() and
and
![]() lines
are
lines
are
![]() and
and
![]() ,
respectively, which corresponds to a difference of a factor
,
respectively, which corresponds to a difference of a factor ![]() 1.6.
However, this difference is not directly translated into a different
clumpyness. This is reflected in the similar clumpy structure seen in
the channel maps of these mid-J 12CO lines.
1.6.
However, this difference is not directly translated into a different
clumpyness. This is reflected in the similar clumpy structure seen in
the channel maps of these mid-J 12CO lines.
Even though the critical density of the 13CO
![]() line
is similar to that of the 12CO (
line
is similar to that of the 12CO (
![]() )
the south-east region of its channel map (bottom left)
differs from that seen with the 12CO lines.
This could be due to a change in the temperature of the gas, or to a
variation in the 13CO column density
in that region. Since 13CO is much
more optically thin than 12CO (abundance
ratio of about 50-70), this difference in the map can be expected. In
Sects. 4.2 and 4.3 we discuss the optical depths.
)
the south-east region of its channel map (bottom left)
differs from that seen with the 12CO lines.
This could be due to a change in the temperature of the gas, or to a
variation in the 13CO column density
in that region. Since 13CO is much
more optically thin than 12CO (abundance
ratio of about 50-70), this difference in the map can be expected. In
Sects. 4.2 and 4.3 we discuss the optical depths.
On the other hand, the [C I]
![]() channel map (bottom
right) shows a completely
different structure and distribution than the 12CO and
the isotope lines. Since the critical density of this line is about
channel map (bottom
right) shows a completely
different structure and distribution than the 12CO and
the isotope lines. Since the critical density of this line is about
![]() ,
its emission is likely emerging partly from the interclump medium
mentioned above.
,
its emission is likely emerging partly from the interclump medium
mentioned above.
![\begin{figure}
\par\mbox{\includegraphics[width=4.1cm]{13077f5a-cmjn.eps} \hspac...
...\hspace*{6mm}\includegraphics[width=4.1cm]{13077f5d-cmjn.eps} }
\end{figure}](/articles/aa/full_html/2010/02/aa13077-09/img87.png)
|
Figure 5:
Top panel - Channel maps of the main-beam
brightness temperature of 12CO
|
| Open with DEXTER | |
4 Discussion
4.1 Self-absorption in the mid-J 12CO lines?
The complex structure of the 12CO
![]() ,
,
![]() ,
and
,
and ![]() line profiles has been attributed to strong self-absorption effects
(e.g. Rainey et al. 1987;
Stutzki et al. 1988).
Martin et al. (1984)
also reported a flat topped spectrum of 12CO
line profiles has been attributed to strong self-absorption effects
(e.g. Rainey et al. 1987;
Stutzki et al. 1988).
Martin et al. (1984)
also reported a flat topped spectrum of 12CO
![]() ,
attributed to self-absorption or saturation at velocities near the line
center and gave details about the effects of macroturbulent clumpy
medium in the line profiles.
,
attributed to self-absorption or saturation at velocities near the line
center and gave details about the effects of macroturbulent clumpy
medium in the line profiles.
A double peaked structure in the 13CO
![]() line
was also reported by Lada (1976).
Rainey et al. considered that this double peaked structure in 13CO suggests
that either this line is optically thick or that the double peaked
structure is due to more than one cloud component. The latter is the
interpretation favored by Rainey et al. in view of the
available data at that time.
line
was also reported by Lada (1976).
Rainey et al. considered that this double peaked structure in 13CO suggests
that either this line is optically thick or that the double peaked
structure is due to more than one cloud component. The latter is the
interpretation favored by Rainey et al. in view of the
available data at that time.
Phillips et al. (1981)
presented a self-absorption LTE model that considers a 12CO
cloud of uniform temperature ![]() in front of a hot background source of a temperature
in front of a hot background source of a temperature
![]() ,
at the same central velocity. The velocity dispersion of the background
cloud is considered to be larger than that of the foreground cloud,
so the self-absorption effect is seen mostly at the line center.
This model indicates that, depending on the total column density of 12CO,
the self-absorption effect will be stronger in the
,
at the same central velocity. The velocity dispersion of the background
cloud is considered to be larger than that of the foreground cloud,
so the self-absorption effect is seen mostly at the line center.
This model indicates that, depending on the total column density of 12CO,
the self-absorption effect will be stronger in the
![]() and
and
![]() lines than in the
lines than in the ![]() line, with decreasing intensity as the transition number J
increases. This is indeed observed in Fig. 12 of S88
for the 12CO
line, with decreasing intensity as the transition number J
increases. This is indeed observed in Fig. 12 of S88
for the 12CO
![]() ,
,
![]() ,
,
![]() ,
and
,
and ![]() lines.
lines.
We reproduced the model by Phillips et al.
including the higher-J lines of 12CO.
The top panel of Fig. 6 shows
the model with the same background and foreground temperatures used by
Phillips et al.This model implies that, for a background
temperature ![]() K
and a foreground kinetic temperature
K
and a foreground kinetic temperature
![]() K,
the lower-J lines (J=1, 2, 3, 4)
of the background cloud start showing self-absorption at the line
center for lower column densities (
K,
the lower-J lines (J=1, 2, 3, 4)
of the background cloud start showing self-absorption at the line
center for lower column densities (
![]() cm-2 km s-1).
Instead, the higher-J lines (J=5, 6, 7) need larger
columns (
cm-2 km s-1).
Instead, the higher-J lines (J=5, 6, 7) need larger
columns (
![]() cm-2 km s-1)
in order to be affected by self-absorption. For a velocity dispersion
of
cm-2 km s-1)
in order to be affected by self-absorption. For a velocity dispersion
of ![]()
![]() ,
the upper limits of these 12CO
columns would correspond to extinctions
,
the upper limits of these 12CO
columns would correspond to extinctions ![]() of
of ![]() 0.1 mag
and
0.1 mag
and ![]() 10 mag,
respectively.
10 mag,
respectively.
The bottom panel of of Fig. 6 shows
the model for a background temperature
![]() K
and a foreground temperature
K
and a foreground temperature ![]() K
(from S88). In this case the lower-J lines show
self-absorption at the same range of columns as before, while the
higher-J lines start showing self-absorption at a
narrower range of columns (
K
(from S88). In this case the lower-J lines show
self-absorption at the same range of columns as before, while the
higher-J lines start showing self-absorption at a
narrower range of columns (
![]() cm-2 km s-1).
A remarkable characteristic of these models (top and bottom panels of
Fig. 6)
is that all the J lines are expected to be strongly
self-absorbed at columns larger than 1018 cm-2 km s-1,
which is similar to the column density estimated by S88. Another
characteristic is that the 12CO emission
of the higher-J lines are also expected to decrease
with the transition number J, and be weaker than
the low-J lines. However, the 12CO
cm-2 km s-1).
A remarkable characteristic of these models (top and bottom panels of
Fig. 6)
is that all the J lines are expected to be strongly
self-absorbed at columns larger than 1018 cm-2 km s-1,
which is similar to the column density estimated by S88. Another
characteristic is that the 12CO emission
of the higher-J lines are also expected to decrease
with the transition number J, and be weaker than
the low-J lines. However, the 12CO
![]() line
seems to break this rule, as can be seen in Fig. 12 of S88.
The high peak temperature observed in the 12CO
line
seems to break this rule, as can be seen in Fig. 12 of S88.
The high peak temperature observed in the 12CO
![]() line
is missing in the lower-J lines. Even considering a
calibration uncertainty of 20%, the 12CO
line
is missing in the lower-J lines. Even considering a
calibration uncertainty of 20%, the 12CO
![]() line
(observed at offset position
(-100'',0''), bottom panel of Fig. 12 in S88) will be as
strong as the
line
(observed at offset position
(-100'',0''), bottom panel of Fig. 12 in S88) will be as
strong as the ![]() line (at least at the peak intensity) but still stronger than the
line (at least at the peak intensity) but still stronger than the
![]() line.
line.
![\begin{figure}
\par\includegraphics[width=7cm]{13077f6a-cmjn.eps}\par\vspace{2mm}
\includegraphics[width=7cm]{13077f6b-cmjn.eps}
\end{figure}](/articles/aa/full_html/2010/02/aa13077-09/img99.png)
|
Figure 6:
Top panel - expected brightness temperature at
the center of the 12CO lines for a
warm background cloud with a temperature
|
| Open with DEXTER | |
On the other hand, the 12CO
![]() line seems to be asymmetric,
with a left shoulder
weaker than the
right shoulder, which may be due to self-absorption
produced by a colder foreground cloud with slightly lower center
velocity than the warmer clump traced by the
line seems to be asymmetric,
with a left shoulder
weaker than the
right shoulder, which may be due to self-absorption
produced by a colder foreground cloud with slightly lower center
velocity than the warmer clump traced by the
![]() line.
However, that weaker left shoulder of the mid-J
line is still brighter than the corresponding shoulder of the
lower-J lines, in most of the velocity range and in
both positions (-100'',0'')
and (-60'',-30'') - assuming
a low (<10%) uncertainty in the calibration of the data. This is
not what would be expected in the self-absorption scenario proposed by
Phillips et al. (1981).
line.
However, that weaker left shoulder of the mid-J
line is still brighter than the corresponding shoulder of the
lower-J lines, in most of the velocity range and in
both positions (-100'',0'')
and (-60'',-30'') - assuming
a low (<10%) uncertainty in the calibration of the data. This is
not what would be expected in the self-absorption scenario proposed by
Phillips et al. (1981).
Figure 4
shows that the 13CO
![]() line has a similar asymmetry
as the 12CO lines,
at positions (-45'',-23'')
and (-60'',-30''). But it
shows only one component
at the other positions. This difference may be related to a gradient in
the temperature (or total column density) of the foreground cloud that
produces self-absorption in the first two positions, but not in the
others.
Instead, [C I]
line has a similar asymmetry
as the 12CO lines,
at positions (-45'',-23'')
and (-60'',-30''). But it
shows only one component
at the other positions. This difference may be related to a gradient in
the temperature (or total column density) of the foreground cloud that
produces self-absorption in the first two positions, but not in the
others.
Instead, [C I]
![]() shows
similar asymmetry as 12CO at
positions (-45'',-23''),
(-150'',-75'') and
(-180'',-90''), and an opposite asymmetry at position
(-75'',-38''). Given that there is no strong evidence for
self-absorption in neither the 13CO
lines nor in the [C I] lines and that the 13CO lines
are mostly optically thin, it is unlikely that the observed asymmetries
of the 13CO and
[C I] lines are produced by self-absorption. Hence,
we agree with Rainey et al. (1987) in that
this complex structure is more likely due to more than one kinematical
component along the line of sight. And this could also be the case for
the mid-J 12CO lines.
shows
similar asymmetry as 12CO at
positions (-45'',-23''),
(-150'',-75'') and
(-180'',-90''), and an opposite asymmetry at position
(-75'',-38''). Given that there is no strong evidence for
self-absorption in neither the 13CO
lines nor in the [C I] lines and that the 13CO lines
are mostly optically thin, it is unlikely that the observed asymmetries
of the 13CO and
[C I] lines are produced by self-absorption. Hence,
we agree with Rainey et al. (1987) in that
this complex structure is more likely due to more than one kinematical
component along the line of sight. And this could also be the case for
the mid-J 12CO lines.
Therefore, the observational facts and the models suggest that
the self absorption effect, if present, should have little impact on
the mid-J lines, and a few cloud components at
different central velocities could also explain the complex structure
of the line profiles. The asymmetry of the profiles suggests that
self-absorption affects mostly one wing of the line profile, while the
peak temperatures seems to be the least affected velocity channel in
the mid-J lines.
Hence, in the following sections we test the ambient conditions of the
warm gas based on the ratios between the peak main-beam temperatures of
the 12CO and 13CO
![]() and
and
![]() lines.
lines.
4.2 Optical depth and excitation temperature (LTE)
Since we have the maps of the 12CO and
the 13CO
![]() lines, we can estimate the
optical depth and the excitation temperature
of these lines, assuming local thermal equilibrium (LTE), from the
ratio between their peak main-beam temperature
lines, we can estimate the
optical depth and the excitation temperature
of these lines, assuming local thermal equilibrium (LTE), from the
ratio between their peak main-beam temperature
![]() observed
between the 5
observed
between the 5
![]() and 35
and 35
![]() velocity channels. This will
provide at least a lower limit for the kinetic temperature in
M 17 SW. Then we will estimate the ambient conditions at two
selected positions based on a non-LTE model of the ratio between the
peak
velocity channels. This will
provide at least a lower limit for the kinetic temperature in
M 17 SW. Then we will estimate the ambient conditions at two
selected positions based on a non-LTE model of the ratio between the
peak ![]() temperatures of the 12CO
temperatures of the 12CO
![]() and
and
![]() lines
(hereafter referred as 12CO
lines
(hereafter referred as 12CO
![]() line ratio). The temperature
and densities obtained in this way will be
compared to those values estimated in previous work.
line ratio). The temperature
and densities obtained in this way will be
compared to those values estimated in previous work.
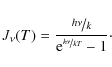
In LTE the radiation temperature can be approximated
(e.g. Kutner 1984;
Bergin et al. 1994)
by the expression:
![\begin{displaymath}T_{\rm R}=[J_{\nu}(T_{\rm ex})-J_{\rm bg}][1-{\rm e}^{-\tau_{\nu}}] ,
\end{displaymath}](/articles/aa/full_html/2010/02/aa13077-09/img101.png)
|
(1) |
where the term
|
(2) |
We use the full
The background radiation
![]() is a
composite between the cosmic microwave background radiation (CMB),
as a blackbody function at 2.73 K, and the diluted
infrared radiation remitted by dust. That is:
is a
composite between the cosmic microwave background radiation (CMB),
as a blackbody function at 2.73 K, and the diluted
infrared radiation remitted by dust. That is:
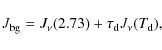
|
(3) |
where
For extended (resolved) sources like the clumps in
M 17 SW, the radiation temperature is well estimated by the
observed main-beam brightness temperature
![]() .
Hence, we use that quantity in the following analysis. From the LTE
approximation we can assume that the excitation temperatures
.
Hence, we use that quantity in the following analysis. From the LTE
approximation we can assume that the excitation temperatures
![]() of 12CO and
13CO
of 12CO and
13CO
![]() are
the same, although the terms
are
the same, although the terms
![]() are
not exactly the same because of the slightly (
are
not exactly the same because of the slightly (![]() 4%)
different frequencies of the 12CO and 13CO lines.
So, from Eq. (1) the ratio between 12CO and
13CO can be approximated as:
4%)
different frequencies of the 12CO and 13CO lines.
So, from Eq. (1) the ratio between 12CO and
13CO can be approximated as:
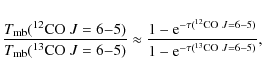
|
(4) |
Following the work by Wilson et al. (1999), we adopt a constant [12CO /13CO
![\begin{figure}
\par\includegraphics[width=8.5cm,clip]{13077f7a-cmjn.eps}\par\vspace*{2mm}
\includegraphics[width=8.5cm,clip]{13077f7b-cmjn.eps}
\end{figure}](/articles/aa/full_html/2010/02/aa13077-09/img119.png)
|
Figure 7:
LTE approximation of the optical depth (top) of the 13CO
|
| Open with DEXTER | |
The top panel in Fig. 7 shows the
![]() map.
The 13CO
line is optically thin in most of the region, with some optically thick
spots (e.g.,
map.
The 13CO
line is optically thin in most of the region, with some optically thick
spots (e.g.,
![]() ). Knowing
). Knowing
![]() we can estimate
we can estimate ![]() from Eq. (2) using either tracer, considering that the
from Eq. (2) using either tracer, considering that the
![]() estimated
using 12CO is just
estimated
using 12CO is just ![]() 0.6% higher
than that estimated using 13CO. The
0.6% higher
than that estimated using 13CO. The
![]() map is shown
in the bottom panel of Fig. 7. This map
indicates
that the warmest gas is located along the ridge of the cloud, close to
the ionization front.
The temperature in this region ranges between 40
and 120 K, and the peak temperature is located at
around (
map is shown
in the bottom panel of Fig. 7. This map
indicates
that the warmest gas is located along the ridge of the cloud, close to
the ionization front.
The temperature in this region ranges between 40
and 120 K, and the peak temperature is located at
around (
![]() ).
If we consider only the gas with temperatures
).
If we consider only the gas with temperatures ![]() 80 K,
the warm gas would be confined to a zone of
about 40'' (
80 K,
the warm gas would be confined to a zone of
about 40'' (![]() 0.44 pc) next to, and along, the HII
region, which agrees with previous results found by Graf
et al. (1993).
If the gas were thermalized, this could be the actual
map of the kinetic temperature of the gas. Otherwise, the
0.44 pc) next to, and along, the HII
region, which agrees with previous results found by Graf
et al. (1993).
If the gas were thermalized, this could be the actual
map of the kinetic temperature of the gas. Otherwise, the
![]() map can be
considered as a lower limit of
map can be
considered as a lower limit of ![]() .
Since in velocity space the clumps cover the whole beam, this would
imply that the 12CO and 13CO molecules
are subthermal in the
.
Since in velocity space the clumps cover the whole beam, this would
imply that the 12CO and 13CO molecules
are subthermal in the ![]() transition. That is, the density of the gas and the column density of 12CO and
13CO may be insufficient to thermalize
these transitions. A more detailed analysis is presented in the next
section.
transition. That is, the density of the gas and the column density of 12CO and
13CO may be insufficient to thermalize
these transitions. A more detailed analysis is presented in the next
section.
![\begin{figure}
\par\includegraphics[width=8cm]{13077f8a-cmjn.eps}\par\vspace*{1m...
...\par\vspace*{1mm}
\includegraphics[width=8cm]{13077f8d-cmjn.eps}
\end{figure}](/articles/aa/full_html/2010/02/aa13077-09/img123.png)
|
Figure 8:
Top - spectra of the four lines observed in
M 17 SW at position A (
|
| Open with DEXTER | |
4.3 Ambient condition at selected positions (non-LTE)
Figure 8
shows the spectra of all the observed lines extracted at four different
positions in the map. The top panel shows the
spectra observed at position A (
![]() ),
close to the peak emission of the 12CO lines.
All the lines show a double component structure with the secondary
component peaking at
),
close to the peak emission of the 12CO lines.
All the lines show a double component structure with the secondary
component peaking at ![]() 25
25
![]() .
The middle top panel shows the spectra at
position B (
.
The middle top panel shows the spectra at
position B (
![]() ),
where the velocity-integrated temperature corresponds to
about 50% of the peak emission. Here only the 12CO
),
where the velocity-integrated temperature corresponds to
about 50% of the peak emission. Here only the 12CO
![]() line
seems to have a dip at the line center. However, because of the low S/N
in the high frequency band, this dip may be likely due to noise.
The middle bottom panel shows the spectra at
position C (
line
seems to have a dip at the line center. However, because of the low S/N
in the high frequency band, this dip may be likely due to noise.
The middle bottom panel shows the spectra at
position C (
![]() ),
which corresponds to the peak of the NE-SW strip scan reported in S88
and Graf et al. (1993),
with beams of 40'' and 8'', respectively. The bottom panel
shows the spectra at position D (
),
which corresponds to the peak of the NE-SW strip scan reported in S88
and Graf et al. (1993),
with beams of 40'' and 8'', respectively. The bottom panel
shows the spectra at position D (
![]() ), which is
close to the continuum far-IR peak, also reported in S88.
Since we do not have dedicated observations at these positions, we
extracted the spectra from the nearest pixels in our maps, convolved to
the largest beam (9.4'') of the 13CO
), which is
close to the continuum far-IR peak, also reported in S88.
Since we do not have dedicated observations at these positions, we
extracted the spectra from the nearest pixels in our maps, convolved to
the largest beam (9.4'') of the 13CO
![]() line. So the spectra shown in
Fig. 8
are the
convolved spectra centered within
line. So the spectra shown in
Fig. 8
are the
convolved spectra centered within ![]() 1'' of the indicated coordinates. This is
justified because we have oversampled data.
1'' of the indicated coordinates. This is
justified because we have oversampled data.
Table 1
shows the Gaussian fits of the spectra obtained at the four selected
positions. Two Gaussian components were needed to fit the lines, except
at position B, where only one component was used. The main
components of the 12CO lines have a
line width that is about 8-9
![]() at position A, while the 13CO has
a
line width of about 3
at position A, while the 13CO has
a
line width of about 3
![]() narrower. The
[C I] line is the narrowest line, with
a line width of
narrower. The
[C I] line is the narrowest line, with
a line width of ![]() 4
4
![]() .
At position B, the 12CO lines
are the widest of the four lines with about 8
.
At position B, the 12CO lines
are the widest of the four lines with about 8
![]() and the 13CO and
[C I] lines have about half the line width of the 12CO lines.
At position C and D the Gaussian parameters of the 12CO
and the 13CO and
[C I] lines have about half the line width of the 12CO lines.
At position C and D the Gaussian parameters of the 12CO
![]() presented
uncertainties of
presented
uncertainties of ![]()
![]() when let free in the fitting. However, because the line shape of the 12CO
when let free in the fitting. However, because the line shape of the 12CO
![]() and
and
![]() transitions are very similar, we set the line width of the
transitions are very similar, we set the line width of the
![]() transition
to the value found for the
transition
to the value found for the
![]() line.
The line width of the main components of the 12CO lines
at position C and D are
line.
The line width of the main components of the 12CO lines
at position C and D are ![]() 6
6
![]() ,
that is about 2
,
that is about 2
![]() narrower than the lines
observed at positions A
and B. This difference can be due to a higher optical depth
towards the latter positions or to the contribution of a few
fast-moving cloudlets (Martin et al. 1984; Graf
et al. 1993).
narrower than the lines
observed at positions A
and B. This difference can be due to a higher optical depth
towards the latter positions or to the contribution of a few
fast-moving cloudlets (Martin et al. 1984; Graf
et al. 1993).
The 12CO
![]() line ratio between the peak
main-beam temperatures
line ratio between the peak
main-beam temperatures ![]() obtained from the Gaussian fit of the main components is
obtained from the Gaussian fit of the main components is
![]() at
position A,
at
position A, ![]() at position B,
at position B, ![]() at position C, and
at position C, and ![]() at position D.
From these line ratios we can estimate the ambient conditions for these
particular positions. We have used the non-LTE radiative transfer code
RADEX
at position D.
From these line ratios we can estimate the ambient conditions for these
particular positions. We have used the non-LTE radiative transfer code
RADEX![]() (Van der Tak et al. 2007) to estimate
the average ambient conditions (kinetic temperature, density and column
density) of the molecular gas. We assumed collisional excitation by
molecular hydrogen. We also assumed an homogeneous spherical symmetry
in the clumps for the escape-probability formalism. The collision rates
between 12CO and ortho- and para-H2
are taken from Wernli et al. (2006), and can
be found in the LAMDA database (Schöier et al. 2005).
As in the LTE case, we used the cosmic microwave background radiation
at 2.73 K, and we also tested the non-LTE model with and
without the infrared radiation remitted by dust (Eq. (3)) as
the background source. It was found also for this case that the dust
continuum emission produces a negligible effect in the non-LTE model at
the frequencies of the 12CO
(Van der Tak et al. 2007) to estimate
the average ambient conditions (kinetic temperature, density and column
density) of the molecular gas. We assumed collisional excitation by
molecular hydrogen. We also assumed an homogeneous spherical symmetry
in the clumps for the escape-probability formalism. The collision rates
between 12CO and ortho- and para-H2
are taken from Wernli et al. (2006), and can
be found in the LAMDA database (Schöier et al. 2005).
As in the LTE case, we used the cosmic microwave background radiation
at 2.73 K, and we also tested the non-LTE model with and
without the infrared radiation remitted by dust (Eq. (3)) as
the background source. It was found also for this case that the dust
continuum emission produces a negligible effect in the non-LTE model at
the frequencies of the 12CO
![]() and
and
![]() lines.
We explored molecular hydrogen densities between
lines.
We explored molecular hydrogen densities between
![]() and
and
![]() ,
temperatures between 5 K and 500 K, and 12CO column
densities between
,
temperatures between 5 K and 500 K, and 12CO column
densities between ![]() and
and ![]() .
.
Figure 9
shows the possible ambient conditions required to reproduce the 12CO
![]() line
ratios, and the peak
line
ratios, and the peak ![]() of the 12CO
of the 12CO
![]() line observed at position A (top
panel) and B (bottom
panel). A wide range of temperatures (100-450 K) and
densities (>
line observed at position A (top
panel) and B (bottom
panel). A wide range of temperatures (100-450 K) and
densities (>
![]() )
are possible solutions for a 12CO column
density per line width
)
are possible solutions for a 12CO column
density per line width
![]()
![]() .
.
Table 1: M 17 SW line parameters derived from Gaussian fits, at four selected positions.
![\begin{figure}
\par\includegraphics[width=8cm,clip]{13077f9a.eps}\par\vspace*{2mm}
\includegraphics[width=8cm,clip]{13077f9b.eps} \end{figure}](/articles/aa/full_html/2010/02/aa13077-09/img140.png)
|
Figure 9:
Top - the gray scale and contours represent
the average ( |
| Open with DEXTER | |
![\begin{figure}
\par\includegraphics[width=8cm,clip]{13077f9c.eps}\par\vspace*{2mm}
\includegraphics[width=8cm,clip]{13077f9d.eps}
\end{figure}](/articles/aa/full_html/2010/02/aa13077-09/img141.png)
|
Figure 10:
Top - the gray scale and contours represent
the average ( |
| Open with DEXTER | |
Figure 10 shows the possible ambient conditions estimated for position C (top panel) and D (bottom panel). The combinations of temperatures and densities required to reproduce the line ratios and peak temperatures are similar to those found for position A and B, although the range of possible temperatures (for a given density) at position D is larger than at the other positions. The column densities differ due to the different line strengths observed at the four positions (Table 1).
In order to constrain the range of solutions we can adopt the
average ![]() density estimated by M92, which is also similar to the mean density of
the clumps estimated by SG90. This is a sensitive assumption for a
collision dominated scenario since this density is larger than the
critical density of both 12CO lines
for
density estimated by M92, which is also similar to the mean density of
the clumps estimated by SG90. This is a sensitive assumption for a
collision dominated scenario since this density is larger than the
critical density of both 12CO lines
for ![]() K.
However, at this density (
K.
However, at this density (
![]() )
the temperature cannot be higher than 230 K in order to
reproduce the line ratio and the peak
)
the temperature cannot be higher than 230 K in order to
reproduce the line ratio and the peak
![]() of the 12CO
of the 12CO
![]() line observed at position A.
And it cannot be higher than
150 K at position B. At position C the limit is about
220 K, and at position D it is
about 200 K.
These are lower kinetic temperatures than the 1000 K estimated
for the dense clumps in the three-component model proposed by M92. Our
upper limits for the kinetic temperature agree with the results
reported in previous work (e.g Harris et al. 1987; S88;
SG90).
From the map of the excitation temperature
line observed at position A.
And it cannot be higher than
150 K at position B. At position C the limit is about
220 K, and at position D it is
about 200 K.
These are lower kinetic temperatures than the 1000 K estimated
for the dense clumps in the three-component model proposed by M92. Our
upper limits for the kinetic temperature agree with the results
reported in previous work (e.g Harris et al. 1987; S88;
SG90).
From the map of the excitation temperature
![]() estimated
from the LTE model (Fig. 7), the lower
limits for
estimated
from the LTE model (Fig. 7), the lower
limits for ![]() would be
would be ![]() 110 K
and
110 K
and ![]() 80 K
at position A & C and B & D, respectively. These are
similar (within 30%) to the lowest temperatures obtained with the
non-LTE models (Figs. 9 and 10).
80 K
at position A & C and B & D, respectively. These are
similar (within 30%) to the lowest temperatures obtained with the
non-LTE models (Figs. 9 and 10).
According to the radiative transfer model, temperatures up to
400 K and higher are also possible, but they require densities
of <
![]() in order to reproduce the
observed line ratios and peak temperatures.
These densities and temperatures are consistent with the estimates made
based on previous observations of the 12CO
in order to reproduce the
observed line ratios and peak temperatures.
These densities and temperatures are consistent with the estimates made
based on previous observations of the 12CO
![]() and
and
![]() lines (Harris et al. 1987;
SG90). On the other hand, clumps with densities of >
lines (Harris et al. 1987;
SG90). On the other hand, clumps with densities of >
![]() could also reproduce the
observed ratios and peak
could also reproduce the
observed ratios and peak ![]() in all the positions at temperatures
in all the positions at temperatures ![]() 200 K. However, these would be at the
lower limit of the temperature range estimated in Harris
et al. (1987)
and SG90. The densities and temperatures found for M 17 SW are
similar to those found in W3 Main (Kramer et al. 2004), but
higher (although compatible) than the kinetic temperatures found in
Carina, where lower limits between 30 K and 50 K were
estimated (Kramer et al. 2008).
200 K. However, these would be at the
lower limit of the temperature range estimated in Harris
et al. (1987)
and SG90. The densities and temperatures found for M 17 SW are
similar to those found in W3 Main (Kramer et al. 2004), but
higher (although compatible) than the kinetic temperatures found in
Carina, where lower limits between 30 K and 50 K were
estimated (Kramer et al. 2008).
4.3.1 Column densities at selected positions
The column density per line width
![]() at
position A varies over a small range of
at
position A varies over a small range of
![]() .
If we consider an average line width of 8.7
.
If we consider an average line width of 8.7
![]() estimated for the 12CO
estimated for the 12CO
![]() and
and ![]() lines (Table 1)
and the average
lines (Table 1)
and the average
![]() ,
we have a total column density of
,
we have a total column density of
![]() .
.
The model indicates that at position B the 12CO column
density per line width would be ![]()
![]() .
The average line width of the lines at position B is
.
The average line width of the lines at position B is ![]() 7.7
7.7
![]() (Table 1), which
gives a total column density of
(Table 1), which
gives a total column density of
![]() ,
similar to the column found at position A. At positions C and D the
average column densities per line width are
,
similar to the column found at position A. At positions C and D the
average column densities per line width are ![]()
![]() and
and
![]()
![]() ,
respectively. Considering a line width of
,
respectively. Considering a line width of ![]() 6
6
![]() we obtain similar column
densities as in the previous two positions.
That is
we obtain similar column
densities as in the previous two positions.
That is
![]() and
and
![]() for
positions C and D, respectively. At positions A
and C the lines are optically thin, with
for
positions C and D, respectively. At positions A
and C the lines are optically thin, with ![]() ranging from about 0.6 to 1 for
ranging from about 0.6 to 1 for
![]() K.
At temperatures of
K.
At temperatures of ![]() K,
the lines become optically thick (
K,
the lines become optically thick (
![]() ). The optically thin limit at
positions B and D is reached at
). The optically thin limit at
positions B and D is reached at
![]() K,
with about the same ranges of optical depths as before, for
temperatures higher or lower than 120 K.
K,
with about the same ranges of optical depths as before, for
temperatures higher or lower than 120 K.
Assuming a density of
![]() and
average temperatures of 200 K at position A and
150 K at position B, the non-LTE model indicates that
13CO column densities of
and
average temperatures of 200 K at position A and
150 K at position B, the non-LTE model indicates that
13CO column densities of ![]()
![]() and
and
![]()
![]() would be required to reproduce the observed strength (Table 1) of the 13CO
would be required to reproduce the observed strength (Table 1) of the 13CO
![]() line
at these positions, respectively. For a temperature of 200 K,
the 13CO column density at position C
and D would be
line
at these positions, respectively. For a temperature of 200 K,
the 13CO column density at position C
and D would be ![]()
![]() .
And the excitation temperatures would be
.
And the excitation temperatures would be ![]() 180 K at position A, C and D, and
180 K at position A, C and D, and ![]() 140 K
at position B, which are higher temperatures than estimated
with the LTE approximation. However, these excitation temperatures are
just between 10 and 20 K lower than the assumed kinetic
temperatures, which indicates that these lines are close
(within 10%) to the thermal equilibrium.
140 K
at position B, which are higher temperatures than estimated
with the LTE approximation. However, these excitation temperatures are
just between 10 and 20 K lower than the assumed kinetic
temperatures, which indicates that these lines are close
(within 10%) to the thermal equilibrium.
From their C18O
![]() observations, S88 estimated a 12CO beam-averaged
column density of
observations, S88 estimated a 12CO beam-averaged
column density of ![]()
![]() ,
considering a [12CO]/[C18O]
abundance ratio of 500. Hence, the column densities found for
the four selected positions in M 17 SW suggest that the warm (
,
considering a [12CO]/[C18O]
abundance ratio of 500. Hence, the column densities found for
the four selected positions in M 17 SW suggest that the warm (
![]() K) and dense (
K) and dense (
![]() )
gas traced by the mid-J 12CO lines
represent
)
gas traced by the mid-J 12CO lines
represent ![]() 2%
of the bulk of the cold (
2%
of the bulk of the cold (
![]() K) and less dense (
K) and less dense (
![]() )
gas traced by the low-J 12CO lines.
)
gas traced by the low-J 12CO lines.
4.3.2 Volume-filling factors
The clump volume-filling factor
![]() can
be estimated from the ratio between the average volume density
can
be estimated from the ratio between the average volume density
![]() per beam and
the average clump density
per beam and
the average clump density
![]() derived
from the non-LTE model (e.g. Kramer et al. 2004).
The average volume density per beam can be estimated from the total
column density of the gas and the line of sight extent of the cloud (
derived
from the non-LTE model (e.g. Kramer et al. 2004).
The average volume density per beam can be estimated from the total
column density of the gas and the line of sight extent of the cloud (
![]() ). That is
). That is
![]() .
Following the work by Howe et al. (2000) we can
assume a 13CO abundance ratio of
.
Following the work by Howe et al. (2000) we can
assume a 13CO abundance ratio of
![]() relative
to H2, and estimate the hydrogen column
densities of
relative
to H2, and estimate the hydrogen column
densities of
![]() ,
,
![]() ,
and
,
and
![]() ,
for the four selected positions.
,
for the four selected positions.
The line of sight extent of the cloud is a difficult parameter
to estimate. From a 13'' (![]() 0.14 pc)
beam-averaged column density of
0.14 pc)
beam-averaged column density of
![]() ,
a volume-filling factor of 0.13 was estimated by SG90. While
Howe et al. (2000)
reported a
,
a volume-filling factor of 0.13 was estimated by SG90. While
Howe et al. (2000)
reported a ![]() of
of ![]() 0.002
from the total column density of
0.002
from the total column density of
![]() estimated
at the peak column density of their 13CO
estimated
at the peak column density of their 13CO
![]() map,
and assuming a cloud extent of 3 pc, which was deconvolved
from the 4' beam of the SWAS space telescope. The line of sight extent
should be larger than the smallest possible clump size (
map,
and assuming a cloud extent of 3 pc, which was deconvolved
from the 4' beam of the SWAS space telescope. The line of sight extent
should be larger than the smallest possible clump size (![]() 0.1 pc)
that we can deconvolve from our 9.4'' beam. But we do not think it can
be as large as 3 pc, which is about the size of the maps we
present here. This holds true at least for the region of bright 12CO and
13CO emission close to the ionization
front, where our four selected positions are taken from. If we take the
average between the upper (3 pc) and lower (0.1 pc)
limits of the cloud extent, we would obtain a cloud size of
0.1 pc)
that we can deconvolve from our 9.4'' beam. But we do not think it can
be as large as 3 pc, which is about the size of the maps we
present here. This holds true at least for the region of bright 12CO and
13CO emission close to the ionization
front, where our four selected positions are taken from. If we take the
average between the upper (3 pc) and lower (0.1 pc)
limits of the cloud extent, we would obtain a cloud size of ![]() 1.6 pc.
This line of size extent of the cloud is uncertain, but perhaps more
realistic given the geometry of M 17 SW and the high
resolution of our maps. Besides, it is similar to the diameter of the
[C I] emitting region (
1.6 pc.
This line of size extent of the cloud is uncertain, but perhaps more
realistic given the geometry of M 17 SW and the high
resolution of our maps. Besides, it is similar to the diameter of the
[C I] emitting region (![]() 1 pc) estimated by
Genzel et al. (1988),
and the narrow spatial extension (
1 pc) estimated by
Genzel et al. (1988),
and the narrow spatial extension (![]() 1.3 pc) of the 13CO
1.3 pc) of the 13CO
![]() and [C I] 370
and [C I] 370 ![]() m lines along the strip line at
m lines along the strip line at
![]() (Figs. 3
and 4).
(Figs. 3
and 4).
Using the total column densities estimated for the four
selected positions and ![]() pc,
the average volume densities at position A and B would be
pc,
the average volume densities at position A and B would be ![]()
![]() and
and
![]()
![]() ,
respectively, and
,
respectively, and ![]()
![]() at
position C and D. This in turn yields
volume-filling factors
at
position C and D. This in turn yields
volume-filling factors
![]() of
of ![]() 0.106,
0.106, ![]() 0.050 and
0.038 at positions A, B and C/D respectively. These
volume-filling factors, as well as the total hydrogen densities
estimated here, are larger than those estimated by Howe et al.
(2000), but
smaller than the ones reported in SG90. This is an expected and
reasonable result since the 13CO
0.050 and
0.038 at positions A, B and C/D respectively. These
volume-filling factors, as well as the total hydrogen densities
estimated here, are larger than those estimated by Howe et al.
(2000), but
smaller than the ones reported in SG90. This is an expected and
reasonable result since the 13CO
![]() line traces only the warm and
dense clumps and not the interclump
medium. Besides, the volume-filling factors estimated at the four
selected positions agree closely with those estimated in other
star-forming regions using clumpy PDR models (e.g. S140, W3 Main;
Spaans & van Dishoeck 1997;
Kramer et al. 2004).
line traces only the warm and
dense clumps and not the interclump
medium. Besides, the volume-filling factors estimated at the four
selected positions agree closely with those estimated in other
star-forming regions using clumpy PDR models (e.g. S140, W3 Main;
Spaans & van Dishoeck 1997;
Kramer et al. 2004).
4.3.3 Jeans stability of the clumps
With an average density of
![]() and
an average clump size of 0.2 pc in diameter, which gives a
typical total clump mass of
and
an average clump size of 0.2 pc in diameter, which gives a
typical total clump mass of ![]() 100
100 ![]() in molecular hydrogen, M92 estimated that these clumps are not in
pressure equilibrium with the interclump gas (with average density
in molecular hydrogen, M92 estimated that these clumps are not in
pressure equilibrium with the interclump gas (with average density
![]() and
temperature of 200 K), but rather that they are
self-gravitating. With these parameters and a temperature of about
1000 K, the Jeans mass and radius should be about
and
temperature of 200 K), but rather that they are
self-gravitating. With these parameters and a temperature of about
1000 K, the Jeans mass and radius should be about
![]() and
0.3 pc, respectively. Hence these clumps are not near the
collapsing regime. Even with our upper limits for the temperatures of
the clumps of 230 K and 150 K at position A and B,
and 220 K and 200 K at position C and D,
respectively, the Jeans mass and radius of these clumps would still be
larger than those estimated with the average density of
and
0.3 pc, respectively. Hence these clumps are not near the
collapsing regime. Even with our upper limits for the temperatures of
the clumps of 230 K and 150 K at position A and B,
and 220 K and 200 K at position C and D,
respectively, the Jeans mass and radius of these clumps would still be
larger than those estimated with the average density of
![]() .
Temperatures of <170 K would be required to break the
Jeans stability at that density. This means that the clumps at
position B should have a slightly lower density of
.
Temperatures of <170 K would be required to break the
Jeans stability at that density. This means that the clumps at
position B should have a slightly lower density of ![]()
![]() (or
lower) to be Jeans-stable at a temperature of about 150 K
(or higher).
(or
lower) to be Jeans-stable at a temperature of about 150 K
(or higher).
4.4 Follow-up work
A higher resolution map of the 609 ![]() m (492 GHz)
m (492 GHz)
![]() fine-structure
transition of [C I] will be obtained
with FLASH on APEX, in order to constrain the ambient conditions of the
interclump medium and the halo in M 17 SW.
More complex radiative transfer codes like RATRAN (Hogerheijde
& van der Tak 2000)
and
fine-structure
transition of [C I] will be obtained
with FLASH on APEX, in order to constrain the ambient conditions of the
interclump medium and the halo in M 17 SW.
More complex radiative transfer codes like RATRAN (Hogerheijde
& van der Tak 2000)
and ![]() (Poelman & Spaans 2005),
will be used to model the internal dynamics, temperature and density
structure of individual clouds. The models will also allow us to
explore in detail the effect of absorbing foreground clouds, or
multiple cloud components, in the line profiles. Our PDR code
(Meijerink & Spaans 2005)
will provide the abundances of the molecular and atomic species,
according to the UV flux estimated from historical data and our mid-J
lines data. All together, these models will aid to test and constrain
the heating and cooling of the irradiated gas.
(Poelman & Spaans 2005),
will be used to model the internal dynamics, temperature and density
structure of individual clouds. The models will also allow us to
explore in detail the effect of absorbing foreground clouds, or
multiple cloud components, in the line profiles. Our PDR code
(Meijerink & Spaans 2005)
will provide the abundances of the molecular and atomic species,
according to the UV flux estimated from historical data and our mid-J
lines data. All together, these models will aid to test and constrain
the heating and cooling of the irradiated gas.
5 Conclusions
We have used the dual-color heterodyne receiver array
of 7 pixels CHAMP+ on the APEX
telescope to map a region of about 3.4 pc ![]() 3.0 pc
in the
3.0 pc
in the ![]() and
and ![]() lines of 12CO, the 13CO
lines of 12CO, the 13CO
![]() and
the
and
the ![]() 370
370 ![]() m (
m (
![]() )
fine-structure transition of [C I] in M 17
SW nebula.
)
fine-structure transition of [C I] in M 17
SW nebula.
The completely different structure and distribution of the
![]() 370
370 ![]() m
emission and its critical density indicate that this emission arises
from the interclump medium (
m
emission and its critical density indicate that this emission arises
from the interclump medium (![]()
![]() ).
On the other hand, the mid-J lines of 12CO and
the isotope emissions arise from the high density (
).
On the other hand, the mid-J lines of 12CO and
the isotope emissions arise from the high density (![]()
![]() )
and clumpy region.
)
and clumpy region.
The spatial extent of the warm gas (40-230 K) traced
by the 12CO
![]() line is about 2.2 pc
from the ridge of the M 17 SW
complex, which is smaller than the extent observed in the low-J
12CO and C18O
lines reported in previous work. The 13CO
line is about 2.2 pc
from the ridge of the M 17 SW
complex, which is smaller than the extent observed in the low-J
12CO and C18O
lines reported in previous work. The 13CO
![]() and [C I] 370
and [C I] 370 ![]() m lines, have a narrower spatial extent of about
1.3 pc along a strip line at
m lines, have a narrower spatial extent of about
1.3 pc along a strip line at
![]() .
.
An LTE approximation of the excitation temperature provides
lower limits for the kinetic temperature. The warmest gas is located
along the ridge of the cloud, close to the ionization front. In this
region the excitation temperatures range between 40
and 120 K. A non-LTE estimate of the ambient
conditions at four selected positions of M 17 SW indicates
that the high density clumps (![]()
![]() )
cannot have temperatures higher than 230 K. The warm (
)
cannot have temperatures higher than 230 K. The warm (
![]() K) and dense (
K) and dense (
![]() )
gas traced at the four selected positions by the mid-J
12CO lines represents
)
gas traced at the four selected positions by the mid-J
12CO lines represents ![]() % of the
bulk of the molecular gas traced by the low-J 12CO lines.
Volume-filling factors of the warm gas ranging from 0.04 to 0.11 were
found at these positions.
% of the
bulk of the molecular gas traced by the low-J 12CO lines.
Volume-filling factors of the warm gas ranging from 0.04 to 0.11 were
found at these positions.
We are grateful to the MPfIR team and the APEX staff for their help and support during and after the observations. We are grateful to J. Stutzki for providing the low-J 12CO data and to C. Brogan for providing the 21 cm map. We thank the referee for the careful reading of the manuscript and constructive comments. Molecular Databases that have been helpful include the NASA/JPL, LAMDA and NIST. The construction of CHAMP+ is a collaboration between the Max-Planck-Institut für Radioastronomie Bonn, SRON Groningen, the Netherlands Research School for Astronomy (NOVA), and the Kavli Institute of Nanoscience at Delft University of Technology, with support from the Netherlands Organization for Scientific Research (NWO) grant 600.063.310.10.
References
- Bayet, E., Gerin, M., Phillips, T. G., & Contursi, A. 2006, A&A, 460, 467 [NASA ADS] [CrossRef] [EDP Sciences] [Google Scholar]
- Beetz, M., Elsaesser, H., Weinberger, R., & Poulakos, C. 1976, A&A, 50, 41 [NASA ADS] [Google Scholar]
- Bergin, E. A., Goldsmith, P. F., Snell, R. L., & Ungerechts, H. 1994, ApJ, 431, 674 [NASA ADS] [CrossRef] [Google Scholar]
- Bergin, E. A., Snell, R. L., & Goldsmith, P. F. 1996, ApJ, 460, 343 [NASA ADS] [CrossRef] [Google Scholar]
- Brogan, C. L., & Troland, T. H. 2001, ApJ, 560, 821 [NASA ADS] [CrossRef] [Google Scholar]
- Evans, N. J., II, Davis, J. H., Mundy, L. G., & Vanden Bout, P. 1987, ApJ, 312, 344 [NASA ADS] [CrossRef] [Google Scholar]
- Felli, M., Churchwell, E., & Massi, M. 1984, A&A, 136, 53 [NASA ADS] [Google Scholar]
- Fixsen, D. J., Bennett, C. L., & Mather, J. C. 1999, ApJ, 526, 207 [NASA ADS] [CrossRef] [Google Scholar]
- Genzel, R., Harris, A. I., Stutzki, J., & Jaffe, D. T. 1988, ApJ, 332, 1049 [NASA ADS] [CrossRef] [Google Scholar]
- Gerin, M., & Phillips, T. G. 1998, ApJ, 509, L17 [NASA ADS] [CrossRef] [Google Scholar]
- Graf, U. U., Eckart, A., Genzel, R., et al. 1993, ApJ, 405, 249 [NASA ADS] [CrossRef] [Google Scholar]
- Griffin, M. J., Ade, P. A. R., Orton, G. S., et al. 1986, Icarus, 65, 244 [NASA ADS] [CrossRef] [Google Scholar]
- Güsten, R., & Fiebig, D. 1988, A&A, 204, 253 [NASA ADS] [Google Scholar]
- Güsten, R., Nyman, L. A., Schilke, P., et al. 2006, A&A, 454, L13 [NASA ADS] [CrossRef] [EDP Sciences] [Google Scholar]
- Güsten, R., Baryshev, A., Bell, A., et al. 2008, Proc. SPIE, 7020, 25 [Google Scholar]
- Habing, H. J. 1968, Bull. Astr. Inst. Netherlands, 19, 421 [Google Scholar]
- Hogerheijde, M. R., & van der Tak, F. F. S. 2000, A&A, 362, 697 [NASA ADS] [Google Scholar]
- Hanson, M. M., Howarth, I. D., & Conti, P. S. 1997, ApJ, 489, 698 [NASA ADS] [CrossRef] [Google Scholar]
- Harris, A. I., Stutzki, J., Genzel, R., et al. 1987, ApJ, 322L, 49 [Google Scholar]
- Howe, J. E., Ashby, M. L. N., Bergin, E. A., et al. 2000, ApJ, 539, L137 [NASA ADS] [CrossRef] [Google Scholar]
- Icke, V., Gatley, I., & Israel, F. P. 1980, ApJ, 236, 808 [NASA ADS] [CrossRef] [Google Scholar]
- Jaffe, D. T., Harris, A. I., & Genzel, R. 1987, ApJ, 316, 231 [NASA ADS] [CrossRef] [Google Scholar]
- Jakob, H., Kramer, C., Simon, R., et al. 2007, A&A, 461, 999 [NASA ADS] [CrossRef] [EDP Sciences] [Google Scholar]
- Kasemann, C., Güsten, R., Heyminck, S., et al. 2006, Proc. of the SPIE, 6275, 19 [NASA ADS] [Google Scholar]
- Kaufman, M., Wolfire, M., Hollenbach, D., & Luhman, M. 1999, ApJ, 527, 795 [NASA ADS] [CrossRef] [Google Scholar]
- Keene, J., Blake, G. A., Phillips, T. G., Huggins, P. J., & Beichman, C. A. 1985, ApJ, 299, 967 [NASA ADS] [CrossRef] [Google Scholar]
- Kramer, C., Stutzki, J., Rohrig, R., & Corneliussen, U. 1998, A&A, 329, 249 [NASA ADS] [Google Scholar]
- Kramer, C., Jakob, H., Mookerjea, B., et al. 2004, A&A, 424, 887 [NASA ADS] [CrossRef] [EDP Sciences] [Google Scholar]
- Kramer, C., Mookerjea, B., Bayet, E., et al. 2005, A&A, 441, 961 [NASA ADS] [CrossRef] [EDP Sciences] [Google Scholar]
- Kramer, C., Cubick, M., Röllig, M., et al. 2008, A&A, 477, 547 [NASA ADS] [CrossRef] [EDP Sciences] [Google Scholar]
- Kutner, M. L. 1984, Fund. Cosmic Phys., 9, 233 [NASA ADS] [Google Scholar]
- Lada, C. J. 1976, ApJS, 32, 603 [NASA ADS] [CrossRef] [Google Scholar]
- Langer, W. D., & Penzias, A. A. 1990, ApJ, 357, 477 [NASA ADS] [CrossRef] [Google Scholar]
- Martin, H. M., Sanders, D. B., & Hills, R. E. 1984, MNRAS, 208, 35 [NASA ADS] [CrossRef] [Google Scholar]
- Meixner, M., Haas, M. R., Tielens, A. G. G. M., Erickson, E. F., & Werner, M. 1992, ApJ, 390, 499 (M92) [NASA ADS] [CrossRef] [Google Scholar]
- Meijerink, R., & Spaans, M. 2005, A&A, 436, 397 (MS05) [NASA ADS] [CrossRef] [EDP Sciences] [Google Scholar]
- Meijerink, R., Spaans, M., & Israel, F. P. 2007, A&A, 461, 793 [NASA ADS] [CrossRef] [EDP Sciences] [Google Scholar]
- Mookerjea, B., Ghosh, S., Kaneda, H., et al. 2003, A&A, 404, 569 [NASA ADS] [CrossRef] [EDP Sciences] [Google Scholar]
- Muders, D., Hafok, H., Wyrowski, F., et al. 2006, A&A, 454, L25 [NASA ADS] [CrossRef] [EDP Sciences] [Google Scholar]
- Pellegrini, E. W., Baldwin, J. A., Brogan, C. L., et al. 2007, ApJ, 658, 1119 [NASA ADS] [CrossRef] [Google Scholar]
- Phillips, T. G., Knapp, G. R., Wannier, P. G., et al. 1981, ApJ, 245, 512 [NASA ADS] [CrossRef] [Google Scholar]
- Poelman, D. R., & Spaans, M. 2005, A&A, 440, 559 [NASA ADS] [CrossRef] [EDP Sciences] [Google Scholar]
- Povich, M. S., Churchwell, Ed., Bieging, J. H., et al. 2009, ApJ, 696, 1278 [NASA ADS] [CrossRef] [Google Scholar]
- Rainey, R., White, G. J., Gatley, I., et al. 1987, A&A, 171, 252 [NASA ADS] [Google Scholar]
- Reid, M. A., & Wilson, C. D. 2006, ApJ, 644, 990 [NASA ADS] [CrossRef] [Google Scholar]
- Schilke, P., Walmsley, C. M., Pineau de Forêst, G., et al. 1992, A&A, 256, 595 (S92) [NASA ADS] [Google Scholar]
- Schneider, N., Simon, R., Kramer, C., Stutzki, J., & Bontemps, S. 2002, A&A, 384, 225 [NASA ADS] [CrossRef] [EDP Sciences] [Google Scholar]
- Schneider, N., Simon, R., Kramer, C., et al. 2003, A&A, 406, 915 [NASA ADS] [CrossRef] [EDP Sciences] [Google Scholar]
- Schöier, F. L., van der Tak, F. F. S., van Dishoeck, E. F., & Black, J. H. 2005, A&A, 432, 369 [NASA ADS] [CrossRef] [EDP Sciences] [Google Scholar]
- Snell, R. L., Goldsmith, P. F., Erickson, N. R., Mundy, L. G., & Evans, N. J., II 1984, ApJ, 276, 625 [NASA ADS] [CrossRef] [Google Scholar]
- Snell, R. L., Erickson, N. R., Goldsmith, P. F., et al. 1986, ApJ, 304, 780 [NASA ADS] [CrossRef] [Google Scholar]
- Snell, R. L., Howe, J. E., Ashby, M. L. N., et al. 2000, ApJ, 539, L97 [NASA ADS] [CrossRef] [Google Scholar]
- Spaans, M., & van Dishoeck, E. F. 1997, A&A, 323, 953 [NASA ADS] [Google Scholar]
- Stutzki, J., & Güsten, R. 1990, ApJ, 356, 513 (SG90) [NASA ADS] [CrossRef] [Google Scholar]
- Stutzki, J., Stacey, G. J., Genzel, R., et al. 1988, ApJ, 332, 379 (S88) [NASA ADS] [CrossRef] [Google Scholar]
- Van der Tak, F. F. S., Black, J. H., Schöier, F. L., Jansen, D. J., & van Dishoeck, E. F. 2007, A&A, 468, 627 [NASA ADS] [CrossRef] [EDP Sciences] [Google Scholar]
- Wang, Y., Jaffe, D. T., Evans, N. J., II, et al. 1993, ApJ, 419, 707 [NASA ADS] [CrossRef] [Google Scholar]
- Weiss, A., Henkel, C., Downes, D., & Walter, F. 2003, A&A, 409, 41 [Google Scholar]
- Wernli, M., Valiron, P., Faure, A., et al. 2006, A&A, 446, 367 [NASA ADS] [CrossRef] [EDP Sciences] [Google Scholar]
- Wilson, C. D., Howe, J. E., & Balogh, M. L. 1999, ApJ, 517, 174 [NASA ADS] [CrossRef] [Google Scholar]
- Yamamoto, S., Maezawa, H., Ikeda, M., et al. 2001, ApJ, 547, L165 [NASA ADS] [CrossRef] [Google Scholar]
Footnotes
- ... (APEX
![[*]](/icons/foot_motif.png)
- This publication is based on data acquired with the Atacama Pathfinder Experiment (APEX). APEX is a collaboration between the Max-Planck-Institut fur Radioastronomie, the European Southern Observatory, and the Onsala Space Observatory.
- ... Jupiter
- http://www.mpifr.de/div/submmtech/heterodyne/champplus/ champmain.html
- ... GILDAS
- http://www.iram.fr/IRAMFR/GILDAS
- ... RADEX
- http://www.sron.rug.nl/ vdtak/radex/radex_manual.pdf
All Tables
Table 1: M 17 SW line parameters derived from Gaussian fits, at four selected positions.
All Figures
|
|
Figure 1:
Top - Color map of the integrated temperature
of 12CO
|
| Open with DEXTER | |
| In the text | |
|
|
Figure 2:
Color map of the 21 cm continuum emission (Jy beam-1)
in M 17 SW with a
|
| Open with DEXTER | |
| In the text | |
|
|
Figure 3:
Top panel - strip lines of the velocity
integrated intensities of 12CO J=7-6
(black), 12CO J=6-5
(red), 12CO J=2-1
(green) (adapted from S88), 13CO J=6-5
(blue) and [C I] J=2-1 (cyan) at
|
| Open with DEXTER | |
| In the text | |
|
|
Figure 4:
Selected spectra of 12CO
|
| Open with DEXTER | |
| In the text | |
|
|
Figure 5:
Top panel - Channel maps of the main-beam
brightness temperature of 12CO
|
| Open with DEXTER | |
| In the text | |
|
|
Figure 6:
Top panel - expected brightness temperature at
the center of the 12CO lines for a
warm background cloud with a temperature
|
| Open with DEXTER | |
| In the text | |
|
|
Figure 7:
LTE approximation of the optical depth (top) of the 13CO
|
| Open with DEXTER | |
| In the text | |
|
|
Figure 8:
Top - spectra of the four lines observed in
M 17 SW at position A (
|
| Open with DEXTER | |
| In the text | |
|
|
Figure 9:
Top - the gray scale and contours represent
the average ( |
| Open with DEXTER | |
| In the text | |
|
|
Figure 10:
Top - the gray scale and contours represent
the average ( |
| Open with DEXTER | |
| In the text | |
Copyright ESO 2010
Current usage metrics show cumulative count of Article Views (full-text article views including HTML views, PDF and ePub downloads, according to the available data) and Abstracts Views on Vision4Press platform.
Data correspond to usage on the plateform after 2015. The current usage metrics is available 48-96 hours after online publication and is updated daily on week days.
Initial download of the metrics may take a while.