


| Issue |
A&A
Volume 710, June 2026
|
|
|---|---|---|
| Article Number | A289 | |
| Number of page(s) | 10 | |
| Section | Extragalactic astronomy | |
| DOI | https://doi.org/10.1051/0004-6361/202659544 | |
| Published online | 19 June 2026 | |
You can’t see me: Super-Eddington growth hindering X-ray detection in high-z broad-line active galactic nuclei
1
INAF, Osservatorio Astronomico di Roma, Via Frascati 33, 00078 Monte Porzio Catone, Italy
2
Institute for Astronomy, University of Edinburgh, Royal Observatory, Blackford Hill, Edinburgh EH9 3HJ, UK
3
Como Lake Center for Astrophysics, DiSAT, Università degli Studi dell’Insubria, Via Valleggio 11, 22100 Como, Italy
4
INFN, Sezione di Milano-Bicocca, Piazza della Scienza 3, I-20126 Milano, Italy
5
INAF, Osservatorio Astronomico di Bologna, Via Gobetti 93/3, I-40129 Bologna, Italy
6
Center for Astrophysics and Space Science (CASS), New York University Abu Dhabi, PO Box 129188 Abu Dhabi, UAE
7
INAF, Osservatorio Astronomico di Brera, Via E. Bianchi 46, I-23807 Merate, Italy
8
Department of Astronomy & Astrophysics, University of California Santa Cruz, 1156 High Street, Santa Cruz, CA 95064, USA
9
Dipartimento di Fisica “G. Occhialini”, Università degli Studi di Milano-Bicocca, Piazza della Scienza 3, I-20126 Milano, Italy
★ Corresponding author: This email address is being protected from spambots. You need JavaScript enabled to view it.
Received:
20
February
2026
Accepted:
24
April
2026
Abstract
We revisit black hole mass estimates for high-redshift broad-line active galactic nuclei (AGNs) discovered with JWST by jointly analysing their broad emission lines and their systematic non-detections in deep Chandra imaging. Building upon a self-shadowed, super-Eddington accretion framework in which the corona undergoes efficient radiative over-cooling, we couple funnel-dependent Comptonisation physics with slim-disc spectral models and explore the resulting parameter space through a full Markov Chain Monte Carlo inference. Using a recently compiled sample of JWST high-redshift broad-line AGNs, we show that the observed X-ray weakness – manifested as extreme bolometric corrections, suppressed 2−10 keV luminosities, and non-detections in the 0.5−5 keV Chandra band – naturally arises when the corona is confined and radiatively over-cooled inside a narrow super-Eddington funnel. The combined broad line+X-ray analysis yields strongly bimodal posteriors: either very massive, very low-Eddington black holes (physically disfavoured), or a population of low-mass (∼106 − 107 M⊙) black holes accreting at fEdd ≫ 1. The latter solution is strongly preferred for nearly all objects and returns masses consistent with, or lower than, local MBH − M★ relations, mitigating the extreme mass ratios implied by single-epoch virial estimators. The predicted intrinsic spectra are redder and exhibit reduced hard-X-ray output but higher bolometric luminosities, implying bolometric corrections larger than those typical of the local AGN population, yet consistent with low-redshift highly accreting counterparts. These results support a picture in which many JWST broad-line AGNs are powered by rapidly growing, super-Eddington black holes whose suppressed coronal emission and self-shadowed broad-line region geometry combine to mimic overmassive black holes at z ≳ 6.
Key words: accretion / accretion disks / galaxies: active / galaxies: evolution / galaxies: high-redshift / quasars: supermassive black holes
On leave from CLAP, Insubria, Italy.
© The Authors 2026
 Open Access article, published by EDP Sciences, under the terms of the Creative Commons Attribution License (https://creativecommons.org/licenses/by/4.0), which permits unrestricted use, distribution, and reproduction in any medium, provided the original work is properly cited.
This article is published in open access under the Subscribe to Open model. This email address is being protected from spambots. You need JavaScript enabled to view it. to support open access publication.
1. Introduction
Massive black holes (MBHs) are ubiquitously found at the centre of galaxies up to redshifts well above 6 (e.g. Fan et al. 2003; Mortlock et al. 2011; Bañados et al. 2018; Fan et al. 2023; Maiolino et al. 2024), with masses in the range of ∼105 − 1010 M⊙. The observational evidence of their presence comes from the detection of electromagnetic emission produced in their vicinity by gas accretion, which makes them shine as active galactic nuclei (AGNs). Exploiting this information to infer MBH properties is, however, extremely challenging because of the complex structure of accretion flows (Urry & Padovani 1995).
In the local Universe, reverberation mapping campaigns have provided unique information about the properties of the so-called broad-line region (BLR), a region around the MBH characterised by fast gas motions (up to several thousand km s−1) that broaden the gas emission at specific frequencies (e.g. the Balmer series or the Mg II and C IV lines). Under the assumption of virial equilibrium for the BLR gas, a correlation between black hole (BH) mass and the emission properties of these lines has been calibrated (e.g. Vestergaard & Osmer 2009; Bentz et al. 2013; Reines & Volonteri 2015; Greene et al. 2020), providing a simple but effective method of inferring BH masses from single-epoch spectra. Over the years, this method has been applied to a wide variety of sources, including the highest-redshift objects observed with ALMA and JWST. Interestingly, most of these high-redshift objects appear to be more massive than their local counterparts when normalised to the masses of their host galaxies (Farina et al. 2022; Maiolino et al. 2024; Yue et al. 2024; Juodžbalis et al. 2024). Such large mass ratios challenge most theoretical models for the formation and growth of MBHs and require favourable conditions such as a primordial origin (Ziparo et al. 2022; Juodžbalis et al. 2026) or initially heavy seeds (104 − 105 M⊙, see e.g. Begelman et al. 2006; Volonteri 2010; Latif et al. 2016) growing continuously at the Eddington limit. Another challenge arises from their large observed abundance (e.g. Harikane et al. 2023; Maiolino et al. 2024; Greene et al. 2024), which implies a formation efficiency much higher than found in most theoretical models. Several studies have shown that this issue can be alleviated if accretion above the Eddington limit is allowed (e.g. Madau et al. 2014; Lupi et al. 2016; Pezzulli et al. 2016; Regan et al. 2019; Massonneau et al. 2023; Lupi et al. 2024a; Shi et al. 2024; Trinca et al. 2024; Huško et al. 2025; Quadri et al. 2025), which can compensate for stunted growth in low-mass galaxies (see e.g. Anglés-Alcázar et al. 2017). A further concern about this population of high-redshift MBHs is the weak or absent X-ray emission (Maiolino et al. 2025). Hard X-rays are commonly produced by the AGN corona, a hot ionised medium that scatters UV photons from the inner accretion disc into the X-ray band via Comptonisation. The lack of detectable X-ray emission casts doubts on the nature of these broad-line emitters and has renewed interest in alternative explanations, including the possibility of super-Eddington accretion.
Although rarely considered for AGNs, super-Eddington accretion is common in ultra-luminous X-ray sources and tidal disruption events. In the past decade, the first evidence of super-Eddington accretion around local MBHs has been provided by the SEAMBH and SDSS-RM campaigns (Du et al. 2018; Martínez-Aldama et al. 2019; Grier et al. 2017; Du & Wang 2019). Motivated by these results, many works have proposed super-Eddington accretion as a plausible explanation for the peculiar properties of high-redshift MBHs, especially the so-called “little red dots” (LRDs, Matthee et al. 2024). These include their weak X-rays (Lambrides et al. 2026; Madau & Haardt 2024) and the lack of detectable variability (Secunda et al. 2026). Several studies have also suggested that the gas distribution around MBHs during super-Eddington accretion phases may strongly affect the electromagnetic emission, introducing biases in the black hole masses inferred using locally calibrated scaling relations (e.g. Reines & Volonteri 2015; Vestergaard & Osmer 2009). In particular, the broad-line profile might be altered by several physical mechanisms, including radiation beaming (King 2024; Madau 2026), angle-dependent shadowing of BLR clouds (Lupi et al. 2024b), scattering processes, (Rusakov et al. 2026; Chang et al. 2026), and small-scale inflows or outflows that significantly affect the observed optical line velocities (see e.g. Torralba et al. 2026; D’Eugenio et al. 2026). Direct evidence of such a bias has recently been provided by resolved BLR observations at intermediate redshift by the GRAVITY+ collaboration (Abuter et al. 2024; GRAVITY+ Collaboration 2026), which found highly accreting BHs with masses up to an order of magnitude smaller than those inferred from single-epoch methods.
Motivated by these developments and by our previous analysis of how the single-epoch method biases BH mass estimates upwards in super-Eddington systems, we extend our study to the apparent X-ray weakness of these sources. We re-analyse the 14 objects examined in Lupi et al. (2024b, L24 hereafter) and included in Maiolino et al. (2025, M25 hereafter). Starting from the Madau & Haardt (2024) model, in which the AGN corona in super-Eddington accretion flows is confined and cooled inside the central funnel of a thick accretion disc, we aim to reassess BH masses and infer accretion rates and possibly BH spins under the assumption that the observed lack of X-rays is due to an intrinsically steeper X-ray spectrum, as opposed to extreme gas column densities.
The manuscript is organised as follows. In Section 2 we describe our procedure to estimate BH masses using the constraints from X-ray emission. In Section 3 we present our results. In Section 4 we discuss caveats in the analysis and summarise our conclusions.
2. Methods
For our purposes, in this work we couple the model for the X-ray weakness of super-Eddington flows by Madau & Haardt (2024) with the slim-disc spectrum by Kubota & Done (2019), and incorporate them into a Markov chain Monte Carlo (MCMC) analysis tool as implemented in the EMCEE package (Foreman-Mackey et al. 2013) to more accurately infer BH masses, accretion rates, and spins.
First, we computed the effective hard X-ray temperature and slope as a function of the half-opening angle of the funnel following Madau & Haardt (2024), assuming fc = 1 and a single scattering probability in crossing the corona of 0.3. The results of these calculations, described in detail in Appendix A, are shown in Fig. 1. We then connected the half-opening angle of the funnel to the MBH accretion rate using Eq. (11) in Wang et al. (2014), adjusted to ensure continuity across the entire range,
 (1)
(1)
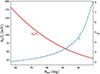 |
Fig. 1. Effective electron temperature (red solid line) and X-ray photon index Γ (dashed blue line) as a function of the half-opening angle of the accretion disc funnel, as predicted by the model of Madau & Haardt (2024). The model accounts for coronal cooling due to inverse-Compton scattering of disc photons, which becomes increasingly efficient at high accretion rates, where the disc is geometrically thicker and the funnel correspondingly narrower. In this regime, the enhanced soft-photon flux leads to stronger cooling of the coronal plasma, resulting in progressively steeper hard X-ray spectra with increasing Eddington ratios. Details of the calculations are provided in Appendix A. |
where fEdd = ṀBHc2/LEdd, ṀBH is the MBH accretion rate, c is the speed of light, LEdd = 1.26 × 1038(MBH/M⊙) erg s−1 is the Eddington luminosity, and MBH is the BH mass.
We then built a library of AGN spectra using the agnslim model (Kubota & Done 2019) in XSPEC, as a function of the BH mass MBH, the MBH spin a•, and the thin-disc Eddington ratio  , with ηthin(a•) the spin-dependent radiative efficiency for a Shakura & Sunyaev (1973) accretion disc. Unlike in our previous work, in which the other parameters of the agnslim model were left at their default values, here we also include variations in the slope (Gamma_hot) and effective electron temperature (kTe_hot) of the hot Comptonisation region of the model, with Gamma_hot in the range 2−8 and kTe_hot in the range 30−200 keV.
We sampled 7500 different combinations, with 25 logarithmically spaced BH masses between 105 and 1010 M⊙, 30 logarithmically spaced values of fEdd, thin in the range 10−3 − 103, and 10 linearly spaced values of a• between 0 and 0.998. Each spectrum covers the energy range 0.01 eV–200 keV, corresponding to a wavelength range 1.2 Å−24.8 μm, in 40 000 logarithmically spaced bins. After the spectra have been generated, for each combination we tabulated the bolometric luminosity, Lbol, the rest-frame X-ray luminosity in the 2−10 keV band, L2 − 10, and the corresponding observer-frame luminosity, LX, in the 0.5−5 keV band observable by Chandra, considering 30 redshift bins between z = 4 and z = 7, in addition to the quantities employed in L24. For consistency with Kubota & Done (2019), we normalised the bolometric luminosity of each spectrum to the value estimated from the numerical integration of the slim-disc solution by Sadowski (2011). With these tables, we constructed a multidimensional interpolation that was used in the likelihood evaluation.
For our analysis, we considered as our observational sample a subset of the sources analysed by M25, in particular those for which a BH mass estimate based on our previous analysis of the BLR emission from L24 was available. We defined the likelihood, ℒ, for the MCMC as
![Mathematical equation: $$ \begin{aligned} \ln \mathcal{L} = -\frac{1}{2} \sum _i \left[\frac{(Y_i-\bar{Y}_i)^2}{s_i^2} + \ln (2\pi s_i^2)\right] - \infty \,\mathrm{H} (L_{\rm X}-L_{\rm X,lim}), \end{aligned} $$](/articles/aa/full_html/2026/06/aa59544-26/aa59544-26-eq3.gif) (2)
(2)
where Yi can be (i) the bolometric luminosity or (ii) the observed luminosity and full width at half maximum (FWHM) of the Hα broad line of the source,  is the value predicted by our model, si is the uncertainty in the observed data (assumed Gaussian), and H is the Heaviside step function, evaluated using the difference between the X-ray luminosity from the model and the minimum observable luminosity in the 0.5−5 keV Chandra band. The Heaviside function was introduced to ensure that every model predicting a detectable X-ray flux was automatically rejected.
The parameters of our model that we aim to constrain are MBH, Lthin/LEdd, and aBH. As priors, we assumed a log-flat distribution for MBH and Lthin/LEdd over the intervals [5, 10] and [ − 3, 3], respectively, and a uniform distribution for aBH between 0 and 0.998. We ran the MCMC for 10 000 steps employing 32 walkers1.
3. Results
3.1. Bolometric correction comparison
Before running the MCMC, we first performed a benchmark test of our mock AGN spectra, which follow the super-Eddington flow prescriptions of Madau & Haardt (2024) and include the associated changes in the X-ray band. In particular, we investigated the range of bolometric corrections expected for the high-redshift AGN population by adopting the values of MBH and Lbol reported by M25, which are inferred from standard scaling relations (Stern & Laor 2012). From these estimates, we evaluated KX = Lbol/LX using our XSPEC tables for different values of a•.
In Fig. 2, we show the lower limit on KX provided by M25 for each source, compared to the corresponding range of KX values expected for different spins between a• = [0 − 0.99]2. Low spin values, which imply higher bolometric corrections, represent the upper bound of the range, and maximal spin values the lower bound. Bars extending above the corresponding lower limits indicate spin configurations consistent with current Chandra non-detections. For reference, we also show the local scaling relation and the compilation of data from Duras et al. (2020).
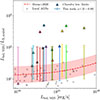 |
Fig. 2. Comparison between the expected KX for our sample of high-redshift AGNs (assuming the MBH and fEdd estimates from M25) for different spin values, and the observed lower limits from the X-ray non-detection, shown as triangles. Our models are shown with solid vertical bars spanning values expected for different spins, ranging between a• = 0 (upper bounds, implying higher bolometric corrections) and a• = 0.99 (lower bounds). The local scaling relation is shown as a red line, with the shaded area corresponding to a 1σ uncertainty (±0.26 dex), and the local observations by Duras et al. (2020) as grey points. Colour bars extending above the corresponding observed lower limits (shown in the same colour) indicate the existence of spin values consistent with the current Chandra non-detection. |
From this comparison, we see that, even without modifying the X-ray spectral slope according to the super-Eddington prescriptions, adopting a more conservative choice of Γ ≈ 2 (instead of Γ = 1.7 assumed in M25) for low-accretion-rate sources – as predicted in Fig. 1 for a large opening angle, θ → 90° – is sufficient to explain the X-ray non-detections with standard AGN spectra for at least a subset of spin values in ∼40% of sources. Only the sources exhibiting very high bolometric corrections appear clearly incompatible with our models when assuming the literature estimates for MBH and Lbol. We then repeated this analysis by adopting instead the BH masses and bolometric luminosities reported in L24, allowing for the possibility of super-Eddington accretion. The results are shown in Fig. 3. To remain consistent with the original analysis in L24, we retrieved the values of MBH and fEdd, thin for the ten highest-probability solutions among the 32 000 samples of the original MCMC run, and we report the range of values of KX for different spins for the solution with the highest bolometric correction. We find that, based solely on the L24 estimates, the predicted range of bolometric corrections extends above the corresponding empirical lower limit for nearly all systems, implying that there exists a range of spin configurations that is compatible with the current X-ray non-detections.
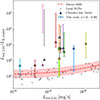 |
Fig. 3. Same as Fig. 2 but assuming BH masses and accretion rates from Lupi et al. (2024b). We selected here the combination of MBH, fEdd, a• showing the highest KX correction among the ten solutions with the highest probability over the 32k samples. Bolometric corrections are corrected according to the predicted bolometric luminosity of each source. Nearly all systems allow for spin configurations consistent with the current X-ray non-detection. |
Only two sources in the sample show a range of KX values that is entirely below the corresponding lower limit when using the L24 estimates for MBH and the accretion rate. As discussed below, our subsequent analysis finds for these two sources a preference for higher Lbol values than in L24, which naturally explains their non-detections.
3.2. MCMC analysis
We now extend our analysis and infer the best-fitting model parameters using the MCMC procedure described in Section 2. We consider two different cases: one in which the bolometric luminosity is fixed to the value estimated by M25 from standard correlations, and another in which we instead constrain the broad-line properties as in L24, together with the X-ray non-detection of the target sources.
3.2.1. Mass estimates from the X-ray weakness alone
As an example of the results of our analysis, Fig. 4 shows the corner plot for the source GS8083, where MBH and fEdd estimates provided in M25 are also reported. We observe that, regardless of the assumption on Lbol, the posterior distributions of both the BH mass and Eddington ratio are bimodal. This behaviour is not unique to this single candidate, but is observed across all the systems we analysed.
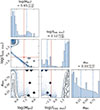 |
Fig. 4. Example of a corner plot from the MCMC X-ray analysis for the GS8083 source. The orange lines and square marker show the reference values of MBH and fEdd from M25. The numerical values reported above each marginalised distribution correspond to the medians of the respective posteriors, while the [0.16, 0.5, 0.84] quantiles are shown as dashed blue lines. A bimodal structure is clearly visible in the posterior distributions of BH mass and accretion rates, with current literature estimates lying between the two solutions. Spin values are poorly constrained across the full set of MCMC samples. |
This result implies that the observational constraints considered – namely, the expected Lbol and the X-ray weakness – can be interpreted in two contrasting ways: (i) the lack of X-ray emission is due to the increased steepness of the X-ray spectrum when the accretion rate exceeds the Eddington limit, so that we are observing a highly accreting, low-mass BH; or (ii) a very massive BH is accreting well below Eddington, close to the advection-dominated accretion flow (ADAF) regime, where the intrinsic X-ray luminosity is low despite a relatively shallow spectrum. Interestingly, the mass estimate by M25 lies between the two values preferred by our MCMC analysis, as shown in Fig. 4.
Because of this bimodality, the median values for the different parameters typically obtained through Bayesian analysis cannot be taken as representative of the actual distribution. For this reason, we opted to split the samples from the MCMC into two populations. To optimally separate the different solutions, we assumed fEdd, thin = 1 as a threshold. The results after this splitting are shown in Fig. 5, where each source is represented by a characteristic marker. In particular, we report the MBH and Ṁ/ṀEdd3 values obtained from the MCMC for the two different solutions, plotted as a function of the estimates from M25. The shaded region indicates the 1:1 relation with a 0.5 dex dispersion, where systems consistent with literature estimates are expected to lie. We find that the BH masses inferred by our MCMC for the 14 sources analysed occupy two well-separated regions (consistent with the single example above) corresponding to either low-mass BHs accreting above the Eddington limit, or very high-mass BHs accreting well below Eddington. In order to assess which solution is preferred by the MCMC analysis, we compare the mean likelihood associated with each solution and colour-code the data points according to the ratio between them. The colour coding therefore indicates which of the two solutions is more strongly represented in the overall posterior distribution, with redder colours supporting to the lower-mass solution. We clearly see that almost all sources prefer the low-mass solution, with only one object showing comparable likelihoods. At the same time, we find that the M25 results struggle to explain most of the sources, as they lie between the two inferred solutions and are only partially consistent with the high-mass, less favoured one. However, for several objects the high-mass solutions imply black hole masses significantly larger than those expected from local correlations, by up to one order of magnitude. Such a result is physically unlikely as it would require an ADAF-like disc solution that the tables we employed do not model properly. It is also not clear whether at such low accretion rates the BLR would be present. Even more importantly, this solutions would imply unreasonably high BH-to-stellar mass ratios, predicting a BH mass comparable or even higher than the host stellar mass for a large fraction of the analysed systems.
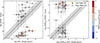 |
Fig. 5. Comparison between the best-fit values of MBH (left panel) and Ṁ/ṀEdd (right panel) derived from the MCMC analysis (which includes constraints on the X-ray emission) and the estimates from M25 obtained using the single-epoch method. Given the bimodal posterior distributions found for all objects, the Monte Carlo samples are divided into two groups: low-mass, highly accreting systems (filled data points) and high-mass, almost inactive black holes (empty data points). Each pair of solutions for a given object is represented by a different marker. Data points for the low mass solution are colour-coded according to the ratio between the mean likelihoods obtained for the low-mass and high-mass solutions, where high values (red colours) suggest a preference for the former. The shaded grey regions indicate a deviation of 0.5 dex from the 1:1 relation. |
A further noteworthy feature of the performed MCMC analysis is that the inclusion of the X-ray non-detection appears to be able to constrain the MBH spin more tightly than in L24, where the broad-line observables alone were consistent with almost any spin value. This is shown in Fig. 4, for the case of GS8083, where the overall posterior spin distribution seems to prefer low spin values. We shall explore this aspect in more detail in Section 3.3.
3.2.2. Joint analysis of X-rays and broad-line emission
In the previous section, we constrained the best-fitting model parameters of the MCMC relying on the X-ray non-detection of the considered AGN sample, and on their estimated bolometric luminosities. It has to be highlighted, however, that the Lbol values provided for these object were not inferred by the continuum, which is often significantly contaminated by the host galaxy. Instead, their bolometric luminosity was estimated from the broad component of the Hα emission line, relying on the standard scaling relation from Stern & Laor (2012). Here, there are two important caveats to consider: (i) this scaling relation is characterised by a substantial intrinsic uncertainty, with a 1σ scatter of approximately ≈0.4 dex; (ii) at super-Eddington accretion rates, the radiative efficiency drops rapidly, while the collimation due to the funnel significantly alters the standard scaling between the continuum and the emission lines, as shown in L24.
For this reasons, we provide here a different parameter estimation by performing a joint analysis between the X-ray non-detections and the width and luminosity of the detected broad Hα lines, without making use of bolometric luminosity estimates based on local scaling relations. The results of this joint analysis are shown in Fig. 6. As in Section 3.2.1, we again found a characteristic bimodality in the posterior distribution of the inferred parameters, and proceeded to split the samples between lower-mass super-Eddington solutions and higher-mass sub-Eddington ones. The resulting best-fit values for MBH and Ṁ/ṀEdd from the joint MCMC analysis are plotted this time as a function of the estimates from L24, in order to provide a direct comparison with the estimates obtained relying only on information from the observed broad emission lines. We find that the preference for the low-mass solution is even more evident, as indicated by the ratio of the likelihoods, and no system seems to favour the high-mass one. As a reference, we also report in the plot the estimates by M25. Interestingly, the highly super-Eddington, low-mass solution from this work explains well the population with MBH ≲ 107.5 M⊙ from L24, with masses in line with (or even lower than) our previous estimates, whereas the low-Eddington, high-mass solution is again larger than the single-epoch estimates reported by M25. Note, also, that the Eddington ratio for this massive population is very low, sometimes close to Ṁ/ṀEdd ≃ 10−3, for which the existence of the BLR is even more unlikely. In two of the analysed systems, for which the L24 analysis based only on broad lines suggested MBH ≳ 108 M⊙, the combined analysis prefers instead a significantly lower BH mass of ≈107 M⊙, and very high accretion rates log(Ṁ/ṀEdd) ≳ 2. For the most massive of them, the corresponding high-mass solution from the MCMC is instead highly uncertain, and remains consistent within 1σ with the L24 estimates.
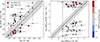 |
Fig. 6. Same as Fig. 6, but here we compare the MBH and Ṁ/ṀEdd estimates obtained from the MCMC combined analysis that includes both the AGN X-ray non-detection and the broad-line emission constraints, with those from L24, where the MCMC analysis was based only on the broad-line emission properties. For reference, black data points show, on the y axis, the values reported in the literature based on single-epoch estimates. For each object, the low-mass, high-mass, and literature estimates are shown with the same marker. |
These results suggest that the combination of broad-line emission and lack of X-rays might be naturally reproduced by MBHs with relatively low masses, and hence much closer to the local scaling relations, accreting at very large Eddington ratios. To show this, we report in Fig. 7 the MBH − Mstar relation for the low-mass solution we obtained, compared with local observations and the estimates by M25. We immediately note how the super-Eddington solution brings the BH mass on the local relation or very close to it, in agreement with what has been found in L24. Conversely, the high-mass solutions provided by the MCMC would further exacerbate the tension with the local scaling relations, predicting most of the systems to have BH-to-stellar mass ratios as high as ∼0.1 − 1.
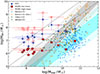 |
Fig. 7. Black hole vs stellar mass relation for the 14 sources in the analysed sample. Filled and empty red squares show the results from the combined MCMC analysis, assuming the low-mass and high-mass solution, respectively. Filled blue data points show instead the original black hole mass estimates from M25. The local AGN sample from Reines & Volonteri (2015) is shown with blue stars and orange diamonds, while the underlying shaded regions indicate the 1σ and 2σ uncertainties around the best-fit relations for local inactive (grey) and active (cyan) galaxies. Note that we also include local AGN observational data from Winkel et al. (2025) and Zeltyn et al. (2025), which are more consistent with the inactive galaxy distribution. For reference, dotted black lines mark constant black hole–to–stellar mass ratios of 0.01 and 0.1. |
Finally, in Fig. 8 we report the intrinsic bolometric correction inferred from the joint MCMC analysis, considering only the favoured, low-BH mass solution. We find that the predicted bolometric corrections range between 200 ≲ kX, intr ≲ 3 × 10⁴, displaying a mild increasing trend with bolometric luminosity. These values are significantly higher that those typically inferred for standard local AGNs, commonly described by the relation presented in Duras et al. (2020). However, when considering the MBH and fEdd estimates favoured by the MCMC posterior, it becomes clear that the highly accreting, super-Eddington sources dominating our sample have no direct counterparts in the local AGN population considered in Duras et al. (2020), in terms of either physical structure or emission properties. To provide a more meaningful comparison, we also report in Fig. 8 the bolometric correction factors estimated in Laurenti et al. (2022) for a sample of 14 highly accreting (λEdd > 1) AGNs at 0.4 ≤ z ≤ 0.75, which are found to present a significant intrinsic X-ray weakness. Although this sample is characterised by Lbol ≈ 0.5 − 1 dex higher than those of our high-redshift sources, their inferred bolometric corrections are broadly consistent with our estimates, ranging between 50 ≤ kX ≤ 5 × 10³.
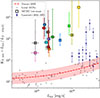 |
Fig. 8. Intrinsic bolometric correction in the restframe [2−10] keV energy range (KX, [2 − 10] keV) as a function of the AGN bolometric luminosity. Coloured data points show the estimates for the selected AGN population obtained from the combined MCMC analysis, assuming the low-mass solution shown in Fig. 6. As a reference, we report with blue data points the results from Laurenti et al. (2022) for a population of highly accreting AGNs (λEdd > 1) observed at 0.4 ≤ z ≤ 0.75. Despite being characterised by typical bolometric luminosities ∼1 dex higher than our sample, these systems show a comparable intrinsic X-ray weakness. |
In contrast with the BH mass estimates adopted in the literature for the analysed JWST sample, the super-Eddington solutions favoured by our MCMC analysis imply intrinsically redder spectra, together with systematically higher bolometric luminosities. As a consequence, the corresponding data points are shifted towards higher luminosities relative to the estimates of M25 (shown in Fig. 2). Notably, this shift places our sources in a luminosity regime where the local AGN population also exhibits a mild increase in bolometric correction. For completeness, we also inferred the intrinsic values of the UV-to-X-ray spectral index that are predicted for our low-mass, high-Eddington AGN solutions, finding αOX ∼ [ − 1.4, −2.2]. This is consistent with an extrapolation of the local αOX versus λEdd relation found in Lusso et al. (2010) to higher accretion rates, and matches the larger scatter towards more negative values (down to αOX ≈ −2.3) observed in local super-Eddington counterparts (Laurenti et al. 2022).
3.3. Black hole spin distribution
In Figures 2 and 3 we showed that even for fixed values of BH mass and accretion rate, the expected X-ray bolometric correction would strongly depend on the BH spin. This could lead to differences of more than 1 dex in the inferred value of KX. In the analysis presented in Lupi et al. (2024b), the BH spin values were only poorly constrained by the MCMC analysis, due to the limited observational data provided by the broad emission lines and to their moderate sensitivity to spin. We therefore investigated whether the inclusion of the additional constraints derived from the X-ray non-detections of the same sources can yield more informative insights into the determination of the BH spin. Relying on the results presented in Section 3.2.2, which are based on the joint analysis of X-ray and broad-line emission, we assumed the posterior spin distribution obtained from the MCMC analysis for each individual source to be Gaussian. We then combined the resulting distributions for the entire AGN sample to derive the overall spin distribution for both the high- and low-mass BH solutions. The resulting cumulative distributions are shown in Figure 9. We found that the two solutions point towards very distinct spin distributions. In the case of high-mass, low-accreting BHs, the spin distribution is strongly skewed towards low values. In particular, it requires that ≳50% of the population have spin parameters of a• < 0.2. This is driven by the need for low radiative efficiencies in order to remain consistent with the X-ray non-detection of these systems. Conversely, for low-mass BHs accreting at super-Eddington rates, the spin distribution is much less constrained, peaking at a• ≈ 0.5, with a comparable fraction of systems having a• ≷ 0.5. This reflects the fact that, given the high Eddington ratios characterising this solution, the large bolometric corrections shown in Fig. 8 typically lie well above the current X-ray lower limits, and are therefore only weakly constrained by the observations.
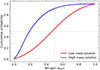 |
Fig. 9. Cumulative black hole spin distribution predicted by the combined MCMC analysis based on X-ray and broad-line emission. Red and blue curves show the results for the high-mass and low-mass solutions, respectively. Assuming the high BH mass solution, the analysed population would systematically require low spin values, with a < 0.2 for ≈50% of sources, in order to remain consistent with the X-ray non-detections. |
4. Discussion and conclusions
In this work, we extended the L24 analysis of the broad-line emission from high-redshift MBHs discovered by JWST to incorporate also the lack of X-ray detections observed in many of these sources. Building on the model by L24, in which the self-shadowing effect naturally arising in slim and thick accretion discs reduces the size of the BLR and biases virial MBH mass estimates, we have incorporated the over-cooling of the coronal plasma proposed by Madau & Haardt (2024) into our MCMC analysis tool. Our results suggest that the concurrent presence of broad Balmer line emission and extreme X-ray weakness that characterise the AGN population observed at z > 4 with JWST can be explained by two qualitatively different populations: (i) a population of very massive, almost quiescent BHs, or (ii) a population of low-mass BHs accreting at highly super-Eddington rates.
The first scenario, however, appears physically less plausible. On the one hand, it would imply MBH/M★ ratios even more extreme than those reported in the literature, posing a serious challenge to nearly all astrophysical models of MBH evolution; on the other hand, it would require relatively low MBH spin values, which are difficult to reconcile with such an early and rapid growth history, unless efficient spin-down episodes have previously occurred, which, however, are typically driven by strong jet emission during phases of super-Eddington accretion (Narayan et al. 2022; Ricarte et al. 2023). In addition, this high-mass solution is strongly disfavoured by our MCMC analysis in terms of integrated posterior probability.
The second scenario, involving super-Eddington accreting systems, would instead produce an intrinsically red spectrum, which may more naturally account for other observed properties of these sources (Liu et al. 2025; Zucchi et al. 2026). In this case, the inferred BH masses would be lower by ∼0.5 − 1.5 dex compared to estimates based on single-epoch virial calibrations, bringing the systems closer to the local scaling relations, while still allowing for some intrinsic overmassiveness at the low-mass end, with MBH/Mstar ∼ 0.01. The highly accreting AGN population in this scenario would be characterised by steep X-ray spectra, implying bolometric correction factors of KX ∼ 102 − 104, which, although significantly higher than those typical of the local AGN population, are consistent with what is observed in low-redshift samples of super-Eddington accreting systems (Laurenti et al. 2022).
An important caveat of our modelling is that the underlying accretion-flow structure is described using advective slim-disc solutions (through the agnslim spectral model), rather than the geometrically thicker, non-advective radiation tori recently explored in Madau (2026). In such radiation-supported tori, photon trapping, multiple reflections within the funnel, and strong angular anisotropies in the emergent radiation field can differ significantly from the assumptions implicit in slim-disc spectra. As a consequence, our mapping between the accretion rate, funnel opening angle, X-ray bolometric corrections, and viewing-angle dependence should be regarded as pertaining to advection-dominated flows only. Non-advective thick-torus radiative-transfer calculations may modify the quantitative values of KX, fEdd, and the inferred spin distribution, although we expect the qualitative preference for low-mass, highly super-Eddington solutions to remain robust.
It should also be emphasised that our results assume the absence of extremely high gas column densities capable of absorbing the X-ray emission from the AGN. Recent studies focusing on the population of LRDs have shown that their peculiar spectral features may be linked to the presence of very dense gas surrounding the central source, such as strong Balmer absorption and pronounced Balmer breaks (Inayoshi & Maiolino 2025; D’Eugenio et al. 2026; Ji et al. 2025; Naidu et al. 2025), as well as potentially thermalised emission emerging in the rest-frame optical and near-infrared (de Graaff et al. 2025). However, Liu et al. (2025) have recently shown that the same spectral features can be reproduced by the intrinsic continuum emission of super-Eddington accretion flows, in which opacity effects across the Balmer limit give rise to both a red optical spectrum and a Balmer break, without invoking additional absorbing material. Nevertheless, since LRDs are excluded from our analysed AGN sample, we have not considered the contribution of dense absorbing gas in our modelling.
In addition, it is important to stress that LRDs represent only ∼10 − 30% of the broad-line AGN population detected at high redshift. Consequently, the vast majority of sources still exhibit a complete lack of X-ray detection, without clear indications of dense gas along the line of sight. If, as has recently been suggested by Brazzini et al. (2026), LRDs and the broader population of “little blue dots” are powered by the same central engines and differ primarily in geometry and/or in the evolutionary stage of their surrounding environments, this would imply that both populations are intrinsically X-ray weak. In this framework, the presence of dense gas in the minority of sources displaying a steep red optical continuum would further enhance their apparent X-ray weakness.
Previous results from Sacchi & Bogdán (2025) argued that softer, super-Eddington spectra alone would not be sufficient to explain the non-detection of stacked LRDs in Chandra deep fields, assuming that the BH mass and bolometric luminosity estimates for these systems are accurate. We show, however, that the high-accretion solution naturally leads to significantly lower BH masses than currently inferred, which would fully alleviate the observed tension and could be further aided by partial gas obscuration.
Neglecting the presence of high gas column densities in the analysed sample of BL AGNs nonetheless represents a potential caveat of our analysis, as it would bias our mass estimates. We note, however, that in the case of extremely large column densities capable of strongly attenuating the X-ray flux, specific gas configurations would be required to suppress the X-ray emission while allowing the ionising radiation responsible for the broad-line emission to remain largely unaffected (see e.g. Maiolino et al. 2024; Inayoshi & Maiolino 2025). Although not explicitly considered in our analysis, several other physical effects may further increase the uncertainties of current BH mass estimates for this high-redshift population. These include electron scattering in dense gas environments (Rusakov et al. 2026), radiation beaming (King 2024), and small-scale outflows, which might all contribute to the overall mass overestimation.
Future observations will provide crucial insights into the physical conditions and detailed spectral properties of this high-redshift AGN population. In particular, improved multiwavelength coverage and higher signal-to-noise spectroscopy will be needed to disentangle the relative importance of these different effects and establish more robust constraints on the properties of their central engines, especially in terms of BH masses and accretion rates.
Acknowledgments
AT, AL, and FH acknowledge support by the PRIN MUR “2022935STW” funded by European Union-Next Generation EU, Missione 4 Componente 2, CUP C53D23000950006. AT acknowledges financial support from the Bando Ricerca Fondamentale INAF 2023, Mini-grant “Cosmic Archaeology with the first black hole seeds” (Ob.Fu. RSN1 1.05.23.04.01).
References
- Abuter, R., Allouche, F., Amorim, A., et al. 2024, Nature, 627, 281 [NASA ADS] [CrossRef] [Google Scholar]
- Anglés-Alcázar, D., Faucher-Giguère, C.-A., Quataert, E., et al. 2017, MNRAS, 472, L109 [Google Scholar]
- Bañados, E., Venemans, B. P., Mazzucchelli, C., et al. 2018, Nature, 553, 473 [Google Scholar]
- Begelman, M. C., Volonteri, M., & Rees, M. J. 2006, MNRAS, 370, 289 [NASA ADS] [CrossRef] [Google Scholar]
- Bentz, M. C., Denney, K. D., Grier, C. J., et al. 2013, ApJ, 767, 149 [Google Scholar]
- Brazzini, M., D’Eugenio, F., Maiolino, R., et al. 2026, A&A, submitted [arXiv:2601.22214] [Google Scholar]
- Chang, S. J., Gronke, M., Matthee, J., & Mason, C. 2026, MNRAS, 545, staf2131 [Google Scholar]
- de Graaff, A., Hviding, R. E., Naidu, R. P., et al. 2025, ArXiv e-prints [arXiv:2511.21820] [Google Scholar]
- D’Eugenio, F., Juodžbalis, I., Ji, X., et al. 2026, MNRAS, 545, staf2117 [Google Scholar]
- Du, P., & Wang, J.-M. 2019, ApJ, 886, 42 [NASA ADS] [CrossRef] [Google Scholar]
- Du, P., Zhang, Z.-X., Wang, K., et al. 2018, ApJ, 856, 6 [NASA ADS] [CrossRef] [Google Scholar]
- Duras, F., Bongiorno, A., Ricci, F., et al. 2020, A&A, 636, A73 [NASA ADS] [CrossRef] [EDP Sciences] [Google Scholar]
- Fan, X., Strauss, M. A., Schneider, D. P., et al. 2003, AJ, 125, 1649 [Google Scholar]
- Fan, X., Bañados, E., & Simcoe, R. A. 2023, ARA&A, 61, 373 [NASA ADS] [CrossRef] [Google Scholar]
- Farina, E. P., Schindler, J.-T., Walter, F., et al. 2022, ApJ, 941, 106 [NASA ADS] [CrossRef] [Google Scholar]
- Foreman-Mackey, D., Hogg, D. W., Lang, D., & Goodman, J. 2013, PASP, 125, 306 [Google Scholar]
- GRAVITY+ Collaboration (Abd El Dayem, K., et al.) 2026, A&A, 706, A99 [Google Scholar]
- Greene, J. E., Strader, J., & Ho, L. C. 2020, ARA&A, 58, 257 [Google Scholar]
- Greene, J. E., Labbe, I., Goulding, A. D., et al. 2024, ApJ, 964, 39 [CrossRef] [Google Scholar]
- Grier, C. J., Pancoast, A., Barth, A. J., et al. 2017, ApJ, 849, 146 [NASA ADS] [CrossRef] [Google Scholar]
- Haardt, F., & Maraschi, L. 1991, ApJ, 380, L51 [Google Scholar]
- Harikane, Y., Zhang, Y., Nakajima, K., et al. 2023, ApJ, 959, 39 [NASA ADS] [CrossRef] [Google Scholar]
- Huško, F., Lacey, C. G., Roper, W. J., et al. 2025, MNRAS, 537, 2559 [Google Scholar]
- Inayoshi, K., & Maiolino, R. 2025, ApJ, 980, L27 [Google Scholar]
- Ji, X., Maiolino, R., Übler, H., et al. 2025, MNRAS, 544, 3900 [Google Scholar]
- Juodžbalis, I., Maiolino, R., Baker, W. M., et al. 2024, Nature, 636, 594 [CrossRef] [Google Scholar]
- Juodžbalis, I., Marconcini, C., D’Eugenio, F., et al. 2026, Nature, 8116, 1017 [Google Scholar]
- King, A. 2024, MNRAS, 531, 550 [NASA ADS] [CrossRef] [Google Scholar]
- Kubota, A., & Done, C. 2019, MNRAS, 489, 524 [NASA ADS] [CrossRef] [Google Scholar]
- Lambrides, E., Larson, R. L., Garofali, K., et al. 2026, Nat. Astron. [arXiv:2409.13047] [Google Scholar]
- Latif, M. A., Schleicher, D. R. G., & Hartwig, T. 2016, MNRAS, 458, 233 [NASA ADS] [CrossRef] [Google Scholar]
- Laurenti, M., Piconcelli, E., Zappacosta, L., et al. 2022, A&A, 657, A57 [NASA ADS] [CrossRef] [EDP Sciences] [Google Scholar]
- Liu, H., Jiang, Y.-F., Quataert, E., Greene, J. E., & Ma, Y. 2025, ApJ, 994, 113 [Google Scholar]
- Lupi, A., Haardt, F., Dotti, M., et al. 2016, MNRAS, 456, 2993 [NASA ADS] [CrossRef] [Google Scholar]
- Lupi, A., Quadri, G., Volonteri, M., Colpi, M., & Regan, J. A. 2024a, A&A, 686, A256 [NASA ADS] [CrossRef] [EDP Sciences] [Google Scholar]
- Lupi, A., Trinca, A., Volonteri, M., Dotti, M., & Mazzucchelli, C. 2024b, A&A, 689, A128 [NASA ADS] [CrossRef] [EDP Sciences] [Google Scholar]
- Lusso, E., Comastri, A., Vignali, C., et al. 2010, A&A, 512, A34 [NASA ADS] [CrossRef] [EDP Sciences] [Google Scholar]
- Madau, P. 2026, A&A, 708, A116 [NASA ADS] [CrossRef] [EDP Sciences] [Google Scholar]
- Madau, P., & Haardt, F. 2024, ApJ, 976, L24 [Google Scholar]
- Madau, P., Haardt, F., & Dotti, M. 2014, ApJ, 784, L38 [NASA ADS] [CrossRef] [Google Scholar]
- Maiolino, R., Scholtz, J., Curtis-Lake, E., et al. 2024, A&A, 691, A145 [NASA ADS] [CrossRef] [EDP Sciences] [Google Scholar]
- Maiolino, R., Risaliti, G., Signorini, M., et al. 2025, MNRAS, 538, 1921 [Google Scholar]
- Martínez-Aldama, M. L., Czerny, B., Kawka, D., et al. 2019, ApJ, 883, 170 [CrossRef] [Google Scholar]
- Massonneau, W., Dubois, Y., Volonteri, M., & Beckmann, R. S. 2023, A&A, 669, A143 [NASA ADS] [CrossRef] [EDP Sciences] [Google Scholar]
- Matthee, J., Naidu, R. P., Brammer, G., et al. 2024, ApJ, 963, 129 [NASA ADS] [CrossRef] [Google Scholar]
- Mortlock, D. J., Warren, S. J., Venemans, B. P., et al. 2011, Nature, 474, 616 [Google Scholar]
- Naidu, R. P., Matthee, J., Katz, H., et al. 2025, ArXiv e-prints [arXiv:2503.16596] [Google Scholar]
- Narayan, R., Chael, A., Chatterjee, K., Ricarte, A., & Curd, B. 2022, MNRAS, 511, 3795 [NASA ADS] [CrossRef] [Google Scholar]
- Pezzulli, E., Valiante, R., & Schneider, R. 2016, MNRAS, 458, 3047 [NASA ADS] [CrossRef] [Google Scholar]
- Quadri, G., Trinca, A., Lupi, A., Colpi, M., & Volonteri, M. 2025, A&A, 704, A248 [NASA ADS] [CrossRef] [EDP Sciences] [Google Scholar]
- Regan, J. A., Downes, T. P., Volonteri, M., et al. 2019, MNRAS, 486, 3892 [CrossRef] [Google Scholar]
- Reines, A. E., & Volonteri, M. 2015, ApJ, 813, 82 [NASA ADS] [CrossRef] [Google Scholar]
- Ricarte, A., Narayan, R., & Curd, B. 2023, ApJ, 954, L22 [CrossRef] [Google Scholar]
- Rusakov, V., Watson, D., Nikopoulos, G. P., et al. 2026, Nature, 649, 574 [Google Scholar]
- Sacchi, A., & Bogdán, Á. 2025, ApJ, 989, L30 [Google Scholar]
- Sadowski, A. 2011, ArXiv e-prints [arXiv:1108.0396] [Google Scholar]
- Secunda, A., Somerville, R. S., Jiang, Y.-F., et al. 2026, ApJ, 996, 6 [Google Scholar]
- Shakura, N. I., & Sunyaev, R. A. 1973, A&A, 500, 33 [NASA ADS] [Google Scholar]
- Shi, Y., Kremer, K., & Hopkins, P. F. 2024, ApJ, 969, L31 [Google Scholar]
- Stern, J., & Laor, A. 2012, MNRAS, 423, 600 [NASA ADS] [CrossRef] [Google Scholar]
- Torralba, A., Matthee, J., Weibel, A., et al. 2026, ArXiv e-prints [arXiv:2603.28335] [Google Scholar]
- Trinca, A., Valiante, R., Schneider, R., et al. 2024, ArXiv e-prints [arXiv:2412.14248] [Google Scholar]
- Urry, C. M., & Padovani, P. 1995, PASP, 107, 803 [NASA ADS] [CrossRef] [Google Scholar]
- Vestergaard, M., & Osmer, P. S. 2009, ApJ, 699, 800 [Google Scholar]
- Volonteri, M. 2010, A&ARv, 18, 279 [Google Scholar]
- Wang, L., Berczik, P., Spurzem, R., & Kouwenhoven, M. B. N. 2014, ApJ, 780, 164 [Google Scholar]
- Winkel, N., Bennert, V. N., Remigio, R. P., et al. 2025, ApJ, 978, 115 [Google Scholar]
- Yue, M., Eilers, A.-C., Simcoe, R. A., et al. 2024, ApJ, 966, 176 [NASA ADS] [CrossRef] [Google Scholar]
- Zeltyn, G., Trakhtenbrot, B., Eracleous, M., et al. 2025, ArXiv e-prints [arXiv:2511.07532] [Google Scholar]
- Ziparo, F., Gallerani, S., Ferrara, A., & Vito, F. 2022, MNRAS, 517, 1086 [NASA ADS] [CrossRef] [Google Scholar]
- Zucchi, G., Ji, X., Madau, P., et al. 2026, A&A, 707, A52 [NASA ADS] [CrossRef] [EDP Sciences] [Google Scholar]
The number of steps chosen corresponds to about 100 autocorrelation time-scales, which is sufficient to guarantee robust optimisation.
Note that the values of Lbol reported here may differ slightly from those in M25, since they are consistently estimated from the XSPEC tables based on the inferred MBH and fEdd.
Where ṀEdd ≡ 16 LEdd/c2.
Appendix A: Corona properties
We have simplified the prescriptions of Madau & Haardt (2024) for super-Eddington flows as follows. We assume that a fraction fc of the available gravitational power is dissipated outside the optically and geometrically thick accretion flow in a hot corona. Magnetic buoyancy and fast reconnection have been postulated as possible mechanisms able to create a population of mildly relativistic, low-density electrons. We further assume that electrons in the corona follow a relativistic Maxwellian energy distribution. Under typical conditions the main cooling mechanism is unsaturated inverse Compton scattering. Under these model assumptions, we can write simple flux-balance equations (cf, Haardt & Maraschi 1991):
 (A.1)
(A.1)
where Fg is the gravitationally generated radiation flux locally emitted from the disk photosphere, ϵ ≡ ΔΩ/2π is the normalised solid angle formed by the disc funnel (assumed to be conical for simplicity), and a is the disc albedo.
The theory of thermal Comptonisation links the Compton flux Fc to the soft-photon input Fs through
 (A.2)
(A.2)
where A ≃ 16Θ2 + 4Θ is the inverse Compton amplification factor as a function of the dimensionless electron temperature of the corona Θ ≡ kTe/mec2, and p is the fraction of soft photons that are actually scattered by the corona. Soft photons can leave the funnel unscattered if the optical depth of the hot layer is τ ≤ 1. If the scattering probability in crossing once the hot-corona layer is p1 (with p1 ≃ τ for τ ≪ 1), multiple reflections on the accretion-flow funnelled surface when ϵ < 1 increase the total scattering probability to
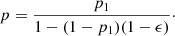 (A.3)
(A.3)
Note that for ϵ = 1 (i.e., a standard plane-parallel disc) p = p1, as expected. Finally, with the above set of relations, the amplification can be written as
![Mathematical equation: $$ \begin{aligned} A = \frac{1-(1-\epsilon /2)(1-a)}{p\big [(1-f_c)/f_c+(1-\epsilon /2)(1-a)\big ]}, \end{aligned} $$](/articles/aa/full_html/2026/06/aa59544-26/aa59544-26-eq8.gif) (A.4)
(A.4)
and, for any given values of fc, p1, and ϵ, the coronal equilibrium temperature Θ can be readily computed. A schematic illustration of the disk–corona configuration considered in this work is shown in Figure A.1.
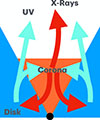 |
Fig. A.1. Schematic illustration of the disk-corona radiative coupling in super-Eddington accretion flows. Soft UV photons from the optically thick disk enter a hot corona confined within the narrow funnel, where they are Compton upscattered by the coronal plasma. In a geometrically thick funnel, the corona is additionally exposed to incoming radiation and multiple reflections from the surrounding walls, enhancing Compton cooling and yielding softer X-ray spectra than in the standard thin-disk scenario (Madau & Haardt 2024). |
As an example, we show in Fig. A.2 the dependence of Θ on the funnel half-opening angle for two different values of fc (red vs green lines) and p (solid vs dashed lines).
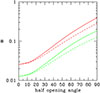 |
Fig. A.2. Dimensionless corona temperature Θ ≡ kTe/mec2 as a function of the funnel half-opening angle (in degrees). Red curves assume that all gravitational power is dissipated in the hot corona (fc = 1), while green curves correspond to fc = 0.5, with the remaining power released as thermal radiation in the accretion flow. Solid lines assume a single-pass scattering probability of soft photons by the corona of 30%, dashed lines of 50%. |
All Figures
|
Fig. 1. Effective electron temperature (red solid line) and X-ray photon index Γ (dashed blue line) as a function of the half-opening angle of the accretion disc funnel, as predicted by the model of Madau & Haardt (2024). The model accounts for coronal cooling due to inverse-Compton scattering of disc photons, which becomes increasingly efficient at high accretion rates, where the disc is geometrically thicker and the funnel correspondingly narrower. In this regime, the enhanced soft-photon flux leads to stronger cooling of the coronal plasma, resulting in progressively steeper hard X-ray spectra with increasing Eddington ratios. Details of the calculations are provided in Appendix A. |
| In the text | |
|
Fig. 2. Comparison between the expected KX for our sample of high-redshift AGNs (assuming the MBH and fEdd estimates from M25) for different spin values, and the observed lower limits from the X-ray non-detection, shown as triangles. Our models are shown with solid vertical bars spanning values expected for different spins, ranging between a• = 0 (upper bounds, implying higher bolometric corrections) and a• = 0.99 (lower bounds). The local scaling relation is shown as a red line, with the shaded area corresponding to a 1σ uncertainty (±0.26 dex), and the local observations by Duras et al. (2020) as grey points. Colour bars extending above the corresponding observed lower limits (shown in the same colour) indicate the existence of spin values consistent with the current Chandra non-detection. |
| In the text | |
|
Fig. 3. Same as Fig. 2 but assuming BH masses and accretion rates from Lupi et al. (2024b). We selected here the combination of MBH, fEdd, a• showing the highest KX correction among the ten solutions with the highest probability over the 32k samples. Bolometric corrections are corrected according to the predicted bolometric luminosity of each source. Nearly all systems allow for spin configurations consistent with the current X-ray non-detection. |
| In the text | |
|
Fig. 4. Example of a corner plot from the MCMC X-ray analysis for the GS8083 source. The orange lines and square marker show the reference values of MBH and fEdd from M25. The numerical values reported above each marginalised distribution correspond to the medians of the respective posteriors, while the [0.16, 0.5, 0.84] quantiles are shown as dashed blue lines. A bimodal structure is clearly visible in the posterior distributions of BH mass and accretion rates, with current literature estimates lying between the two solutions. Spin values are poorly constrained across the full set of MCMC samples. |
| In the text | |
|
Fig. 5. Comparison between the best-fit values of MBH (left panel) and Ṁ/ṀEdd (right panel) derived from the MCMC analysis (which includes constraints on the X-ray emission) and the estimates from M25 obtained using the single-epoch method. Given the bimodal posterior distributions found for all objects, the Monte Carlo samples are divided into two groups: low-mass, highly accreting systems (filled data points) and high-mass, almost inactive black holes (empty data points). Each pair of solutions for a given object is represented by a different marker. Data points for the low mass solution are colour-coded according to the ratio between the mean likelihoods obtained for the low-mass and high-mass solutions, where high values (red colours) suggest a preference for the former. The shaded grey regions indicate a deviation of 0.5 dex from the 1:1 relation. |
| In the text | |
|
Fig. 6. Same as Fig. 6, but here we compare the MBH and Ṁ/ṀEdd estimates obtained from the MCMC combined analysis that includes both the AGN X-ray non-detection and the broad-line emission constraints, with those from L24, where the MCMC analysis was based only on the broad-line emission properties. For reference, black data points show, on the y axis, the values reported in the literature based on single-epoch estimates. For each object, the low-mass, high-mass, and literature estimates are shown with the same marker. |
| In the text | |
|
Fig. 7. Black hole vs stellar mass relation for the 14 sources in the analysed sample. Filled and empty red squares show the results from the combined MCMC analysis, assuming the low-mass and high-mass solution, respectively. Filled blue data points show instead the original black hole mass estimates from M25. The local AGN sample from Reines & Volonteri (2015) is shown with blue stars and orange diamonds, while the underlying shaded regions indicate the 1σ and 2σ uncertainties around the best-fit relations for local inactive (grey) and active (cyan) galaxies. Note that we also include local AGN observational data from Winkel et al. (2025) and Zeltyn et al. (2025), which are more consistent with the inactive galaxy distribution. For reference, dotted black lines mark constant black hole–to–stellar mass ratios of 0.01 and 0.1. |
| In the text | |
|
Fig. 8. Intrinsic bolometric correction in the restframe [2−10] keV energy range (KX, [2 − 10] keV) as a function of the AGN bolometric luminosity. Coloured data points show the estimates for the selected AGN population obtained from the combined MCMC analysis, assuming the low-mass solution shown in Fig. 6. As a reference, we report with blue data points the results from Laurenti et al. (2022) for a population of highly accreting AGNs (λEdd > 1) observed at 0.4 ≤ z ≤ 0.75. Despite being characterised by typical bolometric luminosities ∼1 dex higher than our sample, these systems show a comparable intrinsic X-ray weakness. |
| In the text | |
|
Fig. 9. Cumulative black hole spin distribution predicted by the combined MCMC analysis based on X-ray and broad-line emission. Red and blue curves show the results for the high-mass and low-mass solutions, respectively. Assuming the high BH mass solution, the analysed population would systematically require low spin values, with a < 0.2 for ≈50% of sources, in order to remain consistent with the X-ray non-detections. |
| In the text | |
|
Fig. A.1. Schematic illustration of the disk-corona radiative coupling in super-Eddington accretion flows. Soft UV photons from the optically thick disk enter a hot corona confined within the narrow funnel, where they are Compton upscattered by the coronal plasma. In a geometrically thick funnel, the corona is additionally exposed to incoming radiation and multiple reflections from the surrounding walls, enhancing Compton cooling and yielding softer X-ray spectra than in the standard thin-disk scenario (Madau & Haardt 2024). |
| In the text | |
|
Fig. A.2. Dimensionless corona temperature Θ ≡ kTe/mec2 as a function of the funnel half-opening angle (in degrees). Red curves assume that all gravitational power is dissipated in the hot corona (fc = 1), while green curves correspond to fc = 0.5, with the remaining power released as thermal radiation in the accretion flow. Solid lines assume a single-pass scattering probability of soft photons by the corona of 30%, dashed lines of 50%. |
| In the text | |
Current usage metrics show cumulative count of Article Views (full-text article views including HTML views, PDF and ePub downloads, according to the available data) and Abstracts Views on Vision4Press platform.
Data correspond to usage on the plateform after 2015. The current usage metrics is available 48-96 hours after online publication and is updated daily on week days.
Initial download of the metrics may take a while.