


Fig. 5.
Download original image
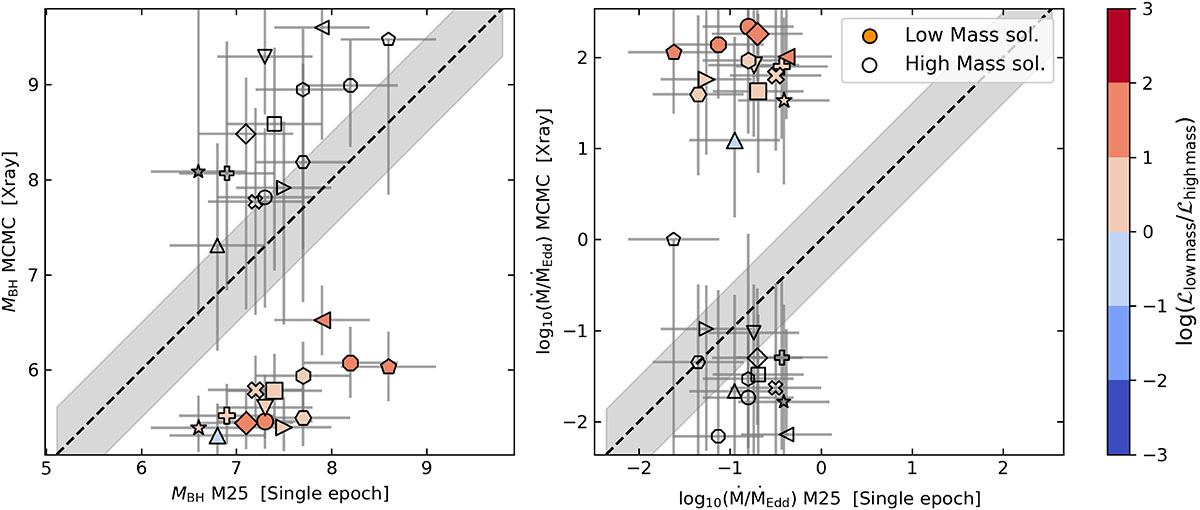
Comparison between the best-fit values of MBH (left panel) and Ṁ/ṀEdd (right panel) derived from the MCMC analysis (which includes constraints on the X-ray emission) and the estimates from M25 obtained using the single-epoch method. Given the bimodal posterior distributions found for all objects, the Monte Carlo samples are divided into two groups: low-mass, highly accreting systems (filled data points) and high-mass, almost inactive black holes (empty data points). Each pair of solutions for a given object is represented by a different marker. Data points for the low mass solution are colour-coded according to the ratio between the mean likelihoods obtained for the low-mass and high-mass solutions, where high values (red colours) suggest a preference for the former. The shaded grey regions indicate a deviation of 0.5 dex from the 1:1 relation.
Current usage metrics show cumulative count of Article Views (full-text article views including HTML views, PDF and ePub downloads, according to the available data) and Abstracts Views on Vision4Press platform.
Data correspond to usage on the plateform after 2015. The current usage metrics is available 48-96 hours after online publication and is updated daily on week days.
Initial download of the metrics may take a while.