


Fig. 2.
Download original image
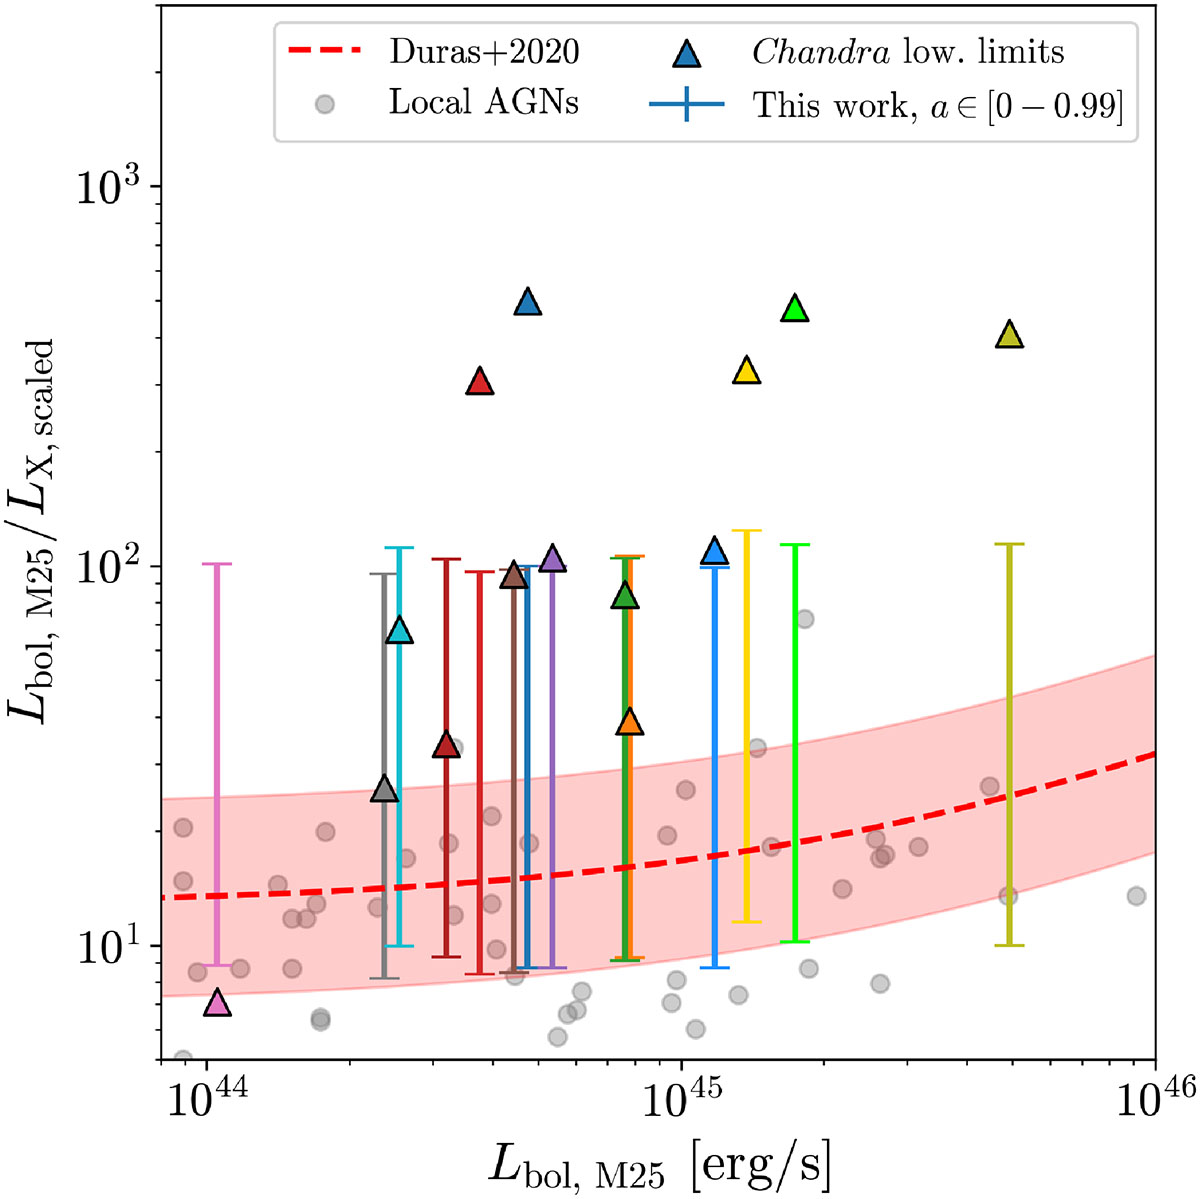
Comparison between the expected KX for our sample of high-redshift AGNs (assuming the MBH and fEdd estimates from M25) for different spin values, and the observed lower limits from the X-ray non-detection, shown as triangles. Our models are shown with solid vertical bars spanning values expected for different spins, ranging between a• = 0 (upper bounds, implying higher bolometric corrections) and a• = 0.99 (lower bounds). The local scaling relation is shown as a red line, with the shaded area corresponding to a 1σ uncertainty (±0.26 dex), and the local observations by Duras et al. (2020) as grey points. Colour bars extending above the corresponding observed lower limits (shown in the same colour) indicate the existence of spin values consistent with the current Chandra non-detection.
Current usage metrics show cumulative count of Article Views (full-text article views including HTML views, PDF and ePub downloads, according to the available data) and Abstracts Views on Vision4Press platform.
Data correspond to usage on the plateform after 2015. The current usage metrics is available 48-96 hours after online publication and is updated daily on week days.
Initial download of the metrics may take a while.