


Fig. 7.
Download original image
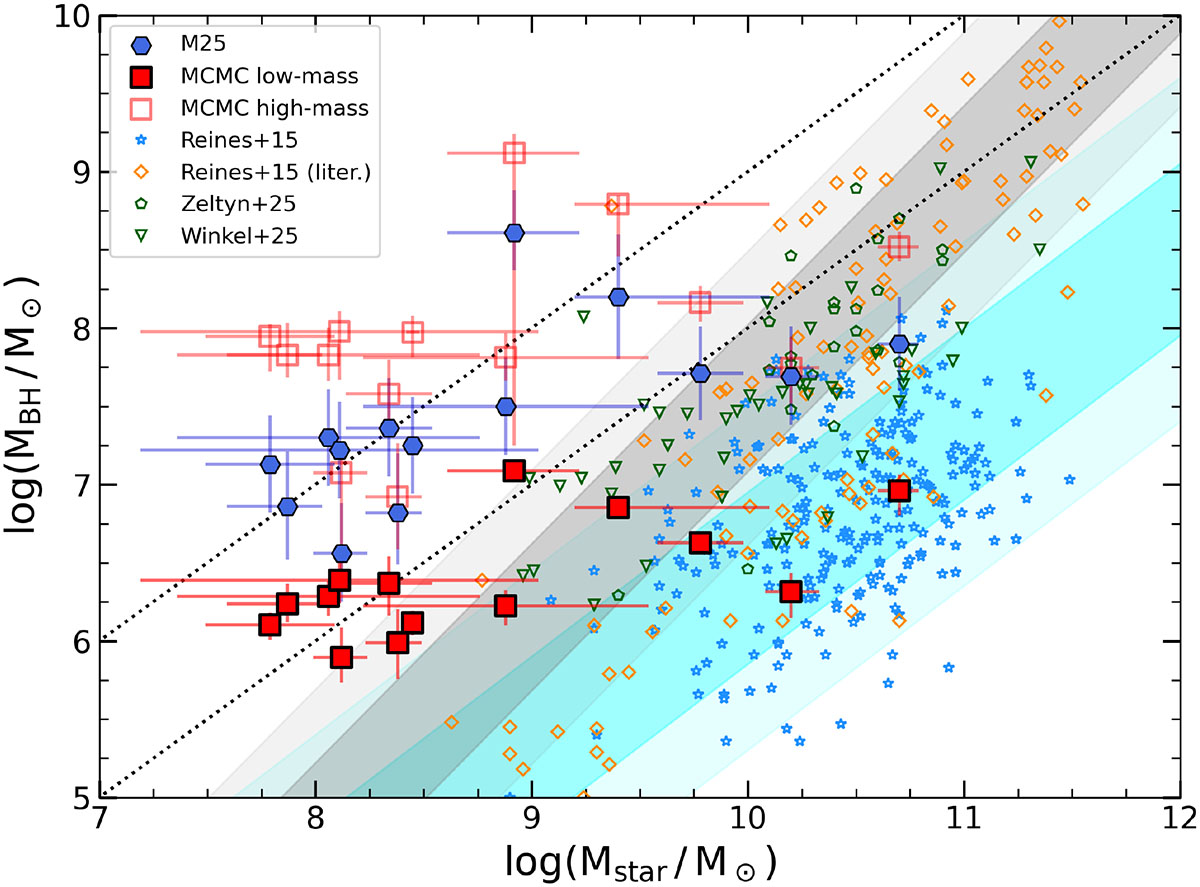
Black hole vs stellar mass relation for the 14 sources in the analysed sample. Filled and empty red squares show the results from the combined MCMC analysis, assuming the low-mass and high-mass solution, respectively. Filled blue data points show instead the original black hole mass estimates from M25. The local AGN sample from Reines & Volonteri (2015) is shown with blue stars and orange diamonds, while the underlying shaded regions indicate the 1σ and 2σ uncertainties around the best-fit relations for local inactive (grey) and active (cyan) galaxies. Note that we also include local AGN observational data from Winkel et al. (2025) and Zeltyn et al. (2025), which are more consistent with the inactive galaxy distribution. For reference, dotted black lines mark constant black hole–to–stellar mass ratios of 0.01 and 0.1.
Current usage metrics show cumulative count of Article Views (full-text article views including HTML views, PDF and ePub downloads, according to the available data) and Abstracts Views on Vision4Press platform.
Data correspond to usage on the plateform after 2015. The current usage metrics is available 48-96 hours after online publication and is updated daily on week days.
Initial download of the metrics may take a while.