


Fig. 4.
Download original image
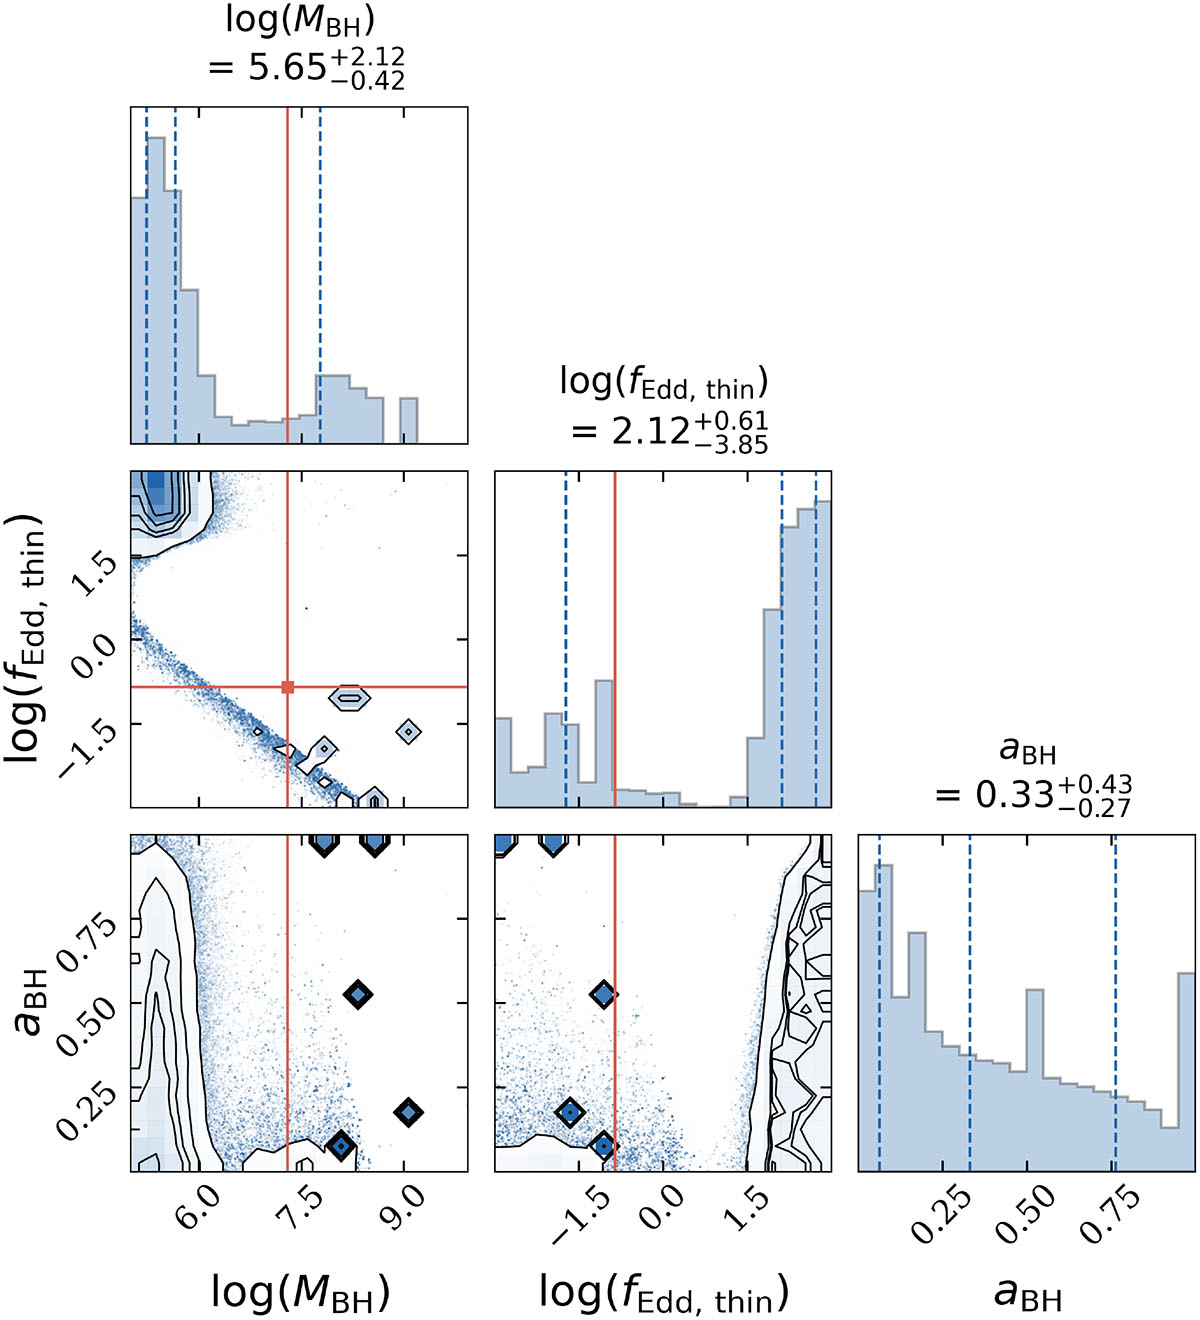
Example of a corner plot from the MCMC X-ray analysis for the GS8083 source. The orange lines and square marker show the reference values of MBH and fEdd from M25. The numerical values reported above each marginalised distribution correspond to the medians of the respective posteriors, while the [0.16, 0.5, 0.84] quantiles are shown as dashed blue lines. A bimodal structure is clearly visible in the posterior distributions of BH mass and accretion rates, with current literature estimates lying between the two solutions. Spin values are poorly constrained across the full set of MCMC samples.
Current usage metrics show cumulative count of Article Views (full-text article views including HTML views, PDF and ePub downloads, according to the available data) and Abstracts Views on Vision4Press platform.
Data correspond to usage on the plateform after 2015. The current usage metrics is available 48-96 hours after online publication and is updated daily on week days.
Initial download of the metrics may take a while.