


| Issue |
A&A
Volume 710, June 2026
|
|
|---|---|---|
| Article Number | A48 | |
| Number of page(s) | 9 | |
| Section | Galactic structure, stellar clusters and populations | |
| DOI | https://doi.org/10.1051/0004-6361/202659508 | |
| Published online | 28 May 2026 | |
The Bulge Cluster Origin (BulCO) survey with CRIRES at the ESO-VLT: A chemical screening of the globular cluster NGC 6553★
1
Dipartimento di Fisica e Astronomia, Università degli Studi di Bologna,
Via Gobetti 93/2,
40129
Bologna,
Italy
2
INAF, Osservatorio di Astrofisica e Scienza dello Spazio di Bologna,
Via Gobetti 93/3,
40129
Bologna,
Italy
3
European Southern Observatory,
Karl-Schwarzschild-Strasse 2,
85748
Garching bei München,
Germany
4
Excellence Cluster ORIGINS,
Boltzmann-Strasse 2,
85748
Garching Bei München,
Germany
★★ Corresponding author: This email address is being protected from spambots. You need JavaScript enabled to view it.
Received:
19
February
2026
Accepted:
20
April
2026
Abstract
In this paper, we present the chemical screening of the stellar population belonging to the globular cluster NGC 6553 in the Galactic bulge. This study has been conducted in the contest of the Bulge Cluster Origin (BulCO) survey, an ESO-VLT Large Program that is currently ongoing with CRIRES in the near-infrared (NIR) domain. This survey is performing an unprecedented chemical screening of 17 stellar systems orbiting the Milky Way bulge, with the aim of unveiling their origin and true nature. Here we present and discuss the abundances of 18 elements produced via distinct nucleosynthetic channels for 14 red giant branch stars belonging to NGC 6553. We found a mean [Fe/H] = −0.20 ± 0.01 deX, and about solar-scaled iron-peak elements, confirming that this is one of the most metal-rich globular clusters in the Milky Way. We also found [X/Fe] enhancement of α and several other light elements. Furthermore, we assessed the presence of multiple populations typical of genuine globular clusters from the significant spreads in Na, N, and C, along with an almost vertical Na-O anticorrelation. Finally, by using classical ([α/Fe] versus [Fe/H]) and newly-defined ([V/Fe] and [Zn/Fe] versus [Fe/H]) “chemical DNA tests”, we have proven its in situ formation within the Galactic bulge.
Key words: techniques: spectroscopic / stars: abundances / stars: late-type / Galaxy: bulge / infrared: stars / globular clusters: individual: NGC 6553
Based on observations collected at the Very Large Telescope of the European Southern Observatory at Cerro Paranal (Chile) under Large Program 110.24A4 (PI: Ferraro).
© The Authors 2026
 Open Access article, published by EDP Sciences, under the terms of the Creative Commons Attribution License (https://creativecommons.org/licenses/by/4.0), which permits unrestricted use, distribution, and reproduction in any medium, provided the original work is properly cited.
This article is published in open access under the Subscribe to Open model. This email address is being protected from spambots. You need JavaScript enabled to view it. to support open access publication.
1 Introduction
Galactic globular clusters (GCs) are true touchstones for astrophysics and likely among the most studied cosmic objects. With ages of ∼12 Gyr (e.g., VandenBerg et al. 2013; Valcin et al. 2020), they are fossils of the formation epoch of the Milky Way and crucial insights into the evolutionary history of our galaxy can be obtained through their study (e.g., Searle & Zinn 1978; Massari et al. 2019). The best studied GCs so far are those orbiting the Milky Way halo because the prohibitive crowding conditions and the large extinction in the bulge direction have posed challenges to the exploration of the stellar systems hosted in this portion of the Galaxy (see e.g. Ortolani et al. 1997, 1999, 2001, 2007; Valenti et al. 2004, 2010; Cohen et al. 2021; Souza et al. 2024). Nonetheless, the Galactic bulge represents the first massive structure to have formed in the Milky Way and it is the only spheroid for which the kinematic, photometric, and chemical properties of individual stars can be studied. Therefore, the analysis of its stellar clusters provides a unique opportunity to explore the formation and early evolutionary processes of the Galaxy.
Fortunately, the difficulties of observing the Galactic bulge have been minimized in recent years by the introduction of high-spatial-resolution detectors in the near-infrared (NIR) domain. This has given rise to novel research initiatives that use NIR observations to study bulge stellar systems in detail. For instance, the bulge Cluster APOgee Survey (CAPOS) takes advantage of the APOGEE-2S spectrograph to obtain precise chemical abundances and kinematic measurements for a substantial number of bulge GCs (Geisler et al. 2021, 2025; Romero-Colmenares et al. 2021; Fernández-Trincado et al. 2022; Barrera et al. 2025; Frelijj et al. 2025; González-Díaz et al. 2023; Henao et al. 2025; Uribe et al. 2025). With respect to the present study, our project is aimed at fully characterizing bulge stellar systems by combining high-resolution and multiwavelength photometric and spectroscopic observations, proper motion (PM) membership selection, and an accurate correction for the effects of differential reddening, combined with a detailed characterization of the extinction law in the direction of each cluster (see, e.g., Saracino et al. 2015, 2016, 2019; Pallanca et al. 2019, 2021a,b, 2023; Deras et al. 2023; Loriga et al. 2025).
This exploration has led to the discovery and the characterization of two peculiar stellar systems with the appearance of genuine GCs, but hosting multi-age and multi-iron subpopulations: Terzan 5 (Ferraro et al. 2009, 2016) and Liller 1 (Ferraro et al. 2021; see also Pallanca et al. 2021a). Their anomalous properties suggest they are self-enriched structures (Romano et al. 2023) that have experienced complex star formation histories (see Dalessandro et al. 2022; Crociati et al. 2024). Their [α/Fe]-[Fe/H] patterns are incompatible with those observed in local dwarf galaxies and in the Milky Way halo and disk, whereas they are in striking agreement with that of the bulge (Origlia et al. 2011, 2013, 2019, 2025; Massari et al. 2014; Crociati et al. 2023; Souza et al. 2023; Alvarez Garay et al. 2024; Fanelli et al. 2024; Ferraro et al. 2025). All these properties suggest they are not genuine GCs, but rather the remnants of massive primordial structures that contributed to form the Galactic bulge (Ferraro et al. 2021) and they are likely to be the most efficient factories of gravitational wave sources in spirals (see Ferraro et al. 2026).
In addition to these fossil remnants, which trace the very first phases of the bulge formation process, and to genuine GCs that formed in situ, a variety of other objects mapping different phenomena are expected to populate the bulge and appear as old stellar systems: genuine GCs that formed in an external galaxy and were brought into the bulge by early and massive accretion events (e.g., Massari et al. 2026), and possibly nuclear star clusters of cannibalized structures. The signatures of different origins are imprinted in the physical and chemical properties of these stellar systems. Hence, a detailed chemical screening is needed to address the origin of each stellar system. Indeed, this is the aim of the Bulge Cluster Origin (BulCO) survey (Ferraro et al. 2025), which has been specifically designed to perform a high-resolution spectroscopic screening of the stellar population hosted in 17 GC-like stellar systems orbiting the Galactic bulge. It combines the high spectral resolution of CRIRES (R = 50 000) with the large aperture of the VLT telescope. The survey will provide a homogeneous measure of the chemical abundances of ∼20 different elements for 20-25 stars in each cluster. The abundances of iron, iron-peak, neutron-capture, CNO, and other «- and light-elements will be measured and used as chemical DNA tests to distinguish the true nature and origin of each target. In fact, stars formed in environments with different star formation rates (SFRs) are expected to show different chemical patterns, such as those seen in the [«/Fe]-[Fe/H] diagram, which are so distinctive that they can be used as a sort of DNA test to assess the stellar population origin (Horta et al. 2020; Monty et al. 2024; Ceccarelli et al. 2024). The target stars are all located in the very central region of the host stellar system, thus maximizing their membership probability, and span a significant portion of the RGB, thus sampling a large range of luminosities. These are almost unique features in the chemical investigation of bulge GCs in the NIR domain. In fact, other past and ongoing surveys, performed either with echelle or with multi-object spectrographs, typically at smaller aperture telescopes, are significantly more limited in: (1) the number of observed stars per cluster, which is typically <10; (2) the radial location of the targets, which is mostly restricted to the outer cluster regions, where field contamination is much more severe; (3) the spanned luminosity/temperature range, which is typically limited only to the brightest and coolest giants near the RGB-tip, whose spectra are more affected by molecular blending and blanketing; (4) the number of measured chemical elements, which is typically a dozen at most, thus missing crucial diagnostics. All these limitations make it difficult to use the obtained results as solid constraints to the formation and evolutionary processes of each system, especially in the case of complex scenarios as for Terzan 5 and Liller 1.
In this paper, we present the results of the chemical screening of the bulge, metal-rich GC NGC 6553. In Sect. 2, we present the results of previous chemical studies of this system. In Sect. 3, we describe the target selection, the assessment of their membership through PMs, and the performed observations. The estimated stellar parameters and radial velocity measures are reported in Sect. 4. The chemical analysis and the resulting chemical abundances are described in Sect. 5. Finally, in Sect. 6 we discuss the results and draw our conclusions.
2 Previous chemical studies of NGC 6553
NGC 6553 is one of the most metal-rich GCs in the Galactic bulge, located at 2.2 kpc from the Galactic center (αJ2000 = 18h09m17.6s, δj2000 = −25°54′31.3″, l = 5.26°, b = −3.03°; Harris 2010) and at 6.0 kpc from the Sun. It presents a reddening E(B-V)=0.63 (Harris 2010), an age of approximately 11 Gyr (Ortolani et al. 2025), and a mass of (2.35 ± 0.19) × 105 M⊙ (Baumgardt & Hilker 2018; roughly corresponding to an absolute V-band magnitude MV = −7.7), which would place NGC 6553 in the intermediate-mass range of the Galactic GC distribution.
Several chemical studies have been conducted on NGC 6553 given its relatively loose and uncrowded structure, as well as its considerably lower reddening compared to the majority of bulge GCs. Barbuy et al. (1992) estimated a metallicity [Fe/H] ≈ -0.2 from CCD echelle spectra of a cool giant at a resolution R ∼ 20 000. Subsequently, Barbuy et al. (1999) measured [Fe/H] = −0.55 and an overabundance of α-elements for two member stars. Cohen et al. (1999) analyzed five horizontal branch (HB) stars using higher resolution HIRES spectra (R ∼ 34000) and found a mean value of [Fe/H] = −0.16 and an excess of α-elements with respect to the solar value. Origlia et al. (2002) analyzed two cool giants from IR spectra in the H band at moderate resolution (R∼25 000) and determined a mean metallicity of [Fe/H] = −0.3 and [α/Fe] = +0.3. Later, Meléndez et al. (2003) studied five giant stars using highresolution IR spectra (R∼50 000) in the H band, acquired with the Gemini-South telescope, finding a metallicity of [Fe/H] = −0.20 and an overabundance in oxygen with respect to the solar value from infrared OH lines. Similar results were found by Alves-Brito et al. (2006), who performed a detailed abundance analysis of four giants using optical high-resolution (R∼ 55 000) echelle spectra obtained with UVES at the ESO VLT-UT2 Kueyen telescope. These are the highest resolution observations in the optical band available for this cluster. In addition, Johnson et al. (2014) used high-resolution FLAMES/GIRAFFE spectra (R ∼ 20000) to study the behavior of light-, «- and Fe-peak element abundances of 12 likely member stars, finding trends that are nearly identical to those of bulge field stars with a comparable metallicity. Similar results regarding the metallicity of NGC 6553 were recently obtained by Schiavon et al. (2017) and Tang et al. (2017) through the chemical analysis of red giants using APOGEE,s spectroscopy, by Muñoz et al. (2020) through the study of seven member stars using the VLT/UVES spectrograph, and by Montecinos et al. (2021) with the extensive spectral analysis of 20 HB stars. These latest chemical analyzes also reveal the presence of anticorrelations between pairs of light-elements and, consequently, the existence of multiple populations within this cluster.
3 Observations and data reduction
The BulCO survey takes advantage of the enhanced performance of the CRyogenic high-resolution InfraRed Echelle Spectrograph (CRIRES; Kaeufl et al. 2004; Dorn et al. 2014; Dorn et al. 2023) at the ESO Very Large Telescope (VLT). The targets were selected using high-resolution photometric data and PM-based cluster memberships. Figure 1 shows the positions of the 14 selected stars in the NIR color-magnitude diagram (CMD) and on the plane of the sky with respect to the center of the system. Our targets are luminous giants, at least 1 magnitude brighter than the red clump. All are located in the central region of NGC 6553 within approximately 1′ from the center, which is equivalent to twice the core radius (rc = 0.53′; Harris 1996). Table 1 lists the coordinates and the J- and K-band magnitudes (from Valenti et al. 2007) of observed targets.
We used Gaia DR3 PMs (Gaia Collaboration 2016, 2023), which show a distribution peaked at μαcosδ = 0.344 mas yr−1, μδ = −0.454 mas yr−1, with a dispersion σPM∼0.3 mas yr−1 in both the α and δ components (Vasiliev & Baumgardt 2021). We assumed that all the stars with PMs within 3 × σPM from the absolute systemic value are likely members of NGC 6553 (see Figure 2). There was no Gaia PM measurement available for one of the targets (i.e., 170). Nevertheless, its position in the CMD, its central location and its measured radial velocity (see Section 4) indicate a high probability of cluster membership. Thus, we decided to include this star in the final sample.
High-resolution CRIRES spectra of the 14 giant stars of NGC 6553 were acquired between April 2023 and July 2024 under favorable sky conditions of clearness and seeing. All observations were performed with the 0.4″ wide slit, thus providing an overall spectral resolution of R ~ 50000. For each target, observations were made with gratings J1226 (11161356 nm) and H1582 (1484-1854 nm). These gratings sample a substantial number of unblended spectral lines of iron, iron-peak elements, neutron-capture elements, α-elements, and light-elements, as well as a few dozen OH and CO molecular lines.
Data reduction was performed using the CR2RES version 1.4.4 pipeline1. After the standard dark- and flat-field corrections, each spectrum was sky-subtracted using nod pairs, calibrated in wavelength using arc lamps, and then extracted using the optimum extraction method. This approach minimizes the loss of spectral resolution, maximizes the signal-to-noise ratio, and efficiently identifies local outliers or defects. The resulting 1D spectra were then normalized and corrected for telluric features, so that they could be adequately compared to synthetic spectra. The telluric spectra were extracted from the TAPAS portal2. The signal-to-noise ratio per resolution element of the final spectra was always ≥40.
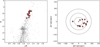 |
Fig. 1 Spectroscopic targets (red squares) observed in NGC 6553. Left panel: (K, J-K) CMD of the cluster (gray dots) with highlighted the target stars for which we measured chemical abundances (from Valenti et al. 2007). Right panel: position of the targets in the plane of the sky with respect to the cluster center (cross). The dashed black circles have radii equal to one, two, and three times the core radius, which is rc = 0.53′ (Harris 1996). |
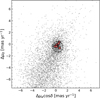 |
Fig. 2 Vector point diagram obtained from Gaia DR3 PMs, for the stars located within 200” from the center of NGC 6553 (gray dots). The 13 spectroscopic targets with measured PM are reported as red filled squares. The dashed circle has a radius equal to 3 × σPM, with σPM = 0.3 mas yr−1 being the PM dispersion of NGC 6553 member stars. All the spectroscopic targets with measured PM are located within it and have thus been included in this study. |
Coordinates, J-band and K-band magnitudes, atmospheric parameters, and heliocentric radial velocities of the observed stars in NGC 6553.
4 Stellar parameters and radial velocities
An accurate determination of the stellar parameters and radial velocities of the observed stars is a fundamental step of the spectral analysis, since it is preparatory for subsequent measurements of chemical abundances. A first photometric estimate of surface temperature (Teff) and gravity (log g) of the spectroscopic targets were obtained through perpendicular projection of each star onto the best-fit isochrone in the CMD shown in Fig. 1. To this aim, a 11 Gyr old isochrone of appropriate metal-licity ([M/H] = −0.1) from the PARSEC database (Bressan et al. 2012; Marigo et al. 2017) has been used. These initial estimates of the stellar parameters were then spectroscopically refined by fitting the observed molecular OH and CO lines and band-heads simultaneously (see the final values in Table 1).
Temperatures in the 3800-4150 K range (with uncertainties of ±100 K), and surface gravities, log g, in the 1.00-1.50 dex interval (with uncertainties of ±0.3 dex) were estimated. Additionally, a microturbulence velocity of 2 ± 0.3 km s−1 was adopted for all observed stars. This value is typical of bulge giant stars with similar temperatures and metallicities (see also Alvarez Garay et al. 2024; Fanelli et al. 2024).
The radial velocities of the 14 RGB stars were measured by means of cross-correlation between the observed spectra and suitable templates. The resulting heliocentric values (see Table 1) range from -10 to 16 km s−1 with uncertainties of around 1 km s−1. The error analysis for individual stars was carried out as described by Tonry & Davis (1979). For our sample, the mean radial velocity is 1.4 ± 1.9 km s−1 with a 1σ dispersion of 7.3 km s−1. This value is in good agreement with other results in the literature reporting the mean velocity of NGC 6553: 4 ± 7.1 km s−1 (Cohen et al. 1999), 1.6 ± 6 km s−1 (Meléndez et al. 2003), -1.86 ± 2.01 km s−1 (Alves-Brito et al. 2006), -2.03 ± 4.85 km s−1 (Johnson et al. 2014), 6 ± 8 km s−1 (Dias et al. 2015), -0.14 ± 5.47 km s−1 (Tang et al. 2017) and -3.86 ± 2.12 km s−1 (Muñoz et al. 2020).
5 Chemical abundances
To measure the chemical abundances, multiple grids of synthetic spectra were generated by adopting the stellar parameters estimated for each star and varying the metallicity from -1.0 dex to +0.5 dex, in steps of 0.25 dex. We also considered some enhancement of [α/Fe] (+0.3 dex) and [N/Fe] (+0.5 dex) and a corresponding depletion of [C/Fe] (-0.3 dex) for a proper computation of the molecular equilibria. We assumed solar-scaled [X/Fe] values for the other elements. These synthetic spectra were computed by adopting the list of atomic lines from the VALD3 compilation (Ryabchikova & Pakhomov 2015) and calibrated on Arcturs (see Fanelli et al. 2021), molecular lines from the website of B. Plez3, MARCS models atmospheres (Gustafsson et al. 2008), and the radiative transfer code TURBOSPECTRUM (Alvarez & Plez 1998; Plez 2012). Initially computed at the nominal CRIRES resolution (R ∼50000), the synthetic spectra were then convoluted with a Gaussian function at R ∼ 29 000 to account for some additional spectral broadening resulting from macroturbulence, thereby providing an optimal match to the observed line profile.
The chemical abundances of Fe, α-elements (Mg, Si, Ca, O, S), light-elements (C, N, Na, Al, K, Ti), iron-peak elements (Ni, Cr, V, Zn, Cu) and neutron-capture elements (Ce) were determined via spectral synthesis for each selected star. The final values and their corresponding errors are listed in Table A.1 in the appendix. The formal error was calculated by dividing the standard deviation by the square root of the number of lines used. If only one line was available, a conservative value of 0.10 dex was assumed. However, the global error of each abundance ratio amounts to 0.10-0.15 dex, mainly due to the uncertainties in the atmospheric parameters (especially temperature). The majority of the chemical abundances (Fe, Na, Mg, Al, Si, S, K, Ca, Ti, V, Cr, Ni, Cu, Zn, and Ce) have been determined from atomic lines in the J and H bands. Those of O and N have been derived, respectively, from OH molecular transitions in the H band and from CN molecular transitions in both the J and H bands. C abundance has been obtained from CO molecular transitions and bandheads and from atomic lines in the H band. Figure 3 shows the abundance ratios [X/Fe] of all chemical elements measured in the CRIRES spectra as a function of [Fe/H]. An accurate description of these trends is presented in the following sections.
5.1 Iron and iron-peak elements
Iron-peak elements are defined as elements with atomic numbers in the range 21 ≤ Z ≤ 32, from scandium to germanium. These elements are produced through complex nucleosynthesis processes and are divided into two main groups: the lower iron group, with 21 ≤ Z ≤ 26, and the upper iron group, with 27 ≤ Z ≤ 32 (Woosley & Weaver 1995). They can be generated by core-collapse supernovae (SNe), including Type II SNe and hypernovae, as well as Type Ia SNe.
We found an average [Fe/H] = −0.20 ± 0.01 dex, with a 1σ scatter of 0.02, which classifies NGC 6553 as one of the most metal-rich GCs of the Galaxy. The result of the present study is fully consistent within about ±0.1 dex with previous medium-high resolution spectroscopic works (Cohen et al. 1999; Meléndez et al. 2003; Alves-Brito et al. 2006; Harris 2010; Tang et al. 2017; Muñoz et al. 2020; Montecinos et al. 2021).
In this work, we also measured the chemical abundance of other five iron-peak elements belonging to both groups: V, Cr, Ni, Cu, and Zn. In Figure 3, their [X/Fe] abundance ratios are plotted versus [Fe/H], and they are compared with those measured in bulge field stars. In the case of vanadium, the comparison is made with disk field stars due to the unavailability of high-resolution measurements of this element for bulge objects. All these elements show [X/Fe] abundance ratios around solar-scaled values within ±0.10 dex. V, Cr, and Ni consistently trace iron, whereas Cu and Zn have a more complex nucleosynthesis, with part of their solar abundance attributed to weak s-processes in massive stars (Bisterzo et al. 2005; Romano & Matteucci 2007).
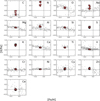 |
Fig. 3 Behavior of iron-peak, neutron-capture, CNO, α- and light-element abundances as a function of [Fe/H] for the observed stars of NGC 6553 (red filled squares). The dashed vertical and horizontal lines indicate the corresponding solar [Fe/H] and [X/Fe] values. The small gray circles mark the abundances of bulge field stars as measured by Rich et al. (2012) for C, O, Mg, Al, Si, Ca, and Ti, Johnson et al. (2014) for O, Na, Mg, Al, Si, Ca, Cr, Ni, and Cu, Barbuy et al. (2015) for Zn, and Van der Swaelmen et al. (2016) for Ce. The only exception is V, whereby gray circles correspond to disk field stars (from Battistini & Bensby 2015). |
5.2 Alpha and other light elements
In this study, we measured the chemical abundances for five α-elements, namely O, Mg, Si, Ca, S, and for other light elements, namely C, N, Na, Al, K, and Ti. An average [X/Fe] enhancement with respect to the solar-scaled values was measured in the case of α-elements, in agreement with other spectroscopic studies of NGC 6553 (see e.g. Cohen et al. 1999; Origlia et al. 2002; Meléndez et al. 2003; Tang et al. 2017; Muñoz et al. 2020) and with the values measured in bulge field stars at a similar metallic-ity. [X/Fe] enhancements were also measured in the cases of Al, K, and Ti. It turns out that [N/Fe] tends to be significantly more enhanced with respect to the solar-scaled value, with a bimodal distribution around average values of about +0.55 and +0.85 dex. The [Na/Fe] ratio also appears to be enhanced with respect to the solar-scaled value, and it clearly shows a significant spread, with values ranging between +0.1 and +0.6 dex. Finally, C is the only light element whose [X/Fe] abundance ratio is normally depleted with respect to the solar-scaled value, with [C/Fe] values ranging between -0.5 and about 0.0 dex. We were also able to measure the 12C/13C isotopic ratio, finding values between 9 and 13. The inferred [C/Fe] depletion and low 12C/13C isotopic ratios are indicative that mixing and extra-mixing processes are occurring during the evolution along the RGB, although given the relatively small range of stellar temperatures covered by our sample of stars in NGC 6553, we did not find any significant trend with Teff.
5.3 Neutron-capture elements
Neutron-capture elements are primarily synthesized via two processes: either the slow (s) process or the rapid (r) process. In short, the s-process builds heavy elements through slow neutron captures in low-mass AGB stars, as well as fast-rotating, low-metallicity massive stars. In the r-process, instead, the neutron capture rate is much faster than the ß-decay rate of unstable nuclei, which requires high neutron-density environments such as magnetorotational-driven SNe, collapsars, or merging neutron stars. In this paper, we measured the chemical abundance of Ce. In the solar isotopic mixture, the s-process has been identified as the predominant mechanism for Ce production, with a s/r-process ratio of 85/15 (Bisterzo et al. 2014; Prantzos et al. 2020). We measured the Ce abundance using a single ionized line at 15784.786 Å in the H band, and the astrophysical log gf value (transition probability; g = statistical weight, f = oscillator strength) from Cunha et al. (2017). As illustrated in Figure 3, the [Ce/Fe] abundance ratio for our NGC 6553 star sample is consistently about solar-scaled.
6 Discussion and conclusions
Our CRIRES high-resolution spectroscopic study of 14 RGB stars likely members of NGC 6553 is part of the BulCO survey, an ESO-VLT Large Program specifically aimed at investigating the origin of the most massive and peculiar stellar clusters in the Galactic bulge. It has included precise abundance measurements for 18 chemical elements.
The inferred iron and iron-peak element abundances consistently trace a high-metallicity of about -0.2 dex for this cluster. An [X/Fe] enhancement of N, O, and other alpha and light elements was found, along with [C/Fe] depletion with respect to the solar-scaled value.
To quantitatively evaluate the presence of elemental abundance spreads within the investigated sample of stars, we computed, for each chemical species, the average abundance measurement of the 14 stars with its associated error and its corresponding intrinsic spread σint (see the top and bottom panels of Figure 4, respectively). Most of the elements display a σint spread below 0.03 dex, thereby suggesting an homogeneous chemistry within the errors. Notable exceptions are O (σint = 0.05 dex) and especially C, N, and Na, which show spreads in the 0.15-0.20 dex range. This type of behavior is not unexpected, since GC stars (unlike galactic field stars) do tend to exhibit significant spreads in light-elements and specific correlations/anticorrelations (Carretta et al. 2009b). The exact origin of these variations is still a matter of debate (e.g., Bastian & Lardo 2018; Gratton et al. 2019 for reviews on the subject); however, they are commonly believed to have formed during the very early phases of GC formation and evolution (10-100 Myr). The observed trends are suggested to be signatures of the activation of specific nuclear cycles, such as the CNO, NeNa, and MgAl modes of hydrogen burning (see e.g., Arnould et al. 1999; Carretta et al. 2009b).
The most common chemical signature of the presence of multiple populations, which characterizes nearly all GCs, is the Na-O anticorrelation. The present study reveals a rather steep Na-O anticorrelation in NGC 6553 (Figure 5, panel a), with a small spread in O and a rather large spread in Na. Another important chemical signature is the Mg-Al anticorrelation, although it is not consistently observed in all GCs and its presence may depend on the mass and metallicity of the cluster (Carretta et al. 2009a). We do not find evidence of Mg-Al anticorrelation in our study of NGC 6553 (see Figure 5, panel b), which is consistent with the high metallicity of this cluster. We also find a quite tight anticorrelation between N and C, with at least one main gap in the distribution between C-rich/N-poor and C-poor/N-rich (Fig. 5, panel c), and only a modest correlation between 12C/13C and [C/Fe] (Fig. 5, panel d). N-C anticorrelation and some 12C/13C-C correlation are usually observed both in field and cluster giants due to mixing and extra-mixing processes during the evolution along the RGB, and more evolved (i.e. cooler and more luminous) giants typically exhibit more mixing. The rather low values of 12C/13C measured in all the sampled stars of NGC 6553 definitely indicate that mixing and extra-mixing are at work in all of them. However, mixing alone cannot easily explain the presence of the two rather distinct N-poor/C-rich and N-rich/C-poor groups of stars in the N-C plane, given also that all these stars have rather homogeneous stellar parameters and low 12C/13C. Interestingly, the C-poor/N-rich stars are also the Na-rich ones (see Figure 5, panels e and f), suggesting that this group of stars likely formed from gas enriched in N and Na by a previous generation of (N- and Na-poor, C-rich) stars. Hence, when taken together, the inferred Na-O and N-C distributions seem to provide a solid evidence of the presence of multiple populations in NGC 6553, thereby classifying it as a genuine GC. This result is also consistent with the findings of Tang et al. (2017) and Muñoz et al. (2020).
From a dynamic perspective, the nature of NGC 6553 remains a subject of debate. In fact, while Massari et al. (2019), eDR3 edition4, and De Leo et al. (2026) classify it as an in situ GC, Callingham et al. (2022) classified it as accreted and, in particular, identified it as belonging to the Kraken group. The resolution of this debate can be achieved by incorporating chemical information.
As discussed in Ferraro et al. (2025, and references therein), a few specific abundance ratios are able to constrain chemical enrichment timescales and formation scenarios. In this respect, the [X/Fe] abundance ratios of α-elements, V and Zn are especially interesting as possible chemical DNA tests (see e.g., Minelli et al. 2021a; Mucciarelli et al. 2021). α-elements are primarily produced by Type II SNe (Woosley & Weaver 1995), with yields that depend on the progenitor’s mass. In the metallicity range of NGC 6553, V and Zn are mainly produced in highmass (≥20 M⊙) stars, as a result of the explosion of Type II SNe and electron-capture SNe (Romano et al. 2010; Kobayashi et al. 2020; Palla 2021). Consequently, their abundance ratios are predicted to be larger in high SFR environments, where massive star production is significantly higher compared to low SFR systems. This allows for a clear distinction between in situ-formed and accreted GCs. By using Mg, Si, and Ca (α-elements that are not expected to show significant spread at high metallicity), we computed an average [α/Fe] = +0.26 ± 0.02 dex enhancement and average [V/Fe] and [Zn/Fe] values that are consistent with being solar-scaled or scarcely (if at all) enhanced. As illustrated in Figure 6, our results for NGC 6553 show good agreement with the corresponding abundance patterns of the bulge and prominent differences with respect to those (significantly lower) measured in Milky Way satellites.
Considering the cluster’s age and metallicity, NGC 6553 is comparable to the population of in situ Milky Way GCs, while the stellar systems associated to Sagittarius and the Gaia-Sausage-Enceladus dwarf galaxy exhibit much lower metallici-ties, on the order of [M/H] = −1.0 dex (see Massari et al. 2026).
In conclusion, our high resolution chemical study of NGC 6553 indicates that this stellar system is a genuine, metal-rich GC, that formed and evolved in situ within the Galactic bulge.
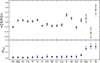 |
Fig. 4 Top panel: average abundance of each chemical element for the star sample (red filled circles) with their corresponding error. The gray dots refer to the measurements obtained for each individual star. Bottom panel: intrinsic σ-value for each chemical element with the corresponding error (blue filled circles). |
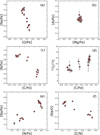 |
Fig. 5 Trends between pairs of light-element abundance ratios for the observed stars of NGC 6553, tracing the presence of multiple stellar populations. |
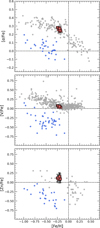 |
Fig. 6 Behavior of [α/Fe], [V/Fe] and [Zn/Fe] as a function of [Fe/H] for NGC 6553 (red filled squares). The α-element abundance is the average of Mg, Si, and Ca abundances for each star. For comparison, the abundance ratios measured in Milky Way stars (gray circles; Rich et al. 2012; Johnson et al. 2014; Battistini & Bensby 2015; Barbuy et al. 2015) and in the Magellanic Clouds and Sagittarius dwarf galaxy (blue circles; Minelli et al. 2021b) are also shown. Abundances of NGC 6553 are consistent with those observed in the Milky Way. |
Acknowledgements
This work is part of the project “GENESIS - Searching for the primordial structures of the Universe in the heart of the Galaxy” (Advanced Grant FIS-2024-02056, PI:Ferraro), funded by the Italian MUR through the Fondo Italiano per la Scienza call. CF and LO acknowledge the financial support by INAF within the VLT-MOONS and ELT-ANDES projects. ED acknowledges financial support from the INAF Data analysis Research Grant (PI E. Dalessandro) of the “Bando Astrofisica Fondamentale 2024”.
References
- Alvarez, R., & Plez, B. 1998, A&A, 330, 1109 [NASA ADS] [Google Scholar]
- Alvarez Garay, D. A., Fanelli, C., Origlia, L., et al. 2024, A&A, 686, A198 [NASA ADS] [CrossRef] [EDP Sciences] [Google Scholar]
- Alves-Brito, A., Barbuy, B., Zoccali, M., et al. 2006, A&A, 460, 269 [NASA ADS] [CrossRef] [EDP Sciences] [Google Scholar]
- Arnould, M., Goriely, S., & Jorissen, A. 1999, A&A, 347, 572 [NASA ADS] [Google Scholar]
- Barbuy, B., Castro, S., Ortolani, S., & Bica, E. 1992, A&A, 259, 607 [NASA ADS] [Google Scholar]
- Barbuy, B., Renzini, A., Ortolani, S., Bica, E., & Guarnieri, M. D. 1999, A&A, 341, 539 [NASA ADS] [Google Scholar]
- Barbuy, B., Friaça, A. C. S., da Silveira, C. R., et al. 2015, A&A, 580, A40 [NASA ADS] [CrossRef] [EDP Sciences] [Google Scholar]
- Barrera, N., Villanova, S., Geisler, D., Fernández-Trincado, J. G., & Muñoz, C. 2025, A&A, 699, A128 [NASA ADS] [CrossRef] [EDP Sciences] [Google Scholar]
- Bastian, N., & Lardo, C. 2018, ARA&A, 56, 83 [Google Scholar]
- Battistini, C., & Bensby, T. 2015, A&A, 577, A9 [NASA ADS] [CrossRef] [EDP Sciences] [Google Scholar]
- Baumgardt, H., & Hilker, M. 2018, MNRAS, 478, 1520 [Google Scholar]
- Bisterzo, S., Pompeia, L., Gallino, R., et al. 2005, Nucl. Phys. A, 758, 284 [NASA ADS] [CrossRef] [Google Scholar]
- Bisterzo, S., Travaglio, C., Gallino, R., Wiescher, M., & Käppeler, F. 2014, ApJ, 787, 10 [NASA ADS] [CrossRef] [Google Scholar]
- Bressan, A., Marigo, P., Girardi, L., et al. 2012, MNRAS, 427, 127 [NASA ADS] [CrossRef] [Google Scholar]
- Callingham, T. M., Cautun, M., Deason, A. J., et al. 2022, MNRAS, 513, 4107 [NASA ADS] [CrossRef] [Google Scholar]
- Carretta, E., Bragaglia, A., Gratton, R., & Lucatello, S. 2009a, A&A, 505, 139 [NASA ADS] [CrossRef] [EDP Sciences] [Google Scholar]
- Carretta, E., Bragaglia, A., Gratton, R. G., et al. 2009b, A&A, 505, 117 [NASA ADS] [CrossRef] [EDP Sciences] [Google Scholar]
- Ceccarelli, E., Mucciarelli, A., Massari, D., Bellazzini, M., & Matsuno, T. 2024, A&A, 691, A226 [NASA ADS] [CrossRef] [EDP Sciences] [Google Scholar]
- Cohen, J. G., Gratton, R. G., Behr, B. B., & Carretta, E. 1999, ApJ, 523, 739 [Google Scholar]
- Cohen, R. E., Bellini, A., Casagrande, L., et al. 2021, AJ, 162, 228 [NASA ADS] [CrossRef] [Google Scholar]
- Crociati, C., Valenti, E., Ferraro, F. R., et al. 2023, ApJ, 951, 17 [NASA ADS] [CrossRef] [Google Scholar]
- Crociati, C., Cignoni, M., Dalessandro, E., et al. 2024, A&A, 691, A311 [NASA ADS] [CrossRef] [EDP Sciences] [Google Scholar]
- Cunha, K., Smith, V. V., Hasselquist, S., et al. 2017, ApJ, 844, 145 [Google Scholar]
- Dalessandro, E., Crociati, C., Cignoni, M., et al. 2022, ApJ, 940, 170 [NASA ADS] [CrossRef] [Google Scholar]
- De Leo, M., Massari, D., Bellazzini, M., et al. 2026, A&A, 707, A310 [NASA ADS] [CrossRef] [EDP Sciences] [Google Scholar]
- Deras, D., Cadelano, M., Ferraro, F. R., Lanzoni, B., & Pallanca, C. 2023, ApJ, 942, 104 [CrossRef] [Google Scholar]
- Dias, B., Barbuy, B., Saviane, I., et al. 2015, A&A, 573, A13 [NASA ADS] [CrossRef] [EDP Sciences] [Google Scholar]
- Dorn, R. J., Anglada-Escude, G., Baade, D., et al. 2014, The Messenger, 156, 7 [NASA ADS] [Google Scholar]
- Dorn, R. J., Bristow, P., Smoker, J. V., et al. 2023, A&A, 671, A24 [NASA ADS] [CrossRef] [EDP Sciences] [Google Scholar]
- Fanelli, C., Origlia, L., Oliva, E., et al. 2021, A&A, 645, A19 [NASA ADS] [CrossRef] [EDP Sciences] [Google Scholar]
- Fanelli, C., Origlia, L., Rich, R. M., et al. 2024, A&A, 690, A139 [NASA ADS] [CrossRef] [EDP Sciences] [Google Scholar]
- Fernández-Trincado, J. G., Villanova, S., Geisler, D., et al. 2022, A&A, 658, A116 [NASA ADS] [CrossRef] [EDP Sciences] [Google Scholar]
- Ferraro, F. R., Dalessandro, E., Mucciarelli, A., et al. 2009, Nature, 462, 483 [Google Scholar]
- Ferraro, F. R., Massari, D., Dalessandro, E., et al. 2016, ApJ, 828, 75 [NASA ADS] [CrossRef] [Google Scholar]
- Ferraro, F. R., Pallanca, C., Lanzoni, B., et al. 2021, Nat. Astron., 5, 311 [Google Scholar]
- Ferraro, F. R., Chiappino, L., Bartolomei, A., et al. 2025, A&A, 696, A179 [NASA ADS] [CrossRef] [EDP Sciences] [Google Scholar]
- Ferraro, F. R., Vesperini, E., Lanzoni, B., et al. 2026, A&A, 707, A163 [Google Scholar]
- Frelijj, H., González-Díaz, D., Geisler, D., et al. 2025, A&A, 701, A159 [NASA ADS] [CrossRef] [EDP Sciences] [Google Scholar]
- Gaia Collaboration (Prusti, T., et al.) 2016, A&A, 595, A1 [NASA ADS] [CrossRef] [EDP Sciences] [Google Scholar]
- Gaia Collaboration (Vallenari, A., et al.) 2023, A&A, 674, A1 [NASA ADS] [CrossRef] [EDP Sciences] [Google Scholar]
- Geisler, D., Villanova, S., O’Connell, J. E., et al. 2021, A&A, 652, A157 [NASA ADS] [CrossRef] [EDP Sciences] [Google Scholar]
- Geisler, D., Muñoz, C., Villanova, S., et al. 2025, A&A, 703, A267 [NASA ADS] [CrossRef] [EDP Sciences] [Google Scholar]
- González-Díaz, D., Fernández-Trincado, J. G., Villanova, S., et al. 2023, MNRAS, 526, 6274 [CrossRef] [Google Scholar]
- Gratton, R., Bragaglia, A., Carretta, E., et al. 2019, A&A Rev., 27, 8 [Google Scholar]
- Gustafsson, B., Edvardsson, B., Eriksson, K., et al. 2008, A&A, 486, 951 [NASA ADS] [CrossRef] [EDP Sciences] [Google Scholar]
- Harris, W. E. 1996, AJ, 112, 1487 [Google Scholar]
- Harris, W. E. 2010, arXiv e-prints [arXiv:1012.3224] [Google Scholar]
- Henao, L., Villanova, S., Geisler, D., & Fernández-Trincado, J. G. 2025, A&A, 696, A154 [NASA ADS] [CrossRef] [EDP Sciences] [Google Scholar]
- Horta, D., Schiavon, R. P., Mackereth, J. T., et al. 2020, MNRAS, 493, 3363 [NASA ADS] [CrossRef] [Google Scholar]
- Johnson, C. I., Rich, R. M., Kobayashi, C., Kunder, A., & Koch, A. 2014, AJ, 148, 67 [Google Scholar]
- Kaeufl, H.-U., Ballester, P., Biereichel, P., et al. 2004, SPIE Conf. Ser., 5492, 1218 [NASA ADS] [Google Scholar]
- Kobayashi, C., Karakas, A. I., & Lugaro, M. 2020, ApJ, 900, 179 [Google Scholar]
- Loriga, M., Pallanca, C., Ferraro, F. R., et al. 2025, A&A, 695, A156 [NASA ADS] [CrossRef] [EDP Sciences] [Google Scholar]
- Magg, E., Bergemann, M., Serenelli, A., et al. 2022, A&A, 661, A140 [NASA ADS] [CrossRef] [EDP Sciences] [Google Scholar]
- Marigo, P., Girardi, L., Bressan, A., et al. 2017, ApJ, 835, 77 [Google Scholar]
- Massari, D., Mucciarelli, A., Ferraro, F. R., et al. 2014, ApJ, 795, 22 [NASA ADS] [CrossRef] [Google Scholar]
- Massari, D., Koppelman, H. H., & Helmi, A. 2019, A&A, 630, L4 [NASA ADS] [CrossRef] [EDP Sciences] [Google Scholar]
- Massari, D., Zerbinati, C., Fanelli, C., et al. 2026, Nature, submitted [arXiv:2601.18896] [Google Scholar]
- Meléndez, J., Barbuy, B., Bica, E., et al. 2003, A&A, 411, 417 [NASA ADS] [CrossRef] [EDP Sciences] [Google Scholar]
- Minelli, A., Mucciarelli, A., Massari, D., et al. 2021a, ApJ, 918, L32 [NASA ADS] [CrossRef] [Google Scholar]
- Minelli, A., Mucciarelli, A., Romano, D., et al. 2021b, ApJ, 910, 114 [CrossRef] [Google Scholar]
- Montecinos, C., Villanova, S., Muñoz, C., & Cortés, C. C. 2021, MNRAS, 503, 4336 [NASA ADS] [CrossRef] [Google Scholar]
- Monty, S., Belokurov, V., Sanders, J. L., et al. 2024, MNRAS, 533, 2420 [NASA ADS] [CrossRef] [Google Scholar]
- Muñoz, C., Villanova, S., Geisler, D., et al. 2020, MNRAS, 492, 3742 [CrossRef] [Google Scholar]
- Mucciarelli, A., Massari, D., Minelli, A., et al. 2021, Nat. Astron., 5, 1247 [NASA ADS] [CrossRef] [Google Scholar]
- Origlia, L., Rich, R. M., & Castro, S. 2002, AJ, 123, 1559 [Google Scholar]
- Origlia, L., Rich, R. M., Ferraro, F. R., et al. 2011, ApJ, 726, L20 [CrossRef] [Google Scholar]
- Origlia, L., Massari, D., Rich, R. M., et al. 2013, ApJ, 779, L5 [NASA ADS] [CrossRef] [Google Scholar]
- Origlia, L., Mucciarelli, A., Fiorentino, G., et al. 2019, ApJ, 871, 114 [NASA ADS] [CrossRef] [Google Scholar]
- Origlia, L., Ferraro, F. R., Fanelli, C., et al. 2025, A&A, 697, A19 [NASA ADS] [CrossRef] [EDP Sciences] [Google Scholar]
- Ortolani, S., Bica, E., & Barbuy, B. 1997, A&AS, 126, 253 [Google Scholar]
- Ortolani, S., Bica, E., & Barbuy, B. 1999, A&AS, 138, 267 [Google Scholar]
- Ortolani, S., Barbuy, B., Bica, E., et al. 2001, A&A, 376, 878 [NASA ADS] [CrossRef] [EDP Sciences] [Google Scholar]
- Ortolani, S., Barbuy, B., Bica, E., Zoccali, M., & Renzini, A. 2007, A&A, 470, 1043 [NASA ADS] [CrossRef] [EDP Sciences] [Google Scholar]
- Ortolani, S., Souza, S. O., Nardiello, D., Barbuy, B., & Bica, E. 2025, A&A, 698, A181 [NASA ADS] [CrossRef] [EDP Sciences] [Google Scholar]
- Palla, M. 2021, MNRAS, 503, 3216 [Google Scholar]
- Pallanca, C., Ferraro, F. R., Lanzoni, B., et al. 2019, ApJ, 882, 159 [NASA ADS] [CrossRef] [Google Scholar]
- Pallanca, C., Ferraro, F. R., Lanzoni, B., et al. 2021a, ApJ, 917, 92 [NASA ADS] [CrossRef] [Google Scholar]
- Pallanca, C., Lanzoni, B., Ferraro, F. R., et al. 2021b, ApJ, 913, 137 [NASA ADS] [CrossRef] [Google Scholar]
- Pallanca, C., Leanza, S., Ferraro, F. R., et al. 2023, ApJ, 950, 138 [NASA ADS] [CrossRef] [Google Scholar]
- Plez, B. 2012, Turbospectrum: Code for spectral synthesis, Astrophysics Source Code Library [record ascl:1205.004] [Google Scholar]
- Prantzos, N., Abia, C., Cristallo, S., Limongi, M., & Chieffi, A. 2020, MNRAS, 491, 1832 [Google Scholar]
- Rich, R. M., Origlia, L., & Valenti, E. 2012, ApJ, 746, 59 [NASA ADS] [CrossRef] [Google Scholar]
- Romano, D., & Matteucci, F. 2007, MNRAS, 378, L59 [NASA ADS] [Google Scholar]
- Romano, D., Karakas, A. I., Tosi, M., & Matteucci, F. 2010, A&A, 522, A32 [NASA ADS] [CrossRef] [EDP Sciences] [Google Scholar]
- Romano, D., Ferraro, F. R., Origlia, L., et al. 2023, ApJ, 951, 85 [NASA ADS] [CrossRef] [Google Scholar]
- Romero-Colmenares, M., Fernández-Trincado, J. G., Geisler, D., et al. 2021, A&A, 652, A158 [NASA ADS] [CrossRef] [EDP Sciences] [Google Scholar]
- Ryabchikova, T., & Pakhomov, Y. 2015, Baltic Astron., 24, 453 [NASA ADS] [Google Scholar]
- Saracino, S., Dalessandro, E., Ferraro, F. R., et al. 2016, ApJ, 832, 48 [Google Scholar]
- Saracino, S., Dalessandro, E., Ferraro, F. R., et al. 2015, ApJ, 806, 152 [NASA ADS] [CrossRef] [Google Scholar]
- Saracino, S., Dalessandro, E., Ferraro, F. R., et al. 2019, ApJ, 874, 86 [Google Scholar]
- Schiavon, R. P., Johnson, J. A., Frinchaboy, P. M., et al. 2017, MNRAS, 466, 1010 [NASA ADS] [CrossRef] [Google Scholar]
- Searle, L., & Zinn, R. 1978, ApJ, 225, 357 [Google Scholar]
- Souza, S. O., Ernandes, H., Valentini, M., et al. 2023, A&A, 671, A45 [NASA ADS] [CrossRef] [EDP Sciences] [Google Scholar]
- Souza, S. O., Libralato, M., Nardiello, D., et al. 2024, A&A, 690, A37 [NASA ADS] [CrossRef] [EDP Sciences] [Google Scholar]
- Tang, B., Cohen, R. E., Geisler, D., et al. 2017, MNRAS, 465, 19 [NASA ADS] [CrossRef] [Google Scholar]
- Tonry, J., & Davis, M. 1979, AJ, 84, 1511 [Google Scholar]
- Uribe, M., Villanova, S., Geisler, D., et al. 2025, A&A, 703, A278 [NASA ADS] [CrossRef] [EDP Sciences] [Google Scholar]
- Valcin, D., Bernal, J. L., Jimenez, R., Verde, L., & Wandelt, B. D. 2020, J. Cosmology Astropart. Phys., 2020, 002 [Google Scholar]
- Valenti, E., Ferraro, F. R., & Origlia, L. 2004, MNRAS, 354, 815 [NASA ADS] [CrossRef] [Google Scholar]
- Valenti, E., Ferraro, F. R., & Origlia, L. 2007, AJ, 133, 1287 [Google Scholar]
- Valenti, E., Ferraro, F. R., & Origlia, L. 2010, MNRAS, 402, 1729 [NASA ADS] [CrossRef] [Google Scholar]
- Van der Swaelmen, M., Barbuy, B., Hill, V., et al. 2016, A&A, 586, A1 [NASA ADS] [CrossRef] [EDP Sciences] [Google Scholar]
- VandenBerg, D. A., Brogaard, K., Leaman, R., & Casagrande, L. 2013, ApJ, 775, 134 [Google Scholar]
- Vasiliev, E., & Baumgardt, H. 2021, MNRAS, 505, 5978 [NASA ADS] [CrossRef] [Google Scholar]
- Woosley, S. E., & Weaver, T. A. 1995, ApJS, 101, 181 [Google Scholar]
Appendix A Chemical abundances
Chemical abundances and corresponding errors of the observed stars in NGC 6553.
All Tables
Coordinates, J-band and K-band magnitudes, atmospheric parameters, and heliocentric radial velocities of the observed stars in NGC 6553.
Chemical abundances and corresponding errors of the observed stars in NGC 6553.
All Figures
|
Fig. 1 Spectroscopic targets (red squares) observed in NGC 6553. Left panel: (K, J-K) CMD of the cluster (gray dots) with highlighted the target stars for which we measured chemical abundances (from Valenti et al. 2007). Right panel: position of the targets in the plane of the sky with respect to the cluster center (cross). The dashed black circles have radii equal to one, two, and three times the core radius, which is rc = 0.53′ (Harris 1996). |
| In the text | |
|
Fig. 2 Vector point diagram obtained from Gaia DR3 PMs, for the stars located within 200” from the center of NGC 6553 (gray dots). The 13 spectroscopic targets with measured PM are reported as red filled squares. The dashed circle has a radius equal to 3 × σPM, with σPM = 0.3 mas yr−1 being the PM dispersion of NGC 6553 member stars. All the spectroscopic targets with measured PM are located within it and have thus been included in this study. |
| In the text | |
|
Fig. 3 Behavior of iron-peak, neutron-capture, CNO, α- and light-element abundances as a function of [Fe/H] for the observed stars of NGC 6553 (red filled squares). The dashed vertical and horizontal lines indicate the corresponding solar [Fe/H] and [X/Fe] values. The small gray circles mark the abundances of bulge field stars as measured by Rich et al. (2012) for C, O, Mg, Al, Si, Ca, and Ti, Johnson et al. (2014) for O, Na, Mg, Al, Si, Ca, Cr, Ni, and Cu, Barbuy et al. (2015) for Zn, and Van der Swaelmen et al. (2016) for Ce. The only exception is V, whereby gray circles correspond to disk field stars (from Battistini & Bensby 2015). |
| In the text | |
|
Fig. 4 Top panel: average abundance of each chemical element for the star sample (red filled circles) with their corresponding error. The gray dots refer to the measurements obtained for each individual star. Bottom panel: intrinsic σ-value for each chemical element with the corresponding error (blue filled circles). |
| In the text | |
|
Fig. 5 Trends between pairs of light-element abundance ratios for the observed stars of NGC 6553, tracing the presence of multiple stellar populations. |
| In the text | |
|
Fig. 6 Behavior of [α/Fe], [V/Fe] and [Zn/Fe] as a function of [Fe/H] for NGC 6553 (red filled squares). The α-element abundance is the average of Mg, Si, and Ca abundances for each star. For comparison, the abundance ratios measured in Milky Way stars (gray circles; Rich et al. 2012; Johnson et al. 2014; Battistini & Bensby 2015; Barbuy et al. 2015) and in the Magellanic Clouds and Sagittarius dwarf galaxy (blue circles; Minelli et al. 2021b) are also shown. Abundances of NGC 6553 are consistent with those observed in the Milky Way. |
| In the text | |
Current usage metrics show cumulative count of Article Views (full-text article views including HTML views, PDF and ePub downloads, according to the available data) and Abstracts Views on Vision4Press platform.
Data correspond to usage on the plateform after 2015. The current usage metrics is available 48-96 hours after online publication and is updated daily on week days.
Initial download of the metrics may take a while.