


Fig. 1
Download original image
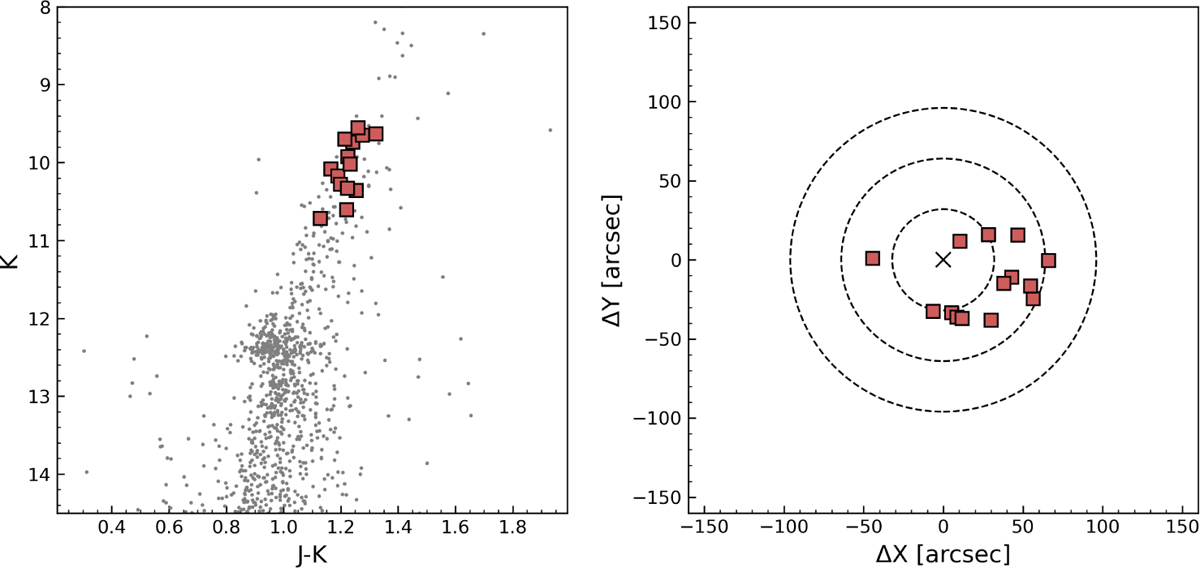
Spectroscopic targets (red squares) observed in NGC 6553. Left panel: (K, J-K) CMD of the cluster (gray dots) with highlighted the target stars for which we measured chemical abundances (from Valenti et al. 2007). Right panel: position of the targets in the plane of the sky with respect to the cluster center (cross). The dashed black circles have radii equal to one, two, and three times the core radius, which is rc = 0.53′ (Harris 1996).
Current usage metrics show cumulative count of Article Views (full-text article views including HTML views, PDF and ePub downloads, according to the available data) and Abstracts Views on Vision4Press platform.
Data correspond to usage on the plateform after 2015. The current usage metrics is available 48-96 hours after online publication and is updated daily on week days.
Initial download of the metrics may take a while.