


| Issue |
A&A
Volume 710, June 2026
|
|
|---|---|---|
| Article Number | A20 | |
| Number of page(s) | 9 | |
| Section | Extragalactic astronomy | |
| DOI | https://doi.org/10.1051/0004-6361/202558162 | |
| Published online | 28 May 2026 | |
High-resolution radio imaging of TGSS J1530+1049, a radio galaxy in a dense environment at z = 4
1
Department of Astronomy, Institute of Physics and Astronomy, ELTE Eötvös Loránd University, Pázmány Péter sétány 1/A, 1117 Budapest, Hungary
2
Konkoly Observatory, HUN-REN Research Centre for Astronomy and Earth Sciences, MTA Centre of Excellence, Konkoly-Thege Miklós út 15-17, 1121 Budapest, Hungary
3
HUN-REN–ELTE Extragalactic Astrophysics Research Group, ELTE Eötvös Loránd University, Pázmány Péter sétány 1/A, 1117 Budapest, Hungary
4
Institute of Astronomy, Faculty of Physics, Astronomy and Informatics, Nicolaus Copernicus University, Grudzidzka 5, 87-100 Toruń, Poland
5
Institute of Physics and Astronomy, ELTE Eötvös Loránd University, Pázmány Péter sétány 1/A, 1117, Budapest, Hungary
6
Joint Institute for VLBI ERIC, Oude Hoogeveensedijk 4, 7991 PD Dwingeloo, The Netherlands
7
Faculty of Aerospace Engineering, Delft University of Technology, Kluyverweg 1, 2629 HS, Delft, The Netherlands
8
Department of Physics, University of Oxford, Denys Wilkinson Building, Keble Road, Oxford OX1 3RH, UK
9
Department of Physics and Astronomy, University College London, Gower Street, London WC1E 6BT, UK
10
Leiden Observatory, University of Leiden, Niels Bohrweg 2, 2333 CA Leiden, The Netherlands
11
Observatório Nacional/MCTI, Rua General José Cristino, 77, Sao Cristóvao, Rio de Janeiro, RJ 20921 400, Brazil
12
TNO, Oude Waalsdorperweg 63, 2597 AK Den Haag, The Netherlands
13
Centro de Astrobiología (CAB), CSIC-INTA, Ctra. de Ajalvir, km 4, E-28850 Torrejón de Ardoz, Madrid, Spain
14
Instituto de Astrofísica de La Plata, CONICET – UNLP, Paseo del Bosque, B1900FWA, La Plata, Argentina
15
Facultad de Ciencas Astronómicas y Geofísicas, Universidad Nacional de La Plata, B19000FWA, La Plata, Argentina
16
DTx – Digital Transformation CoLab, Building 1, Azurém Campus, University of Minho, 4800-058 Guimarães, Portugal
17
Instituto de Astrofísica e Ciências do Espaço, Universidade do Porto, CAUP, Rua das Estrelas, PT4150-762 Porto, Portugal
★ Corresponding author: This email address is being protected from spambots. You need JavaScript enabled to view it.
Received:
18
November
2025
Accepted:
15
April
2026
Abstract
Context. High-redshift radio galaxies can provide important insights into structure formation and galaxy evolution during earlier cosmological epochs. TGSS J1530+1049 was selected as a candidate high-redshift radio galaxy based on its very steep radio spectrum. Subsequent observations with the James Webb Space Telescope (JWST) presented in a companion paper have shown that it is located at a redshift of z = 4.0. The JWST data furthermore showed that the radio source is part of one of the densest structures of galaxies and ionized gas known at these redshifts. The complex system qualitatively resembles a massive (cluster) galaxy that formed early through a rapid succession of mergers.
Aims. TGSS J1530+1049 is an unresolved source down to an ∼0.6″ scale in multiple radio surveys. To reveal its high-resolution radio structure and allow for a detailed comparison with JWST observations, we studied its morphology at various angular scales with different radio interferometric instruments.
Methods. We observed TGSS J1530+1049 at a milliarcsecond- (mas) scale angular resolution with the European VLBI Network (EVN), and at an ∼100-mas scale resolution with the enhanced Multi-Element Remotely Linked Interferometer Network (e-MERLIN).
Results. We recovered a complex north–south oriented structure with steep-spectrum radio-emitting features, which are associated with the lobes and hot spots of a jetted active galactic nucleus. However, the centre of the radio galaxy proved to be too faint at centimetre wavelengths to be unambiguously detected in our observations. Nevertheless, its linear size (∼5.5 kpc) and radio power (L1.4 GHz ≈ 3 × 1027 W Hz−1) place it among the so-called medium-sized symmetric objects, which are a smaller and/or confined version of larger radio galaxies. A comparison between its radio morphology and that of the ionized gas as observed with the NIRSpec integral field unit on JWST shows that the two are closely aligned. However, the optical emission line gas extends out to ∼25 kpc, which is well beyond the detected radio structures.
Key words: techniques: interferometric / galaxies: active / galaxies: high-redshift / galaxies: individual: TGSS J1530+1049 / galaxies: jets / radio continuum: galaxies
© The Authors 2026
 Open Access article, published by EDP Sciences, under the terms of the Creative Commons Attribution License (https://creativecommons.org/licenses/by/4.0), which permits unrestricted use, distribution, and reproduction in any medium, provided the original work is properly cited.
This article is published in open access under the Subscribe to Open model. This email address is being protected from spambots. You need JavaScript enabled to view it. to support open access publication.
1. Introduction
High-redshift (z ≳ 4) active galactic nuclei (AGNs) are essential for studying the growth of supermassive black holes (SMBHs) and galaxy evolution in the early Universe. The radio-emitting subsample of these sources is of great importance since they can be studied with the highest angular resolution provided by radio interferometric techniques. Among these sources, high-redshift radio galaxies are important constituents to study the evolution of large-scale structures in the Universe since they are often found at the centre of clusters and proto-clusters, and can be the progenitors of massive galaxies. At early cosmological epochs, radio galaxies are expected to be young, compact systems.
Historically, it was proposed that compact radio sources with ultra-steep radio spectra could be good candidates for high-redshift radio galaxies (e.g. Blumenthal & Miley 1979; Roettgering et al. 1994; Chambers et al. 1996). Various authors use different definitions for ultra-steep-spectrum (USS) sources (see e.g. Braude et al. (1995) and Coppejans et al. (2017)), but more recently Saxena et al. (2018a) collected a sample of USS sources with radio spectral indices α < −1.3 (α is defined as S ∝ να, where S is the flux density and ν the observing frequency) measured between 150 MHz and 1.4 GHz. To enable further efficient selection of potential high-redshift sources, Saxena et al. (2018a) focused on those that remained undetected in optical and infrared surveys.
TGSS J1530+1049 (hereafter J1530+1049) was one of the brightest objects in their sample. In a follow-up radio observation of the sample, conducted with the Karl G. Jansky Very Large Array (VLA) at 1.4 GHz in its most extended A configuration, J1530+1049 was detected as a source well-described by a single Gaussian brightness distribution with a deconvolved size of ∼0.6″ and a flux density of (7.5 ± 0.1) mJy. Optical spectroscopic observations at the radio position revealed a single emission line that was erroneously identified as a Lyman-α line at z = 5.72 (Saxena et al. 2018b). However, recent James Webb Space Telescope (JWST) imaging and spectroscopic observations of the object presented in a companion paper (Saxena et al. 2026) have revealed that the radio emission positionally coincides with a highly complex system that consists of several massive galaxies, diffuse emission, and ionized gas knots at z = 4.0. The picture that has emerged is that of a dense core of interacting galaxies including the host galaxy of the radio source, which perhaps signals the formation of a very massive (central cluster) galaxy.
We observed J1530+1049 using the technique of very long baseline interferometry (VLBI) with the European VLBI Network (EVN) and the enhanced Multi-Element Remotely Linked Interferometer Network (e-MERLIN) to resolve its radio emission. A preliminary analysis of the EVN observation was presented in Gabányi et al. (2018), which used the redshift estimate available at that time. In Sect. 2, we describe the observations and data reduction. The results are presented in Sect. 3, while our findings are discussed in Sect. 4. The paper is concluded by a summary in Sect. 5.
In the following, we assume a Λ cold dark matter cosmological model with a Hubble constant of H0 = 67.7 km s−1 Mpc−1, matter density parameter of Ωm = 0.31, and dark energy density parameter of ΩΛ = 0.69. At z = 4.0, the angular size of 1 milliarcsecond (mas) corresponds to 7.1 pc linear size, and the luminosity distance of the source is DL = 36676.4 Mpc (Wright 2006).
2. Observations and data reduction
2.1. EVN observation
The EVN observation of J1530+1049 was conducted on 2018 September 19 at 1.7 GHz frequency (project code: RSG11) in e-VLBI mode (Szomoru 2008). The observing bandwidth was divided into eight intermediate frequency channels (IF) with 16 MHz bandwidth each. The following antennas provided data: a single antenna of the Westerbork Synthesis Radio Telescope (the Netherlands), Effelsberg (Germany), Medicina (Italy), Onsala (Sweden), Tianma (China), Toruń (Poland), Hartebeesthoek (South Africa), and Sardinia (Italy). Sardinia only observed in four IFs. The (u, v) coverage of the observation is shown in the rightmost panel of Fig. 1.
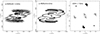 |
Fig. 1. Visibility sampling, (u, v)-coverage, of the three radio interferometric observations of J1530+1049. From left to right, these are the 1.5-GHz e-MERLIN, the 5-GHz e-MERLIN, and the 1.7-GHz EVN observations. We note that the units of the axes are 103λ for the e-MERLIN observations and 106λ for the EVN observation, where λ indicates the observing wavelength. |
The observation was conducted in phase-referencing mode (Beasley & Conway 1995). The phase-reference calibrator, ICRF J152502.9+110744 (hereafter J1525+1107), and the target source were observed alternately, in cycles with 1.5 min time spent on the calibrator and 4.5 min on the target source. The total on-target integration time was 57.6 min.
The data were reduced with the National Radio Astronomy Observatory (NRAO) Astronomical Image Processing System (AIPS, Greisen 1990) following the standard procedure (e.g. Diamond 1995). A priori amplitude calibration was performed using system temperature measurements at the antenna sites. Ionospheric corrections were conducted based on the total electron content maps from global navigation satellite systems data, and parallactic angle correction was also done. Then fringe fitting was performed on the data of the phase-reference calibrator.
The resulting calibrator source data were imaged in the Difmap software (Shepherd 1997) via the hybrid mapping method, which involves subsequent usage of the CLEAN algorithm (Högbom 1974) and phase self-calibration iterations. As a final step of imaging, we performed amplitude self-calibration and obtained overall gain correction factors for the antennas. These gain corrections were then applied to the data within AIPS. Additionally, the resulting image of the phase-reference calibrator was read back into AIPS to be used for improving the fringe fit. The fringe-fit solutions of the phase-reference calibrator were applied to the target source, which was then imaged in Difmap. Due to the weakness of the main target object, no self-calibration was attempted.
2.2. e-MERLIN observations
The e-MERLIN observations (project code: CY8205) took place on 2019 January 29 and February 22 at 5 GHz, and on 2019 March 7 and 8 at 1.5 GHz. At 1.5 GHz, eight IFs were used, each with a bandwidth of 64 MHz and divided into 128 spectral channels. However, no signal was recorded in IF7. At 5 GHz, four IFs were used, each with a bandwidth of 128 MHz and divided into 128 channels. At both frequencies, the Jodrell Bank Mk2, Pickmere, Darnhall, Knockin, Defford, and Cambridge antennas participated in the observations. The Lovell Telescope at Jodrell Bank also joined at 5 GHz on the second observing day. The (u, v) coverages of the observations are shown in the left and middle panels of Fig. 1.
Beside the target source, the following calibrators were observed: 3C 84 as a pointing calibrator, 3C 286 as a flux density calibrator, and OQ 208 as a bandpass calibrator. The phase calibrator was the same radio quasar used in the EVN observation, (J1525+1107). The on-target integration time was ∼9 h and ∼13.2 h at 1.5 and 5 GHz, respectively.
The raw visibility data were pre-processed and calibrated with the e-MERLIN pipeline1 using the Common Astronomy Software Applications (CASA, McMullin et al. 2007; CASA Team 2022)2. Imaging was also performed in CASA. We exported the channel-averaged dataset and additionally imaged it in Difmap. The resulting maps agree with each other. Due to the weakness of the source, no self-calibration was performed.
2.3. JWST observations
J1530+1049 was observed with the JWST/NIRSpec in integral field unit (IFU) mode on 2023 July 14–15 (PIs: R.A. Overzier and A. Saxena, programme GO 1964). The results of that programme involving additional observations with the Hubble Space Telescope and JWST/NIRCam are discussed in detail in Saxena et al. (2026). In this paper, we present a comparison between the high-resolution radio data and a map of the Hα emission as measured with the NIRSpec IFU (see Sect. 4.3). For details on the observations and construction of the Hα map, we refer the reader to the companion paper by Saxena et al. (2026).
3. Results
3.1. EVN observation
Two mas-scale compact features (labelled A and B) were detected with the EVN at 1.7 GHz, with a projected separation of ∼400 mas (Fig. 2) that corresponds to ∼2.8 kpc at the redshift of the source. The coordinates of the brighter, northern feature (A) are right ascension  and declination
  . When calculating the positional error, we took into account the uncertainty in the coordinates of the phase-reference calibrator source (0.11 mas in right ascension and 0.18 mas in declination direction3), and the error arising from the phase-referencing technique that depends on the target and calibrator source separation, in our case
  . Rioja et al. (2017) estimate this error to be ∼2 mas. Pradel et al. (2006) obtained a close value of 1.5 mas via simulated VLBI observations. We used the larger, more conservative value. It should also be noted that the coordinates of the phase-reference calibrator source were measured at 8.4 GHz, while the EVN observation was conducted at 1.7 GHz. Frequency-dependent core shift (Sokolovsky et al. 2011) could cause a difference between the International Celestial Reference Frame (ICRF, Charlot et al. 2020) position determined at 8.4 GHz and the 1.7-GHz position of the calibrator.
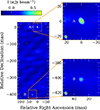 |
Fig. 2. EVN 1.7-GHz maps of J1530+1049. On the right-hand side, the two detected features are shown zoomed-in. The peak intensity of the whole image is 0.70 mJy beam−1. The contour levels are at ( ± 0.23, 0.33, 0.47, 0.66) mJy beam−1. The lowest positive contour level corresponds to 5σ image noise. The restoring beam is shown in the lower left corner of the panels. Its FWHM size is 4.48 mas × 3.61 mas at a position angle of 27°. |
To describe the emission quantitatively, we fitted the visibilities with circular Gaussian brightness distribution model components. Since self-calibration cannot be performed, the obtained flux densities are expected to be lower than the real value due to coherence loss (Martí-Vidal et al. 2010). Previous works (e.g. Mosoni et al. 2006; Gabányi et al. 2019) estimated the coherence loss to be ∼25%. The parameters of the two fitted components are given in Table 1, where the flux densities have been increased to account for the coherence loss. The errors were calculated according to the formulae given by Fomalont (1999). For the flux density errors, another 10% was added in quadrature to account for the absolute amplitude calibration inaccuracies. The full width at half-maximum (FWHM) sizes of the fitted Gaussian features, ∼10 mas and ∼4 mas, which correspond to ∼71 pc and ∼28 pc linear sizes at the source’s redshift, quantify their compact nature.
Parameters of the Gaussian components fitted to the 1.7-GHz EVN visibility data of J1530+1049.
The brightness temperature of the features can be calculated as (e.g. Veres et al. 2010)
 (1)
(1)
where S is the flux density of the components measured in Jansky, ν is the observing frequency in gigahertz, and θ is the FWHM size in milliarcseconds. The values obtained are TBA = (4.0 ± 0.8)⋅107 K and TBB = (8.2 ± 3.2)⋅107 K for components A and B, respectively. Both values well exceed the upper limit given for star-forming galaxies by Condon (1992) of ∼105 K, which indicates AGN-related radio emission.
3.2. e-MERLIN observations
With e-MERLIN, two features (designated as N and S) could be detected at 1.5 GHz with a separation of ∼780 mas (corresponding to a projected linear size of ∼5.5 kpc), as shown in Fig. 3. At 5 GHz, the brighter northern feature (N) is clearly detected with e-MERLIN. At the approximate distance of feature S, at ∼700 mas from N, and in the same position angle as seen in Fig. 3, we recovered an emission spot at an ∼5σ image noise level at 5 GHz (Fig. 4).
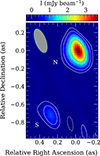 |
Fig. 3. Radio image of J1530+1049 taken at 1.5 GHz with the e-MERLIN. The peak intensity is 3.7 mJy beam−1. The lowest contours are drawn at ±0.24 mJy beam−1 corresponding to a 6σ image noise level. Further positive contour levels increase by a factor of two. The restoring beam is shown in the upper left corner, its FWHM size is 284 mas × 120 mas, and its major axis is oriented at a position angle of 21°. |
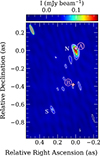 |
Fig. 4. Radio image of J1530+1049 taken at 5 GHz with the e-MERLIN. The peak intensity is 0.17 mJy beam−1. The lowest contours are drawn at ±0.046 mJy beam−1, which corresponds to a 3.5σ image noise level. Further positive contour levels increase by a factor of |

We used Difmap to fit the visibilities with circular Gaussian features to quantify the radio emission. Note that the brightness distribution models were fitted directly to the interferometric visibility data and not in the image plane, so the component sizes obtained can be considered as deconvolved sizes. In the 1.5-GHz band, we averaged the adjacent IFs by two together before fitting the visibilities, to minimize bandwidth smearing effects and to increase the signal-to-noise ratio. Since IF7 did not record data, IF8 had to be fitted as it is. In the first three 128 MHz-wide chunks (i.e. IF pairs), both components, N and S, could be fitted in the 1.5-GHz band. In the last one, where the bandwidth was only 64 MHz, the signal-to-noise ratio was not adequate to reliably fit component S. In the 5-GHz band, components N and S could only be modelled if we used the whole bandwidth for the fit. The parameters of the brighter component N agreed within the errors if the first and second halves of the 5-GHz band were fitted separately.
The results of the model fitting are given in Table 2. The errors were estimated using the formulae of Fomalont (1999), and an additional 20% and 10% were added quadratically to the flux density errors to account for the amplitude calibration uncertainty of e-MERLIN at 1.5 GHz and 5 GHz, respectively (Baldi et al. 2021; Horesh et al. 2020).
Parameters of the Gaussian components fitted to the e-MERLIN visibility data of J1530+1049.
Both components have steep radio spectra (Fig. 5). Their spectral indices are αN = −2.1 ± 0.1 and αS = −1.7 ± 0.5.
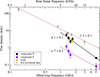 |
Fig. 5. Flux densities of the two Gaussian components that can be fitted to the e-MERLIN visibilities of J1530+1049. Circles and squares are for components N and S, respectively. The solid and dashed lines are power-law fits to the corresponding data points. For comparison, the sum of the flux densities of the EVN-detected components is also shown with an upward yellow triangle. Empty downward brown triangles show lower-resolution flux density measurements from various surveys (see Sect. 4.4 for details), and the brown line indicates the power-law fit to those points. The numbers show the corresponding spectral indices. |
4. Discussion
4.1. Astrometric registration of the radio components
The EVN-detected compact feature, A, falls within the region of the e-MERLIN-detected brightest feature, N, at 5 GHz. However, there is a significant, ∼110 mas offset in the north–south direction between the peak positions measured in the 5-GHz and 1.5-GHz e-MERLIN observations. The question arises whether this offset is caused by some physical effect in the target source, J1530+1049, or is due to a difference in the astrometric registrations of the 1.5- and 5-GHz e-MERLIN images.
The same phase-reference source (J1525+1107) was used in all observations. However, it has significant radio emission extended to an ∼100-mas scale and the position of its brightness peak can be different at different observing frequencies. To illustrate this, the e-MERLIN images of the calibrator are shown in Fig. 6, with a shift of ∼110 mas between the image cutouts to facilitate their comparison. The north–south oriented double feature seen at 5 GHz cannot be resolved at 1.5 GHz with e-MERLIN. However, if the flux densities of the two components relative to each other change with frequency, i.e. the northern feature has a higher or very similar flux density to the southern one at the lower frequency of 1.5 GHz, then the position of the brightness peak can shift towards the northern feature which, on the other hand, is relatively fainter at 5 GHz. This frequency-dependent change in the location of the brightness peak is further supported by higher-resolution VLBI images of the calibrator taken at 2.3 GHz that show an extended bright feature to the north of the milliarcsecond-scale compact emitting region (the core) at a distance of ∼(120 − 150) mas. These archival images are available at the Astrogeo website4. Thus we can conclude that the positional mismatch between the 1.5-GHz and 5-GHz e-MERLIN images of J1530+1049 is caused by different brightness distributions of the phase-reference calibrator source at the two frequencies used (Fig. 6). Therefore, in our target source, the brighter northern features detected by e-MERLIN at the two frequencies (Figs. 3 and 4) are co-spatial, and the brighter EVN-detected component (A, Fig. 2) is located within this emitting region. Since the distances and position angles of the target morphology are very similar in the two e-MERLIN images, and no other significant radio emission can be detected in the field at either of the frequencies, we conclude that their cross-identification is solid.
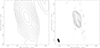 |
Fig. 6. e-MERLIN images of the calibrator source, J1525+1107. Left: At 1.5-GHz. The peak intensity is 420 mJy beam−1. The lowest positive contour is drawn at 1.1 mJy beam−1, which corresponds to a 7σ image noise level. The FWHM size of the restoring beam is 321 mas × 144 mas and its major axis is oriented at a position angle of 21°. Right: 5-GHz. The peak intensity is 274 mJy beam−1. The lowest positive contour is drawn at 0.75 mJy beam−1, which corresponds to a 7σ image noise level. The restoring beam is shown in the lower left corner, its FWHM size is 91 mas × 44 mas, and its major axis is oriented at a position angle of 24°. The two image cutouts have the same size. To illustrate that the 1.5-GHz peak corresponds to the secondary rather than the primary brightness peak at 5 GHz, the images are displaced by 110 mas with respect to each other in the declination direction. |
4.2. The nature of the radio features
The high brightness temperatures of the EVN-detected features indicate the AGN origin of the radio emission. As shown in the previous section, the brighter EVN-detected feature, A, is co-spatial with the e-MERLIN-detected component, N. The flux density measured at 1.7 GHz with e-MERLIN, ∼3.2 mJy, is slightly higher than the EVN value. This in principle can arise from variability or a resolution issue. The largest recoverable size, determined by the shortest baseline of the array (see Fig. 1), is ∼120 mas for the EVN observation, smaller than the fitted size of component N in the e-MERLIN image (∼152 mas). Thus, the lower flux density of component A is most likely caused by EVN resolving out some of the flux density contained in the extended feature and thus recovered by e-MERLIN. This indicates that the northern emitting region (component N) is extended but contains a milliarcsecond-scale compact feature (component A).
While the EVN observation was conducted at a single frequency only, one can use the dual-frequency e-MERLIN measurements to infer a limit on the power-law radio spectral index of component A (Fig. 5). If we assume that all of the 5-GHz flux density of component N is contained within a compact milliarcsecond-scale feature, detectable with EVN at 5 GHz, it would imply a spectral index of αA ≈ −1.9. This value can be regarded as an upper limit on the spectral index of the compact feature, since similarly to the lower frequency, some of the flux density may be resolved out. Such a spectral index is often related to the lobe-like features seen in radio galaxies, while the cores of radio-loud AGN usually have flat or inverted radio spectra at centimetre wavelengths (e.g. Hovatta et al. 2014, and references therein).
The fainter feature in the EVN image, component B (Fig. 2), cannot be seen in the e-MERLIN images, neither at 1.5 GHz (Fig. 3) nor at 5 GHz (Fig. 4). Its non-detection at 5 GHz could naturally be explained by the component having a steep spectrum, α ≲ −2.4, that renders it too faint for the sensitivity of the 5-GHz e-MERLIN observation. Such extremely steep radio spectra are seen in AGN remnants, which are composed of old plasma no longer fed by an active jet. Alternatively, old plasma can be re-energized by turbulence or shocks in merging systems (radio phoenixes), and show a steeply rising radio spectrum towards lower frequencies (e.g. Shulevski et al. 2024, and references therein). However, its compact size, on the scale of a few kiloparsecs, is not compatible with the known radio phoenixes that extend to ∼100 kpc in size (e.g. Bruno et al. 2025). On the other hand, the estimation of the spectral index and its extreme negative value may be the result of surface brightness sensitivity and angular resolution effects.
Based on its brightness in the higher-resolution EVN image, component B should have been visible at a similar significance level to component S in the 1.5-GHz e-MERLIN image. Nevertheless, the rms noise level of the image could have been estimated too optimistically. The 1σ rms noise level of the 1.5-GHz e-MERLIN image at the approximate position of component B is ∼0.13 mJy beam−1, about three times larger than measured across the whole image, while the largest noise peak is ∼0.22 mJy beam−1. Thus, it could be that component B was just below the sensitivity limit of the 1.5-GHz e-MERLIN observation. Additionally, component B could also be variable. A flux density drop of ∼50% within ∼1.2 months time in the rest frame of the source (six months elapsed between the EVN and e-MERLIN observations) could account for the non-detection of component B with the e-MERLIN at 1.5 GHz. If true, such variability is more characteristic for the radio core of the AGN. However, the radio core is not expected to have a steep radio spectrum.
At the position of feature S, there is no sign of any EVN detection, which most probably indicates the resolved nature of this component. Moreover, feature S also has a steep radio spectrum indicated by the e-MERLIN data (Fig. 5). Due to the faintness of this feature at 5 GHz, also indicated by the large relative error of its spectral index, it may have an even steeper radio spectrum than the one formally obtained, αS ∼ −1.7.
Thus, neither of the detected radio features can be clearly identified with the central core of the radio-emitting AGN that is expected to have a flat or inverted synchrotron self-absorbed spectrum. The sizes and spectral indices of N and S are more compatible with extended jet-related emissions containing a milliarcsecond-scale compact hot spot, such as feature A in the EVN observation. Due to the scarcity of radio data, no firm conclusion can be drawn concerning the nature of component B.
4.3. The radio components and the JWST-detected features
The continuum-subtracted Hα line emission, as obtained from the JWST/NIRSpec IFU observations, together with the results of the e-MERLIN radio observations are shown in Fig. 7. Several bright emission-line components lie along the general direction of the radio axis. The radio-emitting regions are close to two large ionized areas (labelled L1 and L3 in Saxena et al. 2026, and in Fig. 7), but they do not coincide with either of them. Based on the JWST observations, it is believed that the radio emission emerges from a bright optical continuum and emission-line source (labelled C2 in Saxena et al. 2026, and in Fig. 7) located between the two radio lobes. The milliarcsecond-scale radio component, B, is within ∼0.1″ of this continuum object. C2 remained unresolved in the NIRCam images, thus its extent can only be approximated as ∼0.1″ − 0.15″, which corresponds to a linear size of ∼(0.7 − 1) kpc.
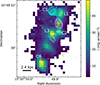 |
Fig. 7. Overlay of the JWST Hα+[N II] emission line map, the NIRCam F300M continuum image from Saxena et al. (2026), and the e-MERLIN maps of J1530+1049. The colour scale shows the continuum-subtracted Hα line map, where low-significance pixels have been masked (for details, see Saxena et al. 2026). The logarithmically scaled cyan contours show the optical continuum data taken with F300M filter. The lowest contour is drawn at 9.8 mJy arcsec−2. The white and orange contours represent the 1.5-GHz and the 5-GHz e-MERLIN data. Radio contour levels are the same as in Figs. 3, 4, except that negative contours are omitted for clarity. Yellow crosses show the positions of the two EVN-detected features (the positional uncertainties are much smaller than their sizes). The C1, C2 and C6 and L1 and L3 labels show the optical continuum and line-emitting regions, respectively as defined in Saxena et al. (2026). In the lower left corner the linear scale is displayed. |
Furthermore, the JWST data show evidence of perturbed gas, especially close to the location of the southern hotspot. Besides these jet–gas interactions, other sources that are likely to contribute to the strong alignment observed are ionization by a central, obscured active nucleus and an infalling low-mass starburst galaxy at the southern edge of the field (object C6 in Saxena et al. 2026).
4.4. Radio emission at larger scales
According to the 1.4-GHz NRAO VLA Sky Survey (Condon et al. 1998), J1530+1049 has a flux density of (7.4 ± 0.5) mJy. At the same frequency but with a higher resolution, the Faint Images of the Radio Sky at Twenty-centimeters (FIRST) survey measured (7.25 ± 0.15) mJy (Helfand et al. 2015). Saxena et al. (2018a) reported a similar flux density value, (7.5 ± 0.1) mJy, measured in a higher-resolution VLA A-configuration observation. More recently, J1530+1049 was detected in the Rapid Australian Square Kilometre Array Pathfinder (ASKAP) Continuum Survey (RACS) with flux densities of (6.4 ± 0.6) mJy and (5.6 ± 0.8) mJy at 1.37 GHz and 1.66 GHz, respectively (Duchesne et al. 2024, 2025). All these values exceed the sum of the flux densities of components N and S detected with e-MERLIN at close frequencies. However, no self-calibration was performed on the e-MERLIN data, therefore coherence loss could result in lower measured flux density values.
J1530+1049 was detected at 3 GHz in the three epochs of the VLA Sky Survey (VLASS, Lacy et al. 2020). We downloaded the three images from the Canadian Astronomy Data Centre (CADC5), and used AIPS to fit them with a single Gaussian. The flux densities agree within the error and their average value is (2.1 ± 0.5) mJy. This exceeds the flux density expected from the spectral indices derived from the e-MERLIN observations (Fig. 5), ∼1 mJy. While a frequency-independent coherence loss of the e-MERLIN data will not alter the obtained spectral index, it can underestimate the predicted 3-GHz flux density.
Below 1 GHz, J1530+1049 is brighter, as indicated by the lowest available frequency measurement of the RACS, 888 MHz (Hale et al. 2021), (17.1 ± 0.71) mJy, and by the TIFR Giant Meterwave Radio Telescope Sky Survey (TGSS, Intema et al. 2017) at 150 MHz, (170 ± 19) mJy (Fig. 5). These low-resolution flux density values imply a spectral index of  , but also indicate a flattening of the radio spectrum between 888 MHz and 150 MHz, corresponding to ∼5 GHz and 750 MHz, respectively, in the rest frame of the source at z = 4.
The 1.4-GHz radio power of J1530+1049 is between ∼(3 − 4)×1027 W Hz−1, depending on whether the highest 1.4-GHz flux density and the broad-band spectral index values are used, or whether the flux density and spectral index are taken from the e-MERLIN observations. The linear size of the source is ∼5.5 kpc. It is an order of magnitude fainter and is a smaller version of the radio galaxy J1420+1205, which is located at a similar redshift (z = 4.026) and also shows several steep-spectrum features at the 100-mas scale (Gabányi et al. 2021).
The linear size and radio power of J1530+1049 are similar to those of the medium-sized symmetric objects (MSOs) studied by Fanti et al. (2001) out to a redshift of ∼4. In Fig. 3 in Orienti et al. (2025)6, J1530+1049 could be placed on the evolutionary track shown for objects with jet power of 1046 erg s−1. MSOs are regarded as young radio sources that eventually evolve into large-scale radio galaxies (e.g. Kunert-Bajraszewska et al. 2010; An & Baan 2012; Orienti et al. 2025). Alternatively, their jets can be frustrated, confined within their host galaxies, and unable to break through the environment and grow into larger structures. According to Orienti et al. (2025), the progenitor objects of the high-power MSOs are less likely to be influenced by jet instabilities, and are expected to eventually evolve into Fanaroff–Riley type II radio galaxies.
Recently, Stanghellini et al. (2025) studied the high-resolution radio morphology and the optical structure of the host galaxies in radio sources containing bright, sub-galactic-sized radio jets. They distinguished two groups: those with aligned radio structures likely to evolve into radio galaxies in the future and those with more complex radio morphologies. They suggested the latter objects reside in merging systems, where the jet interaction with the disturbed interstellar medium, or orbital motion of the jet-emitter AGN in a binary system, give rise to rapidly re-orienting jets. There is no clear indication of large bending structures in the radio morphology of J1530+1049. Nevertheless, the three radio-emitting regions, S, B, and N (with the hotspot A) are not positioned along a straight line. Additionally, the JWST data revealed a quite disturbed environment around the radio structure, showing the dense region of merging galaxies. Thus, the environment of J1530+1049 may influence its radio structure in a similar way to that found by Stanghellini et al. (2025). More sensitive, high-resolution radio observations conducted at lower frequencies that allow for the detection of steep-spectrum jet-related emission could reveal possible jet disturbances.
5. Summary
We imaged the radio emission of a radio galaxy at z = 4, J1530+1049, both at milliarcsecond-scale and 100-mas scale angular resolutions. We detected two faint, milliarcsecond-scale compact features at ∼2.8 kpc projected separation with the EVN at 1.7 GHz. Their high brightness temperature values clearly indicate an AGN-related origin.
The northern one was detected as part of a larger component in our e-MERLIN observation at 1.5 GHz and 5 GHz. At larger scales, we detected another steep-spectrum, extended component at an ∼5.5 kpc separation from the brightest feature in both e-MERLIN observations. According to the flux densities of the radio features, all have steep power-law spectra. Thus neither of them can be identified as the centre of the AGN. All these features are most probably related to the lobes or hot spots in the AGN and possibly also indicate places of interaction with the surrounding medium. Among the detected radio features, the faintest compact component (B), only detected in the 1.7-GHz EVN observation, is located close to the optical continuum source identified with the AGN. It might be related to the AGN core, however, more sensitive observations are needed to ascertain its nature.
The radio power and linear extent of the object place it among those medium-sized symmetric objects that are smaller and presumably younger versions of radio galaxies. A comparison with recent observations with the JWST reveals that the compact radio source is embedded in a very dense region of merging galaxies. Bright knots of emission-line gas are strongly aligned with the radio axis, but are distributed over a total extent about five times larger than the size of the radio source. These data point to a picture of a massive, forming galaxy that hosts at least one active supermassive black hole interacting with the surrounding gas through its (compact) radio jets.
Acknowledgments
We thank the anonymous referee for their comments which helped us improve our paper. The European VLBI Network is a joint facility of independent European, African, Asian, and North American radio astronomy institutes. Scientific results from data presented in this publication are derived from the following EVN project code(s): RSG11. The e-VLBI research infrastructure in Europe was supported by the European Union’s Seventh Framework Programme (FP7/2007-2013) under grant agreement number RI-261525 NEXPReS. The research leading to these results has received funding from the European Commission Horizon 2020 Research and Innovation Programme under grant agreement No. 730562 (RadioNet). e-MERLIN is a National Facility operated by the University of Manchester at Jodrell Bank Observatory on behalf of STFC. Scientific results from data presented in this publication are derived from the e-MERLIN project CY8205. On behalf of the “Interferometric studies of radio-loud active galactic nuclei” project, we are grateful for the possibility to use the HUN-REN Cloud (see Héder et al. 2022, https://science-cloud.hu/) which helped us achieve the results published in this paper. This project was supported by the HUN-REN Hungarian Research Network. KÉG and SF received funding from the Hungarian National Research, Development and Innovation Office (NKFIH excellence grant TKP2021-NKTA-64). MVM research has been funded by grant Nr. PID2021-124665NB-I00 by the Spanish Ministry of Science and Innovation/State Agency of Research MCIN/AEI/10.13039/501100011033 and by “ERDF A way of making Europe”.
References
- An, T., & Baan, W. A. 2012, ApJ, 760, 77 [Google Scholar]
- Baldi, R. D., Williams, D. R. A., McHardy, I. M., et al. 2021, MNRAS, 500, 4749 [Google Scholar]
- Beasley, A. J., & Conway, J. E. 1995, ASP Conf. Ser., 82, 327 [NASA ADS] [Google Scholar]
- Blumenthal, G., & Miley, G. 1979, A&A, 80, 13 [NASA ADS] [Google Scholar]
- Braude, S. Y., Sokolov, K. P., Sharykin, N. K., & Zakharenko, S. M. 1995, Ap&SS, 226, 245 [Google Scholar]
- Bruno, L., Botteon, A., Dallacasa, D., et al. 2025, A&A, 704, A245 [NASA ADS] [CrossRef] [EDP Sciences] [Google Scholar]
- CASA Team, Bean, B., Bhatnagar, S., et al. 2022, PASP, 134, 114501 [NASA ADS] [CrossRef] [Google Scholar]
- Chambers, K. C., Miley, G. K., van Breugel, W. J. M., & Huang, J. S. 1996, ApJS, 106, 215 [Google Scholar]
- Charlot, P., Jacobs, C. S., Gordon, D., et al. 2020, A&A, 644, A159 [EDP Sciences] [Google Scholar]
- Condon, J. J. 1992, ARA&A, 30, 575 [Google Scholar]
- Condon, J. J., Cotton, W. D., Greisen, E. W., et al. 1998, AJ, 115, 1693 [Google Scholar]
- Coppejans, R., van Velzen, S., Intema, H. T., et al. 2017, MNRAS, 467, 2039 [NASA ADS] [Google Scholar]
- Diamond, P. J. 1995, ASP Conf. Ser., 82, 227 [NASA ADS] [Google Scholar]
- Duchesne, S., Ross, K., Thomson, A. J. M., et al. 2025, PASA, 42, 38 [Google Scholar]
- Duchesne, S. W., Grundy, J. A., Heald, G. H., et al. 2024, PASA, 41, e003 [NASA ADS] [CrossRef] [Google Scholar]
- Fanti, C., Pozzi, F., Dallacasa, D., et al. 2001, A&A, 369, 380 [NASA ADS] [CrossRef] [EDP Sciences] [Google Scholar]
- Fomalont, E. B. 1999, ASP Conf. Ser., 180, 301 [NASA ADS] [Google Scholar]
- Gabányi, K. É., Frey, S., An, T., et al. 2021, Astron. Nachr., 342, 1092 [Google Scholar]
- Gabányi, K. É., Frey, S., Gurvits, L. I., Paragi, Z., & Perger, K. 2018, Res. Notes Am. Astron. Soc., 2, 200 [Google Scholar]
- Gabányi, K. É., Frey, S., Satyapal, S., Constantin, A., & Pfeifle, R. W. 2019, A&A, 630, L5 [NASA ADS] [CrossRef] [EDP Sciences] [Google Scholar]
- Greisen, E. W. 1990, in Acquisition Processing and Archiving of Astronomical Images, 125 [Google Scholar]
- Hale, C. L., McConnell, D., Thomson, A. J. M., et al. 2021, PASA, 38, e058 [NASA ADS] [CrossRef] [Google Scholar]
- Héder, M., Rigó, E., Medgyesi, D., et al. 2022, Információs Társadalom, 22, 128 [Google Scholar]
- Helfand, D. J., White, R. L., & Becker, R. H. 2015, ApJ, 801, 26 [NASA ADS] [CrossRef] [Google Scholar]
- Högbom, J. A. 1974, A&AS, 15, 417 [Google Scholar]
- Horesh, A., Sfaradi, I., Ergon, M., et al. 2020, ApJ, 903, 132 [NASA ADS] [CrossRef] [Google Scholar]
- Hovatta, T., Aller, M. F., Aller, H. D., et al. 2014, AJ, 147, 143 [Google Scholar]
- Intema, H. T., Jagannathan, P., Mooley, K. P., & Frail, D. A. 2017, A&A, 598, A78 [NASA ADS] [CrossRef] [EDP Sciences] [Google Scholar]
- Kunert-Bajraszewska, M., Gawroński, M. P., Labiano, A., & Siemiginowska, A. 2010, MNRAS, 408, 2261 [NASA ADS] [CrossRef] [Google Scholar]
- Lacy, M., Baum, S. A., Chandler, C. J., et al. 2020, PASP, 132, 035001 [Google Scholar]
- Martí-Vidal, I., Ros, E., Pérez-Torres, M. A., et al. 2010, A&A, 515, A53 [NASA ADS] [CrossRef] [EDP Sciences] [Google Scholar]
- McMullin, J. P., Waters, B., Schiebel, D., Young, W., & Golap, K. 2007, ASP Conf. Ser., 376, 127 [Google Scholar]
- Mosoni, L., Frey, S., Gurvits, L. I., et al. 2006, A&A, 445, 413 [NASA ADS] [CrossRef] [EDP Sciences] [Google Scholar]
- Orienti, M., D’Ammando, F., Dallacasa, D., et al. 2025, A&A, 698, A157 [NASA ADS] [CrossRef] [EDP Sciences] [Google Scholar]
- Petrov, L. Y., & Kovalev, Y. Y. 2025, ApJS, 276, 38 [NASA ADS] [CrossRef] [Google Scholar]
- Pradel, N., Charlot, P., & Lestrade, J. F. 2006, A&A, 452, 1099 [NASA ADS] [CrossRef] [EDP Sciences] [Google Scholar]
- Rioja, M. J., Dodson, R., Orosz, G., Imai, H., & Frey, S. 2017, AJ, 153, 105 [NASA ADS] [CrossRef] [Google Scholar]
- Roettgering, H. J. A., Lacy, M., Miley, G. K., Chambers, K. C., & Saunders, R. 1994, A&AS, 108, 79 [NASA ADS] [Google Scholar]
- Saxena, A., Jagannathan, P., Röttgering, H. J. A., et al. 2018a, MNRAS, 475, 5041 [Google Scholar]
- Saxena, A., Marinello, M., Overzier, R. A., et al. 2018b, MNRAS, 480, 2733 [Google Scholar]
- Saxena, A., Overzier, R. A., Aydar, C., et al. 2026, Open J. Astrophys., 9, 159461 [Google Scholar]
- Shepherd, M. C. 1997, ASP Conf. Ser., 125, 77 [Google Scholar]
- Shulevski, A., Brienza, M., Massaro, F., et al. 2024, A&A, 682, A171 [NASA ADS] [CrossRef] [EDP Sciences] [Google Scholar]
- Sokolovsky, K. V., Kovalev, Y. Y., Pushkarev, A. B., & Lobanov, A. P. 2011, A&A, 532, A38 [CrossRef] [EDP Sciences] [Google Scholar]
- Stanghellini, C., Orienti, M., Spingola, C., et al. 2025, A&A, 695, A179 [Google Scholar]
- Szomoru, A. 2008, The role of VLBI in the Golden Age for Radio Astronomy, 9, 40 [Google Scholar]
- Veres, P., Frey, S., Paragi, Z., & Gurvits, L. I. 2010, A&A, 521, A6 [NASA ADS] [CrossRef] [EDP Sciences] [Google Scholar]
- Wright, E. L. 2006, PASP, 118, 1711 [NASA ADS] [CrossRef] [Google Scholar]
Version 0.9.
Version 5.4.
According to the latest Radio Fundamental Catalogue (Petrov & Kovalev 2025) rfc2025b maintained by L. Petrov at https://astrogeo.org/sol/rfc/rfc_2025b/.
http://astrogeo.org/cgi-bin/imdb_get_source.csh?source=J1525%2B1107 maintained by L. Petrov.
www.cadc-ccda.hia-iha. nrc-cnrc.gc.ca/en/vlass/, accessed on 2025 September 12.
The unit of the horizontal axis is erroneously given in parsecs. It is actually in kiloparsecs.
All Tables
Parameters of the Gaussian components fitted to the 1.7-GHz EVN visibility data of J1530+1049.
Parameters of the Gaussian components fitted to the e-MERLIN visibility data of J1530+1049.
All Figures
|
Fig. 1. Visibility sampling, (u, v)-coverage, of the three radio interferometric observations of J1530+1049. From left to right, these are the 1.5-GHz e-MERLIN, the 5-GHz e-MERLIN, and the 1.7-GHz EVN observations. We note that the units of the axes are 103λ for the e-MERLIN observations and 106λ for the EVN observation, where λ indicates the observing wavelength. |
| In the text | |
|
Fig. 2. EVN 1.7-GHz maps of J1530+1049. On the right-hand side, the two detected features are shown zoomed-in. The peak intensity of the whole image is 0.70 mJy beam−1. The contour levels are at ( ± 0.23, 0.33, 0.47, 0.66) mJy beam−1. The lowest positive contour level corresponds to 5σ image noise. The restoring beam is shown in the lower left corner of the panels. Its FWHM size is 4.48 mas × 3.61 mas at a position angle of 27°. |
| In the text | |
|
Fig. 3. Radio image of J1530+1049 taken at 1.5 GHz with the e-MERLIN. The peak intensity is 3.7 mJy beam−1. The lowest contours are drawn at ±0.24 mJy beam−1 corresponding to a 6σ image noise level. Further positive contour levels increase by a factor of two. The restoring beam is shown in the upper left corner, its FWHM size is 284 mas × 120 mas, and its major axis is oriented at a position angle of 21°. |
| In the text | |
|
Fig. 4. Radio image of J1530+1049 taken at 5 GHz with the e-MERLIN. The peak intensity is 0.17 mJy beam−1. The lowest contours are drawn at ±0.046 mJy beam−1, which corresponds to a 3.5σ image noise level. Further positive contour levels increase by a factor of |
| In the text | |
|
Fig. 5. Flux densities of the two Gaussian components that can be fitted to the e-MERLIN visibilities of J1530+1049. Circles and squares are for components N and S, respectively. The solid and dashed lines are power-law fits to the corresponding data points. For comparison, the sum of the flux densities of the EVN-detected components is also shown with an upward yellow triangle. Empty downward brown triangles show lower-resolution flux density measurements from various surveys (see Sect. 4.4 for details), and the brown line indicates the power-law fit to those points. The numbers show the corresponding spectral indices. |
| In the text | |
|
Fig. 6. e-MERLIN images of the calibrator source, J1525+1107. Left: At 1.5-GHz. The peak intensity is 420 mJy beam−1. The lowest positive contour is drawn at 1.1 mJy beam−1, which corresponds to a 7σ image noise level. The FWHM size of the restoring beam is 321 mas × 144 mas and its major axis is oriented at a position angle of 21°. Right: 5-GHz. The peak intensity is 274 mJy beam−1. The lowest positive contour is drawn at 0.75 mJy beam−1, which corresponds to a 7σ image noise level. The restoring beam is shown in the lower left corner, its FWHM size is 91 mas × 44 mas, and its major axis is oriented at a position angle of 24°. The two image cutouts have the same size. To illustrate that the 1.5-GHz peak corresponds to the secondary rather than the primary brightness peak at 5 GHz, the images are displaced by 110 mas with respect to each other in the declination direction. |
| In the text | |
|
Fig. 7. Overlay of the JWST Hα+[N II] emission line map, the NIRCam F300M continuum image from Saxena et al. (2026), and the e-MERLIN maps of J1530+1049. The colour scale shows the continuum-subtracted Hα line map, where low-significance pixels have been masked (for details, see Saxena et al. 2026). The logarithmically scaled cyan contours show the optical continuum data taken with F300M filter. The lowest contour is drawn at 9.8 mJy arcsec−2. The white and orange contours represent the 1.5-GHz and the 5-GHz e-MERLIN data. Radio contour levels are the same as in Figs. 3, 4, except that negative contours are omitted for clarity. Yellow crosses show the positions of the two EVN-detected features (the positional uncertainties are much smaller than their sizes). The C1, C2 and C6 and L1 and L3 labels show the optical continuum and line-emitting regions, respectively as defined in Saxena et al. (2026). In the lower left corner the linear scale is displayed. |
| In the text | |
Current usage metrics show cumulative count of Article Views (full-text article views including HTML views, PDF and ePub downloads, according to the available data) and Abstracts Views on Vision4Press platform.
Data correspond to usage on the plateform after 2015. The current usage metrics is available 48-96 hours after online publication and is updated daily on week days.
Initial download of the metrics may take a while.