


Fig. 7.
Download original image
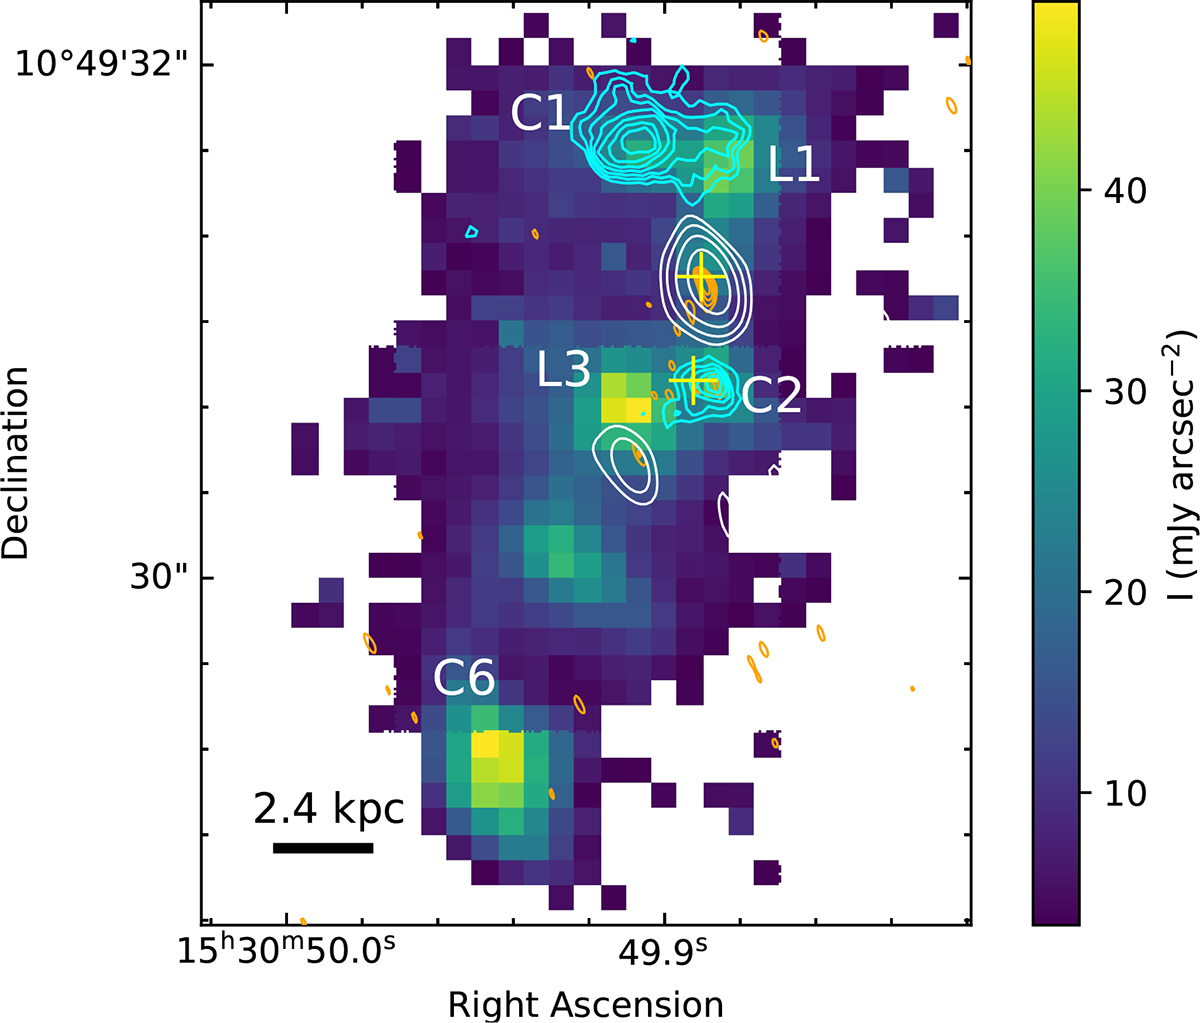
Overlay of the JWST Hα+[N II] emission line map, the NIRCam F300M continuum image from Saxena et al. (2026), and the e-MERLIN maps of J1530+1049. The colour scale shows the continuum-subtracted Hα line map, where low-significance pixels have been masked (for details, see Saxena et al. 2026). The logarithmically scaled cyan contours show the optical continuum data taken with F300M filter. The lowest contour is drawn at 9.8 mJy arcsec−2. The white and orange contours represent the 1.5-GHz and the 5-GHz e-MERLIN data. Radio contour levels are the same as in Figs. 3, 4, except that negative contours are omitted for clarity. Yellow crosses show the positions of the two EVN-detected features (the positional uncertainties are much smaller than their sizes). The C1, C2 and C6 and L1 and L3 labels show the optical continuum and line-emitting regions, respectively as defined in Saxena et al. (2026). In the lower left corner the linear scale is displayed.
Current usage metrics show cumulative count of Article Views (full-text article views including HTML views, PDF and ePub downloads, according to the available data) and Abstracts Views on Vision4Press platform.
Data correspond to usage on the plateform after 2015. The current usage metrics is available 48-96 hours after online publication and is updated daily on week days.
Initial download of the metrics may take a while.