


Fig. 2.
Download original image
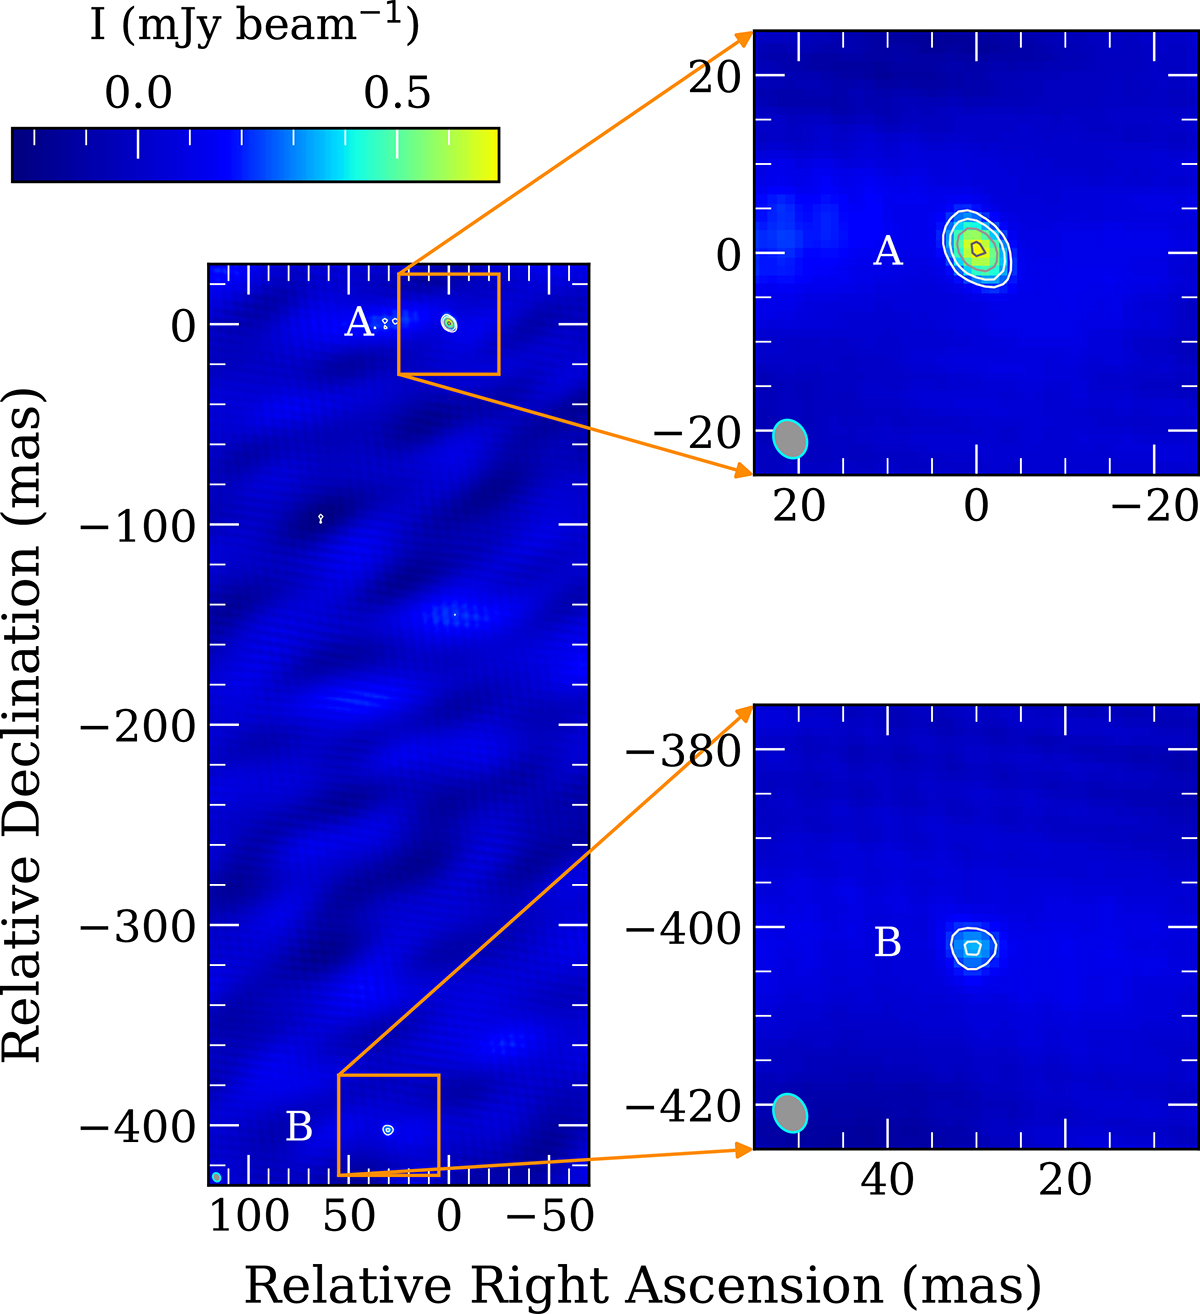
EVN 1.7-GHz maps of J1530+1049. On the right-hand side, the two detected features are shown zoomed-in. The peak intensity of the whole image is 0.70 mJy beam−1. The contour levels are at ( ± 0.23, 0.33, 0.47, 0.66) mJy beam−1. The lowest positive contour level corresponds to 5σ image noise. The restoring beam is shown in the lower left corner of the panels. Its FWHM size is 4.48 mas × 3.61 mas at a position angle of 27°.
Current usage metrics show cumulative count of Article Views (full-text article views including HTML views, PDF and ePub downloads, according to the available data) and Abstracts Views on Vision4Press platform.
Data correspond to usage on the plateform after 2015. The current usage metrics is available 48-96 hours after online publication and is updated daily on week days.
Initial download of the metrics may take a while.