


Fig. 5.
Download original image
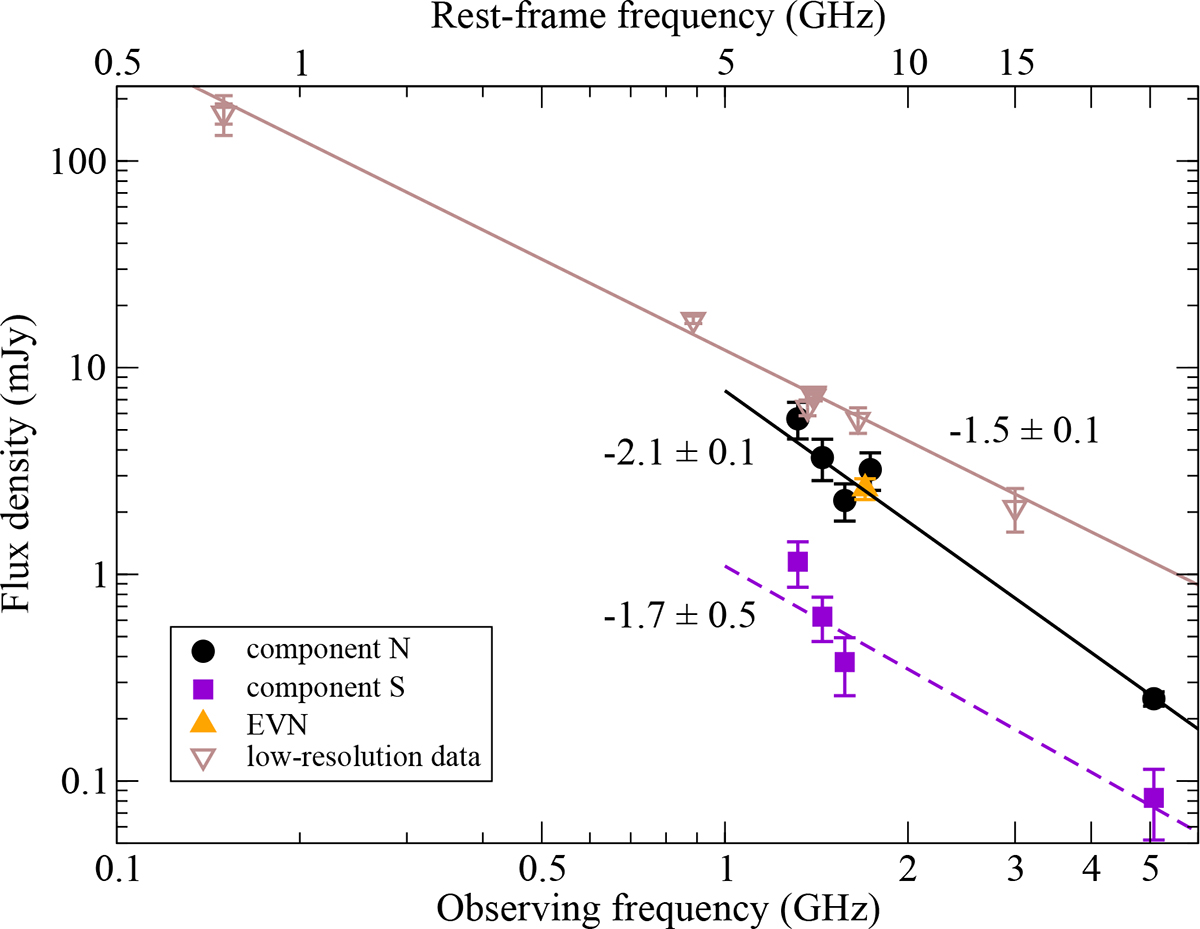
Flux densities of the two Gaussian components that can be fitted to the e-MERLIN visibilities of J1530+1049. Circles and squares are for components N and S, respectively. The solid and dashed lines are power-law fits to the corresponding data points. For comparison, the sum of the flux densities of the EVN-detected components is also shown with an upward yellow triangle. Empty downward brown triangles show lower-resolution flux density measurements from various surveys (see Sect. 4.4 for details), and the brown line indicates the power-law fit to those points. The numbers show the corresponding spectral indices.
Current usage metrics show cumulative count of Article Views (full-text article views including HTML views, PDF and ePub downloads, according to the available data) and Abstracts Views on Vision4Press platform.
Data correspond to usage on the plateform after 2015. The current usage metrics is available 48-96 hours after online publication and is updated daily on week days.
Initial download of the metrics may take a while.