| Issue |
A&A
Volume 695, March 2025
|
|
|---|---|---|
| Article Number | A168 | |
| Number of page(s) | 10 | |
| Section | Planets, planetary systems, and small bodies | |
| DOI | https://doi.org/10.1051/0004-6361/202453270 | |
| Published online | 18 March 2025 | |
Water in Ryugu as a property of processes in its parent body
1
Instituto de Astrofísica de Canarias (IAC), University of La Laguna,
La Laguna, Tenerife, Spain
2
Institut d’Astrophysique Spatiale, Université Paris-Saclay, CNRS,
Orsay,
France
3
Institut Universitaire de France,
Paris,
France
4
Institute of Space and Astronautical Science, Japan Aerospace Exploration Agency,
Sagamihara,
Japan
5
Marine Works Japan Ltd,
Yokosuka,
Japan
6
National Institute of Polar Research,
Tachikawa,
Japan
7
University of Tokyo,
Tokyo,
Japan
8
European Space Agency, European Space Astronomy Centre,
Madrid,
Spain
9
Department of Astrophysics, University of La Laguna, La Laguna,
Tenerife,
Spain
10
The Graduate University for Advanced Studies (SOKENDAI),
Hayama,
Japan
11
University of Tokyo,
Kashiwa,
Japan
12
Nagoya University,
Nagoya,
Japan
★ Corresponding author; tlepivert@iac.es
Received:
3
December
2024
Accepted:
17
February
2025
Context. Samples from the asteroid Ryugu provide key information on the initial composition and evolutionary processes of primitive bodies.
Aims. This study aims to detect H2O spectral features associated with inter-layer water in a statistically significant number of Ryugu grains protected from terrestrial contamination.
Methods. We analysed hyperspectral data of 186 millimetre-sized Ryugu grains (1.5–5.7 mm) obtained using the MicrOmega instrument at the Curation Facility. Water signatures were identified by computing the spectral distance from a reference Ryugu grain that exhibits a prominent 3 µm feature, which is associated with the presence of H2O.
Results. We detect rare and small water-rich regions (typically <90 × 90 µm2). No significant difference in water content is observed between grains collected from chamber A (surface collection) and chamber C (artificial crater ejecta). The water-rich regions exhibit band widths similar to those of several primitive asteroids measured by the AKARI survey, whereas the average, millimetre-scale spectra of Ryugu grains show narrower bands.
Conclusions. We confirm the low abundance of inter-layer water in Ryugu samples across a statistically significant number of grains. The spectral differences between Ryugu and the primitive asteroids analysed in this study reflect differences in composition that may indicate distinct formation reservoirs or evolutionary processes.
Key words: techniques: imaging spectroscopy / minor planets, asteroids: general
© The Authors 2025
 Open Access article, published by EDP Sciences, under the terms of the Creative Commons Attribution License (https://creativecommons.org/licenses/by/4.0), which permits unrestricted use, distribution, and reproduction in any medium, provided the original work is properly cited.
This article is published in open access under the Subscribe to Open model. Subscribe to A&A to support open access publication.
1 Introduction
Primitive asteroids of the main asteroid belt have low albedos (ρv< 0.10) and are believed to have formed beyond the H2O snow line, where they accreted volatiles phases, such as ices and organics (e.g. Walsh et al. 2011; Vernazza et al. 2015; Kruijer et al. 2017). Some primitive asteroids experienced hydrothermal processes, which led to the formation of secondary phases (e.g. Hiroi et al. 1996; Brearley 2006; de León et al. 2012; Suttle et al. 2021). The variability in the initial composition and the different degrees of hydrothermal processes experienced by primitive asteroids resulted in a diversity in their spectra (e.g. DeMeo et al. 2009; Mahlke et al. 2022). In particular, some specific spectral ranges such as the near-ultraviolet (e.g. Tinaut-Ruano et al. 2024), 0.7 µm (e.g. Fornasier et al. 2014) or 3 µm regions (e.g. Takir & Emery 2012) provide access to signatures of hydrated minerals. Studying primitive asteroids provides valuable information on the Solar System’s original composition of volatiles and its evolution, as well as on the possible supply of water and organics to the inner Solar System.
Hayabusa2 (JAXA, Japan Aerospace Exploration Agency) was the first mission to return samples from a primitive near-Earth asteroid, (162173) Ryugu, to Earth (Watanabe et al. 2017). Ryugu is a rubble-pile asteroid of spectral class Cb (according to the BusDeMeo taxonomy; DeMeo et al. 2009) that resulted from the fragmentation of a larger parent body in the main asteroid belt (Campins et al. 2013; Watanabe et al. 2019; Sugita et al. 2019). Spectroscopic observations of the surface by the NIRS3 spectrometer revealed the presence of a sharp feature around 2.7 µm, indicating that Ryugu’s parent body experienced hydrothermal processes (Kitazato et al. 2019). The spacecraft performed two collections, with a second touchdown made near the artificial Small Carry Impactor crater to collect samples from the sub-surface (Arakawa et al. 2020). After its return in December 2020, the capsule containing 5.4 g of Ryugu samples was transferred and opened in the Institute of Space and Astronautical Science Curation Facility (Yada et al. 2021).
Spectroscopic analyses carried out at the Curation Facility (Yada et al. 2021; Pilorget et al. 2021; Loizeau et al. 2023) and in-depth characterisation of the mineralogy (e.g. Ito et al. 2022; Nakamura et al. 2023; Yokoyama et al. 2023; Yam-aguchi et al. 2023) revealed that the Ryugu samples contain a high fraction of secondary minerals formed by an extensive degree of aqueous alteration. In particular, the samples contain saponite-like phyllosilicates (Nakamura et al. 2023; Yokoyama et al. 2023; Ito et al. 2022). Saponites are phyllosilicates with inter-layer spaces large enough to contain H2O molecules (e.g. Bishop et al. 2008). Inter-layer water signatures can be detected by infrared spectroscopy, with the OH stretching absorption in H2O at ~2.9 µm (e.g. Bishop 1994; Potin et al. 2020b). The more weakly bound water, adsorbed at the surface or in the pores, also shows a stretching absorption at ~3.1 µm (e.g. Potin et al. 2020b). Thermo-gravimetric (Yokoyama et al. 2023) and X-ray diffraction (Viennet et al. 2023; Nakamura et al. 2023) analyses show that the grains contain a low quantity of water molecules (≤0.3 wt.%) in the inter-layer spaces of saponite-like phyllosilicates, especially compared to the water amount found in carbonaceous chondrites.
Previous studies have analysed Ryugu’s water content in a limited number of millimetre-sized Ryugu grains: seventeen in Nakamura et al. (2023), two in Yokoyama et al. (2023), and one in Viennet et al. (2023). Our goal was to detect water signatures, with a particular focus on inter-layer water, in 186 grains ranging from 1.5 to 5.7 mm in size, using the MicrOmega hyperspectral microscope at the Curation Facility (Pilorget et al. 2021). While infrared spectroscopy does not provide an absolute quantification of water content, it is a non-destructive technique suitable for analysing numerous samples while preserving their integrity. This study provides a comparative analysis of inter-layer water signatures across an order of magnitude more grains. We ensured the detected water is indigenous to Ryugu or its parent body, as samples are maintained in a controlled, clean environment to prevent terrestrial contamination (Yada et al. 2021, 2023). We compared the amount of water spectral signatures of Ryugu particles from the two collection sites and with other primitive asteroids to assess how evolutionary processes may have influenced the initial water content in these objects.
2 Methods
2.1 MicrOmega at the Curation Facility
The spectroscopic measurements of the samples were performed with MicrOmega, a near-infrared (0.99–3.65 µm) hyperspectral microscope (Bibring et al. 2017). The instrument works as follows: A monochromatic beam, with a full width at half maximum (FWHM) of 20 cm−1, illuminates the samples with an incidence angle of 35°. The wavelength of the incident light is selected by an acousto-optic tunable filter. The detector is above the samples, at an emergence angle of 0°. The instrument acquires images of 256 × 250 pixels with a spatial sampling of 22.5 × 22.5 µm2 and a total field of view covering ~ 5.7 × 5.7 mm2. Hyperspectral cubes (x,y,λ), with one spectral, and two spatial dimensions (the field of view), are built by scanning the different wavelengths over the 0.99–3.65 µm range. The spectral sampling of MicrOmega is typically 20 cm−1 and reaches 10 cm−1 in the ~ 2.7 µm region. MicrOmega can estimate the peak position of the features with an accuracy of ±2.5 nm (Riu et al. 2022). It also reaches an accuracy better than 20% for the absolute reflectance level and better than 1% for the relative reflectance (wavelength-to-wavelength; Riu et al. 2022).
The samples are analysed in a chamber purged with ultra-pure nitrogen to avoid any contamination by terrestrial H2O (Yada et al. 2021, 2023). They are placed inside sapphire dishes on top of a gold-polished mirror. The mirror and the sample holder are placed on a moving stage that enables their rotation along the ɀ axis. Given the illumination geometry of the instrument, some areas of the grain can be in the shade at some orientations. In this study, we analysed 186 grains, each measured under four azimuthal orientations (0°, 90°, 180°, and 270°) to have a full coverage of the grain’s surface. We analysed 101 grains from chamber A and 85 grains from chamber C, measured by MicrOmega between March 2021 and April 2022.
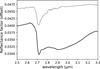 |
Fig. 1 Average spectra of grain A0159, measured at the Curation Facility (in grey) and in the PTAL chamber, after being exposed to air (in black). An offset of +0.012 has been applied to the spectrum measured at the Curation Facility for clarity. |
2.2 Detection of water signatures
To detect water signatures in the samples, we need a spectrum of reference. We have at our disposal one grain, first measured by MicrOmega at the Curation Facility and then measured again after being exposed to the terrestrial atmosphere. This grain, named A0159, was extracted from chamber A (surface collection) and is 2.8 mm in size. A0159 was allocated to the Institut d’Astrophysique Spatiale (IAS) through the first announcement of opportunity for Hayabusa2 samples. In that context, the grain was measured by another MicrOmega model, at IAS, in a bench designed for the Planetary Terrestrial Analogues Library (PTAL) project (Loizeau et al. 2020). The sample holder was placed on a stage cooled down to −20°C and the whole system was inside a glove box purged with nitrogen.
A0159 offers the opportunity to compare the spectral signatures before and after the contamination by the terrestrial atmosphere (Fig. 1). We see that both spectra show the 2.7 µm feature associated with the OH stretching band in phyllosilicates. However, in the spectrum measured at IAS, we observe a large absorption band, centred at around 3 µm, compatible with the presence of the ~2.9 µm band of absorbed H2O in the inter-layer water of some phyllosilicates and the ~3.1 µm band of adsorbed H2O in the pores and on the surface (e.g. Potin et al. 2020b). We can find similar features at around 3 µm in reflectance and transmittance spectra of carbonaceous chondrites when they are measured under ambient conditions (Beck et al. 2010; Takir et al. 2013, 2019; Amano et al. 2023). The presence of terrestrial H2O in A0159, offers an opportunity to detect indigenous spectral features associated with H2O in Ryugu samples measured at the Curation Facility. In particular, the presence of the sharp metal-OH absorption band at 2.7 µm and the wide H2O band around 3 µm makes A0159 a good reference to detect water in inter-layers of phyllosilicates, that has previously been detected by X-ray diffraction (Nakamura et al. 2023; Viennet et al. 2023). For example, terrestrial saponites, which contain H2O in their inter-layer spaces, show the two features (e.g. Bishop et al. 2008).
The absence of large 3 µm features in the average spectra of millimetre-sized Ryugu samples (e.g. Le Pivert-Jolivet et al. 2023; Amano et al. 2023) indicates that H20 molecules are not highly abundant and can only be detected at smaller scales. All the cubes were binned by a factor of 4 × 4 (average of groups of 16 spectra) to increase the quality of the spectra, while keeping a spatial scale small enough to detect H2O signatures. The spatial sampling of the binned data is 90 × 90 µm. We first removed the continuum by computing the convex hull (i.e. straight-line segments; Clark & Roush 1984) of the binned spectral data, smoothed with a Savitsky-Golay filter (window length of nine spectral channels, polynomial order of three). This filter was only used for the continuum determination, and not for the rest of the analysis. Then, each spectrum of the binned cubes was divided by the resulting convex hull continuum, as shown in Fig. 2. We searched for strong 3 µm bands similar to that of grain A0159 after being exposed to the atmosphere (hereafter A0159-exposed) by computing the spectral distance between the average spectrum of A0159-exposed (black spectrum in Fig. 1) and each spectrum in the binned hyperspectral cubes. The spectral distance is often used in spectroscopic studies to constrain the composition of an object by comparing its spectrum with references spectra, like laboratory samples (e.g. Popescu et al. 2011; Kaplan et al. 2020; Mahlke et al. 2023). This method has the advantage of utilising a large number of spectral channels to identify signatures, making it more robust than methods relaying on a single wavelength, such as calculating the band depth. Before calculating the distance, we normalised all the spectra so that the band at 2.7 µm has a depth of 0.5, in order to place emphasis on the comparison of the band’s shape rather than its depth. The relative depth of the 2.7 µm band of the reference spectrum is equal to 0.25 (Fig. 1) but can vary from pixel to pixel in the hyperspectral data. Normalising the spectra to the same value of band depth avoids detecting preferentially pixels with a band depth similar to that of the reference. The distance was estimated using the cosine metric, defined as

where R is the reference spectrum, S the spectrum of a given pixel, i the spectral channel index and N the total number of spectral channels (see the appendix), over the 2.6–3.2 µm spectral range.
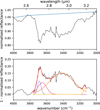 |
Fig. 2 Top: example of a convex hull continuum (blue curve) applied to a smoothed version of the spectrum of one pixel in grain C0093 (black curve). The spectrum is normalised at the reflectance value at 2.6 µm. The interval used to define the continuum in this example is 2.50–3.33 µm (4000−3000 cm−1). Bottom: Example of a resulting fitting curve (red curve) applied to the same spectrum. In this example, the interval 2.66–3.20 µm (3765−3125 cm−1) is used to perform the fit. The four individual Gaussians used for the fit are shown in purple, pink, orange, and yellow. |
2.3 Comparison with asteroid spectra
Previous near-infrared surveys of primitive asteroids with ground-based (e.g. Takir & Emery 2012) or space telescopes (e.g. Usui et al. 2019) highlighted the existence of a variability in the shape of the 3 µm feature between different objects. Some works compared the shape of the 3 µm feature of asteroids with the one observed in laboratory spectra of meteorites (e.g. Potin et al. 2020a; Rivkin et al. 2022). Here, we aim to compare the spectra of Ryugu samples, with and without H2O signatures, with different spectra of asteroids from the survey of the space telescope AKARI, which performed infrared (2.5–5 µm) observations for 66 asteroids located in the main belt, including 23 objects belonging to the carbonaceous complex, with a diameter larger than 40 km (Usui et al. 2019). We selected nine C-type asteroids from the AKARI dataset with a feature at 2.7 µm (i.e. spectra showing a 2.7 µm feature with a depth at least twice the measurement uncertainty) and compared their signatures with the one observed in the samples. The selected asteroids are (1) Ceres (spectral type C according to the BusDe-Meo taxonomy, DeMeo et al. 2009), (2) Pallas (B type), (10) Hygiea (C type), (24) Themis (C type), (50) Virginia (Ch type), (106) Dione (Cgh type), (121) Hermione (Ch type), (511) Davida (C type), and (704) Interamnia (Cb type).
We used two parameters to characterise the 2.7 µm feature: the peak position and the FWHM. These parameters were estimated by performing a fit of four Gaussian functions, in wavenumber space, on the continuum-removed spectra (Fig. 2). To estimate the precision of this method, we used several intervals for the continuum definition and for the fit. The first step was to divide all the spectra by a convex hull continuum, using two different intervals: 2.50–3.55 µm (4000−2817 cm−1) and 2.50–3.33 µm (4000−3000 cm−1). Then, we performed a fit of four Gaussian curves over the band. Two different intervals were used for the fit: 2.66–3.20 µm (3765−3125 cm−1) and 2.60–3.30 µm (3846−3030 cm−1). We then resampled the fit and calculated the peak position at the maximum of absorption, as well as the FWHM. We took the average and the standard deviation of the four tests (two continuums and two fitting intervals) as final values for the peak position and the FWHM. Considering the error bars, the band position obtained by the Gaussian fit is consistent with the positions reported in Usui et al. (2019). Moreover, the peak position and the FWHM values of the asteroids are consistent with the values obtained on the same data, but with a different methodology (Potin et al. 2020a). We also calculated the peak position and the FWHM of spectra of several regions of interest (ROIs) in Ryugu samples, corresponding to spectra with a large absorption band at 3 µm, as well as for several typical average spectra of millimetre-sized grains (not showing a large 3 µm band).
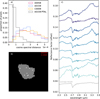 |
Fig. 3 Panel a: cosine spectral distance distribution for the four orientations of different grains. The vertical black line indicates the threshold value of 6.19 × 10⁻⁵ and corresponds to the median of the distance distribution of the four orientations of grain A0159-exposed. Panel b: map of water signatures at the surface of uncontaminated grain A0159 (one orientation). The sample holder and the grain are in black and grey, respectively. Pixels with values less than the threshold are in white. Panel c: example of spectra with distance values lower than the threshold at the surface of uncontaminated A0159. The spectra correspond to the pixels in white in panel b and are arranged in order of increasing distance from top to bottom (the spectra at the top have lower distance values). The average spectrum of the entire surface of grain A0159 is in grey. |
3 Results
3.1 Distance distribution: Curation Facility grains versus A0159-exposed
When comparing the spectral distance distribution of grains measured at the Curation Facility with that of A0159-exposed, we observe that A0159-exposed shows, in general, lower distances than grains measured at the Curation Facility (Fig. 3a). This means that the 186 grains measured at the Curation Facility do not exhibit as many spectra with the deep 3 µm band as A0159-exposed.
To characterise in details the proportion of pixels with signatures close to the reference in the grains measured at the Curation Facility, we defined a distance threshold below which the spectrum is considered to have a water signature (i.e. an absorption band around 3 µm). The distance threshold is defined as the median of the distance distribution of the four orientations of A0159-exposed (vertical line in Fig. 3a) and is equal to 6.19 × 10⁻⁵. The spectra of pixels with distance values lower than the threshold show the absorption band around 2.7 µm corresponding to the structural OH, as well as a large inflexion around 3 µm that is similar to the H2O signature in the reference spectrum (Fig. 3c).
In Fig. 3b, we see that the pixels with low distance values only represent a small fraction of the surface of grain A0159 (before exposure, at the Curation Facility), between 0.9% and 2.3% depending on the orientation. When analysing all the grains, we observe that the ROIs (corresponding to the continuous areas having spectral distances lower than the threshold) are small, 95% of them have a size of one pixel in the binned hyperspectral data (i.e. a size of 90 × 90 µm). The largest ROI is found in one orientation of grain C0011 and has a size of 360 × 90 µm. However, the other orientations of grain C0011 do not exhibit this large ROI. The variations in the proportion and the size of the ROIs from one orientation to the next are probably due to the surface roughness of the samples. Depending on the illumination geometry, some parts of the grain will be in the shadow or show bright specular reflection. Thus, it is important to consider the four azimuth angles for all the grains in order to have a representative value of the proportion of water detection.
We observe variations in the proportion of pixels with low distance values between the grains (Fig. 4). A0070 is the grain with the highest fraction of water signatures, with a proportion of pixels below the threshold of 2.9 ± 1.1% (average and standard deviation of the four orientations). On the other hand, A0086 is a grain that does not have any pixels with low distance values, no matter the orientation. The variations in the proportion of pixels with low distance values between the grains is higher than the variations between the orientations for a single grain (in average, the variations between the orientations is equal to 1.6%). Thus, we consider the variations between the grain to be significant. We compared the distributions of the proportion of pixels with low distance values between the two chambers A and C (Fig. 4) and observe a slight shift between the two distributions. The median value of pixels with low distances is slightly higher in chamber C (1.3%) than in chamber A (1.1%). We performed a Kolmogorov-Smirnov (KS) test to test the null hypothesis that the two distributions are identical. We chose a p-value threshold of 0.05 (confidence level of 95%), below which we reject the null hypothesis and consider that the two distributions are distinct. We obtain a KS statistic (maximum distance between the cumulative distributions) of D = 0.16 and a probability value of the two distributions to be identical of p = 0.15, which is higher than the threshold of 0.05. This means that there is no significant difference in the proportion of pixel with low distance values between the chambers.
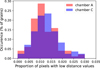 |
Fig. 4 Distribution of the average proportion of pixels with distance values below the threshold in grains from chamber A (in red) and chamber C (in blue). This value is the average of the proportions of the different orientations for each grain. |
3.2 Comparison with asteroid spectra
Figure 5 (left) compares spectra of two ROIs with low distance values on grains A0017 (ROI 1) and C0093 (ROI 2), with the average spectra of grains A0017 and C0093, and with spectra of two asteroids measured by AKARI: 121 Hermione and 2 Pallas. The OH stretching band is detected in all spectra and located between 2.7 and 2.8 µm. ROI 2 exhibits a secondary feature around 3 µm. ROI 1 does not clearly exhibit a band at 3 µm, but has a larger absorption band than the average spectrum of A0017. Similarly, the spectrum of asteroid 121 Hermione exhibits a wide band with an inflexion in the 2.9–3.15 µm region. The average spectra of grains A0017 and C0093 only exhibit the OH stretching band without the 3 µm feature. In the spectra of 2 Pallas, we do not observe an inflexion as large as the ones observed in the ROIs or 121 Hermione around 3 µm.
For 10 ROIs, found in different grains from the two chambers (A0017, A0054, A0058, A0070, A0110, C0011, C0032, C0040, C0093, and C0115) and with good quality spectra, we performed a Gaussian fit to characterise the peak position and the FWHM of the feature across the 2.7–3.15 µm region. The same parameters were calculated on the average spectra of the grains measured at the Curation Facility, on the spectrum of A0159-exposed and on the spectra of nine asteroids measured by the AKARI survey. The scatter diagram of the two parameters (Fig. 5, right) shows that the features of the Ryugu samples are distinct from those of the nine asteroids’ spectra analysed in this study. The 2.7 µm bands of the average spectra of the grains (in red in Fig. 5) have FWHM values below 0.1, which is lower than the values found in the nine asteroids’ spectra (in orange) and in the ROIs spectra (in purple). The FWHM values of the ROIs in Ryugu samples vary between 0.3 and 0.5, which is consistent with the values found in five out of the nine asteroids characterised, the four other having lower values (around 0.2). Concerning the differences in peak position, if we take into account the uncertainty on the calibration, equal to ± 2. 5 nm, the 2.7 µm band of Ryugu samples (average spectrum and ROIs) has generally a peak position at lower wavelengths compared to other asteroids. Only Ceres, Hygiea, and Interamnia have similar peak position values within the uncertainties.
4 Discussion
The proportion of detected water signatures offers a relative, rather than absolute, measure of water content in the samples, as infrared light does not penetrate the entire sample. We used a spectral reference optimised to detect inter-layer water, characterised by the OH stretching bands in phyllosilicates and water molecules. The reference is not suitable for detecting water molecules trapped within pores or present in hydrated amorphous silicates, as it has been observed for the CM chondrite Paris (Dionnet et al. 2018). Amorphous silicates, however, represent only a very small fraction of Ryugu’s mineralogy. For example, in grain C0002, they represent less than 0.3% of the surface (Brunetto et al. 2023) and they were not detected in other grains (Nakamura et al. 2023). Notably, infrared spectroscopy is a non-destructive and non-invasive technique, suitable for a larger number of samples while maintaining their integrity. Consequently, this study does not aim to provide absolute water quantification, but a relative comparison of inter-layer water signatures among the grains.
All 186 grains in this study have a spectral distance distribution displaced towards higher values compared to grain A0159-exposed (Fig. 3). We interpret this result as a lower amount of inter-layer water molecules in the grains measured at the Curation Facility. In the grains, the areas with strong H2O signatures are rare (only a few percent) and small (most of them have a maximum size of ≃90 × 90 µm2). These results demonstrate that the low quantity of inter-layer water, observed by previous studies in fewer grains (Yokoyama et al. 2023; Nakamura et al. 2023; Viennet et al. 2023), is a general property of Ryugu samples preserved from terrestrial contamination. The low quantity of water in Ryugu samples compared to carbonaceous chondrites have been discussed in previous studies (e.g. Yokoyama et al. 2023; Viennet et al. 2023; Le Pivert-Jolivet et al. 2023; Amano et al. 2023). Because Ryugu and CI chondrites have similar abundances of volatile elements (e.g. Yokoyama et al. 2023), a significant fraction of water molecules in carbonaceous chondrites, adsorbed at the surface, but also within the inter-layers of saponite-like phyllosilicates, probably come from the terrestrial atmosphere.
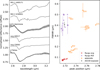 |
Fig. 5 Left: spectra of two ROIs (90 × 90 µm2 each) with distance values below the threshold (ROI 1 and ROI 2) in grains A0017 and C0093. The average spectra of grains A0017 and C0093 are also shown for comparison. Spectra of two asteroids measured by the AKARI space telescope are also plotted: 121 Hermione and 2 Pallas (Usui et al. 2019) The spectra measured by MicrOmega have been resampled to the spectral sampling of AKARI data. Right: dispersion graph between the FWHM and the peak position of the 3 µm band for different spectra of Ryugu samples (ROIs with a 3 µm band in purple, average spectra in red, and A0159-exposed in black) and asteroids from the AKARI survey (orange). |
4.1 Differences in the water content among the grains
Because chambers A and C are expected to contain grains collected at the surface and in the ejecta of the artificial crater, respectively, comparing the water content between the chambers provide information on the physical processes affecting the surface of Ryugu. Although we observe a variation in the proportion of inter-layer H2O signatures among the grains, there is no strong variations in the H2O proportion between the two chambers. We observed a small shift between the two distributions, suggesting that the proportion of H2O signatures in chamber C (median = 1.3%) is slightly higher than in chamber A (median = 1.1%). However, the difference between the median values is small, and, according to the KS test, we cannot reject the hypothesis that the distributions are similar.
The surface of asteroids is subjected to alteration processes, such as space weathering or radiative heating. Radiative heating is a process that affects the surface of asteroids at depths that are deeper than space weathering, typically larger than a few centimetres (Noguchi et al. 2023; Morota et al. 2020). Even if, according to the median values, chamber C could have a higher amount of H2O signatures compared to chamber A, this difference is very small and not statistically significant. The similar proportion of water signatures between the two chambers could indicate that the heating was not sufficient to dehydrate significantly the surface of Ryugu. This is consistent with Yokoyama et al. (2023) who suggested from thermo-gravimetric profile that the samples were likely never heated above 90–100°C, because they would have lost their entire amount of H2O otherwise. The Ne isotopic composition of the samples also suggests they have not been heated above 100° C within the last 1 Myr (Okazaki et al. 2023).
Textures associated with space weathering have been reported at the surface of Ryugu samples (Nakato et al. 2023; Noguchi et al. 2023). Phyllosilicates of altered layers (called ‘smooth layers’, generally less than 100 nm thick) contain less structural OH compared to the interior phyllosilicates (Noguchi et al. 2023). We investigated the hypothesis that space weathering could reduce the quantity of inter-layer water H2O, in addition to the dehydroxylation of the phyllosilicates. Spectroscopic analyses of Ryugu’s surface and samples show that space weathering tends to shift the peak position of the 2.7 µm feature towards longer wavelengths (Kitazato et al. 2021; Le Pivert-Jolivet et al. 2023; Hiroi et al. 2023). We compared the proportion of pixels with low-distance values between two groups of 30 grains: those with peak positions at higher wavelengths (average spectrum peak position >2.718 µm) and those at lower wavelengths (average spectrum peak position <2.716 µm). A KS test applied to the two distributions yielded a similarity probability of 0.95. The high p-value suggests that there is no significant difference in the proportion of water signature between grains with positions at higher wavelength (thought to have experienced more space weathering) and grains with positions at lower wavelengths (thought to have experienced less space weathering). The absence of significant differences in water content between the space-weathered and the pristine grains could be explained if the weathered surface phyllosilicates are dehydroxylated (less structural OH) but still contain a significant amount of water molecules (i.e. an inter-layer H2O content similar to the interior phyllosilicates). This could happen, for example, if there was a formation of H2O molecules through the reaction between some particles/ions (H+,H2+) from the solar wind and structural OH from phyllosilicates. This process has been reported in some irradiation experiments of phyllosilicates and meteorites (Nakauchi et al. 2021; Laczniak et al. 2021). A more likely explanation is that our method is not effective in probing the potential presence of water in these altered layers. The altered layers are dehydroxylated, so they contain little structural OH. However, our spectral reference has a strong structural OH band at 2.7 µm, in addition to the band at 3 µm. Thus, spectra from dehydroxylated phyllosilicates might have a spectral distance very distinct from the reference. It is therefore likely that the ROIs highlighted in this study are located in deeper phyllosilicates that are also probed by incident light photons.
4.2 Comparison between Ryugu samples and asteroids
We observe differences in the width and the position of the 2.7 µm feature between the water-rich regions in Ryugu samples, the average spectra of Ryugu samples and the spectra of several primitive asteroids. The samples of Ryugu (water-rich ROIs and average spectrum) have a peak position at shorter wavelengths than most of the asteroids analysed in this work. A previous study compared spectra measured by the space telescope AKARI with the remote-sensing spectra of Ryugu, observed by NIRS3, and observed a consistent shift (Potin et al. 2020a). The same study also shows that asteroid Ryugu has a narrower band compared to the other asteroids, a property we also observe down to millimetre scales in the average spectra of the samples (Le Pivert-Jolivet et al. 2023). It is only at scales of hundreds of microns that we can detect rare spectral signatures with similar FWHM values.
Although this study compares different size scales (millimetre-sized grains versus kilometre-sized asteroids), the differences in the width and peak position of the 2.7 µm band between Ryugu and other primitive asteroids are unlikely to result from variations in surface scattering properties due to differences in grain size (regolith versus boulders) or porosity. Matsuoka et al. (2023) studied the spectral effects of those physical properties by comparing spectra of coarse grains and powders of Ryugu samples with the asteroid’s surface spectrum measured by NIRS3. The authors observed variations in the 2.7 µm band depth between the remote-sensing and the laboratory observations, but the peak position and the shape of the OH stretching feature are consistent. They also measured powders of the Murchison meteorite with different porosity and grain size, and did not observe a shift of the position of the 2.7 µm feature in samples with different physical properties. Several laboratory studies showed that space weathering induce a shift of the 2.7 µm band towards longer wavelengths (e.g. Lantz et al. 2017; Rubino et al. 2020). On weathered surfaces, the spectral shift depends on the phase angle and is more important in cases of specular observation geometries (Rubino et al. 2022). Thus, we cannot exclude that differences in terms of surface ages and exposition to space environment between Ryugu and the other objects could be responsible for the spectral variations.
If the spectral variations are not linked to differences in scattering properties or in surface exposure age, they could translate to variations in the composition between Ryugu and other asteroids. From spectroscopic measurement of phyllosilicates, we know that the peak position of the OH stretching band varies with the Mg/(Mg+Fe) ratio: for example, terrestrial Mg-rich smectites have a peak position at 2.72 µm whereas the maximum of absorption in Fe-rich smectite is centred around 2.8 µm (e.g. Bishop et al. 2008). Thus, the peak position at shorter wavelengths in Ryugu compared to the other nine asteroids could be explained by a more Mg-rich composition of Ryugu’s phyllosilicates. The narrow band observed at scales larger than the millimetre in Ryugu could be due to a lower amount of H2O compared to the asteroids in the main belt.
Ryugu is a rubble-pile asteroid of ~1 km in diameter, coming from a larger collisional family, probably the Polana-Eulalia family, located in the inner main belt (Campins et al. 2013; de León et al. 2018; Brož et al. 2024). The nine asteroids from of the AKARI survey have a diameter larger than 40 km, and they are located in the middle belt, the outer belt, or the Cybele family (Usui et al. 2019). According to formation models, the precursors of the primitive asteroids formed in the outer Solar System. Differences in isotopic compositions between carbonaceous and non-carbonaceous meteorites (chondrites and achondrites) suggests that the reservoir of carbonaceous planetesimals was distinct from the one of non-carbonaceous ones, and probably located beyond the orbit of Jupiter (e.g. Kruijer et al. 2017; Kleine et al. 2020). Then, the carbonaceous planetesimals were implanted in the main belt after a migration of the giant planets (e.g. Walsh et al. 2012), or earlier, during an instability driven by the giant planet growth (e.g. Raymond & Izidoro 2017b). Several hypotheses could explain why Ryugu and the primitive asteroids presented in this study have different composition, despite the fact they are all believed to have formed beyond the orbit of Jupiter. As a first hypothesis, Ryugu’s parent body could have formed in a region of the outer Solar System different from the one of the parent bodies of the nine asteroids. The different initial composition and subsequent evolution between the carbonaceous planetesimals would have led to asteroids with different composition and water content. This scenario is likely given the broad source region of implanted primitive asteroids (e.g. Raymond & Izidoro 2017a) and the heterogeneity observed in the composition of outer small bodies of the outer Solar System today (De Prá et al. 2024). The diversity of composition between different primitive asteroids could also be due to later stage processes. As a second hypothesis, if we assume that the initial composition of the parent bodies is similar, because they formed in the same region of the protoplanetary disk, the final diversity could be due to differences in their subsequent evolution: different degrees of hydrothermal processes would have led to different final compositions. Now, if we imagine that the initial composition and the evolution were similar between the parent bodies, a last hypothesis could imply that the evolutionary processes experienced by primitive asteroids, such as aqueous alteration, do not modify the composition homogeneously. Small fragments of larger objects, such as Ryugu, could not represent the diversity of composition in their parent body. This hypothesis of heterogeneous primitive bodies have been explored in previous study, to propose for example that anhydrous and hydrous interplanetary dust particles or some chondrites (Tagish-Lake and CI) could sample different regions with different degrees of aqueous alteration within a same parent body (Vernazza et al. 2017).
5 Conclusions
The aim of this study was to characterise the spectral signatures associated with inter-layer water in a large and representative sample of Ryugu particles (186 mm grains). Overall, the low proportion and the spatially limited nature of the water-rich regions in the samples confirm that the Ryugu samples, preserved from terrestrial contamination, contain a lower quantity of inter-layer water than carbonaceous chondrites. Thus, the low quantity of water is a general property of asteroid Ryugu and reflects the evolutionary processes of the asteroid, and its parent body. The comparison of Ryugu spectra with asteroids spectra from the AKARI survey suggests differences in the water content and the mineral composition, possibly due to differences in initial compositions or evolutionary processes, or to the heterogeneous nature of aqueous alteration.
Acknowledgements
We thank the whole Hayabusa2 team for their scientific and technical contributions to this successful mission. This work was supported by the Centre National d’Etudes Spatiales and by the ANR project LARCAS under grant ANR-22-CE49-0009-01 of the French Agence Nationale de la Recherche. T.L.P.J. and J.d.L. acknowledge support from the Agencia Estatal de Investigación del Ministerio de Ciencia e Innovación (AEI-MCINN) under grant “Hydrated minerals and organic compounds in primitive asteroids” (PID2020-120464GB-I00/doi:10.13039/501100011033). This research is based on observations with AKARI, a JAXA project with the participation of ESA.
Appendix A Selection of the distance metric
It is important to choose an appropriate method for estimating the proportion of signatures associated with water in our sample. The method must separate efficiently the spectra with large 3 µm bands from other spectra without this feature. We tested different methods, including band depth calculation at 2.9 µm. However, even by averaging a few spectral channels around 2.9 µm, the band depth produces a lot of false positive detections (for example, spectra with low signal-to-noise ratio or large fluctuations). The spectral distance criterion is more robust than the band depth. It has the advantage of considering a larger number of spectral channels and returns fewer false positives. We tested several distance metrics: weighted Euclidean (Eq. A.1), cosine (Eq. A.3), Manhattan (Eq. A.4), Canberra (Eq. A.5), and chi-square (Eq. A.6).
In all the following equations, R corresponds to the reference spectrum and S to the spectrum of a given pixel in the hyperspectral data. N is the number of spectral channels over the range 2.6–3.2 µm:
-
The weighted Euclidean distance is computed as
 (A.1)
(A.1)with ω corresponding to a Gaussian centred in the 2.9 µm region:
 (A.2)
(A.2)


The grain A0159, measured by two MicrOmega instruments before and after its exposure to the atmosphere, offers the opportunity to look for the most appropriate distance metric to separate efficiently water spectral signatures from other features. Even if grain A0159 shows two opposite faces in the measurements at the Curation Facility and in the PTAL bench, the main difference between the spectra is the appearance of the feature at 3 µm. Thus, we can make the hypothesis that the absorption of water molecules prevails in the spectral changes of the grain in the 3 µm region, after exposure.
KS statistic (D) and associated p-values calculated between the two distance distributions (A0159 before and after exposure) for all metrics.
For all the metrics listed above, we calculated the spectral distance between the hyperspectral data from A0159 (before and after exposure) and the reference spectrum, corresponding to the average spectrum of A0159-exposed over four different orientations. The reference spectrum is smoothed with a Savitsky-Golay filter to limit the fluctuations of noise. This distance was computed for cubes binned by a factor of 4 × 4 and for four azimuthal orientations of the grain (0°, 90°, 180, ° and 270°). For each metric, we obtained the distribution of the distance for all pixels and all orientations of grain A0159, before and after exposure, as illustrated in Fig. A.1.
Given the large amount of data and the impossibility to remove by eye the false positives from the detections, we need to select a conservative method to increase the confidence we have in the positive detections. Thus, the most appropriate method for distinguishing spectra with 3 µm features from other signatures is the method that maximises the difference between the distance distribution of A0159 before and after exposure. To find the best method, we performed a two-sample KS test, in which the KS statistic D corresponds to the maximum distance between the cumulative distributions of two distributions. The metric with the highest D-value and the lowest p-value (the probability that two datasets have the same distribution) is the metric that maximises the difference between the two distributions. The D and p-values are reported for all metrics in the Table A.1.
According to this test, the cosine metric is the method that maximises the difference between the two distributions and is, thus, the most adapted method for efficiently distinguishing 3 µm features from other signatures in the grains. In this study, we used the cosine method (Eq. A.3) to calculate the spectral distances of the grains measured at the Curation Facility.
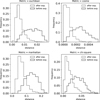 |
Fig. A.1 Distance distribution of grain A0159, before and after exposure, for different metrics. |
References
- Amano, K., Matsuoka, M., Nakamura, T., et al. 2023, Sci. Adv., 9, eadi3789 [Google Scholar]
- Arakawa, M., Saiki, T., Wada, K., et al. 2020, Science, 368, 67 [NASA ADS] [CrossRef] [Google Scholar]
- Beck, P., Quirico, E., Montes-Hernandez, G., et al. 2010, Geochim. Cos- mochim. Acta, 74, 4881 [NASA ADS] [CrossRef] [Google Scholar]
- Bibring, J.-P., Hamm, V., Pilorget, C., Vago, J. L., & MicrOmega Team. 2017, Astrobiology, 17, 621 [NASA ADS] [CrossRef] [Google Scholar]
- Bishop, J. L. 1994, Clays Clay Miner., 42, 702 [NASA ADS] [CrossRef] [Google Scholar]
- Bishop, J. L., Lane, M. D., Dyar, M. D., & Brown, A. J. 2008, Clay Miner., 43, 35 [NASA ADS] [CrossRef] [Google Scholar]
- Brearley, A. J. 2006, in Meteorites and the Early Solar System II, eds. D. S. Lauretta, & H. Y. McSween, 584 [Google Scholar]
- Brož, M., Vernazza, P., Marsset, M., et al. 2024, A&A, 689, A183 [NASA ADS] [CrossRef] [EDP Sciences] [Google Scholar]
- Brunetto, R., Lantz, C., Fukuda, Y., et al. 2023, ApJ, 951, L33 [NASA ADS] [CrossRef] [Google Scholar]
- Campins, H., de León, J., Morbidelli, A., et al. 2013, AJ, 146, 26 [NASA ADS] [CrossRef] [Google Scholar]
- Clark, R. N., & Roush, T. L. 1984, J. Geophys. Res., 89, 6329 [NASA ADS] [CrossRef] [Google Scholar]
- de León, J., Pinilla-Alonso, N., Campins, H., Licandro, J., & Marzo, G. A. 2012, Icarus, 218, 196 [CrossRef] [Google Scholar]
- de León, J., Campins, H., Morate, D., et al. 2018, Icarus, 313, 25 [CrossRef] [Google Scholar]
- De Prá, M. N., Hénault, E., Pinilla-Alonso, N., et al. 2024, Nat. Astron., 9, 252 [Google Scholar]
- DeMeo, F. E., Binzel, R. P., Slivan, S. M., & Bus, S. J. 2009, Icarus, 202, 160 [Google Scholar]
- Dionnet, Z., Aleon-Toppani, A., Baklouti, D., et al. 2018, Meteoritics & Planetary Science, 53, 2608 [NASA ADS] [CrossRef] [Google Scholar]
- Fornasier, S., Lantz, C., Barucci, M. A., & Lazzarin, M. 2014, Icarus, 233, 163 [Google Scholar]
- Hiroi, T., Zolensky, M. E., Pieters, C. M., & Lipschutz, M. E. 1996, Meteoritics & Planetary Science, 31, 321 [CrossRef] [Google Scholar]
- Hiroi, T., Milliken, R. E., Robertson, K. M., et al. 2023, Icarus, 406, 115755 [NASA ADS] [CrossRef] [Google Scholar]
- Ito, M., Tomioka, N., Uesugi, M., et al. 2022, Nat. Astron., 6, 1163 [NASA ADS] [CrossRef] [Google Scholar]
- Kaplan, H. H., Lauretta, D. S., Simon, A. A., et al. 2020, Science, 370, eabc3557 [Google Scholar]
- Kitazato, K., Milliken, R. E., Iwata, T., et al. 2019, Science, 364, 272 [Google Scholar]
- Kitazato, K., Milliken, R. E., Iwata, T., et al. 2021, Nat. Astron., 5, 246 [NASA ADS] [CrossRef] [Google Scholar]
- Kleine, T., Budde, G., Burkhardt, C., et al. 2020, Space Sci. Rev., 216, 55 [CrossRef] [Google Scholar]
- Kruijer, T. S., Burkhardt, C., Budde, G., & Kleine, T. 2017, PNAS, 114, 6712 [NASA ADS] [CrossRef] [Google Scholar]
- Laczniak, D. L., Thompson, M. S., Christoffersen, R., et al. 2021, Icarus, 364, 114479 [CrossRef] [Google Scholar]
- Lantz, C., Brunetto, R., Barucci, M. A., et al. 2017, Icarus, 285, 43 [CrossRef] [Google Scholar]
- Le Pivert-Jolivet, T., Brunetto, R., Pilorget, C., et al. 2023, Nat. Astron., 7, 1445 [Google Scholar]
- Loizeau, D., Lequertier, G., Poulet, F., et al. 2020, Planet. Space Sci., 193, 105087 [Google Scholar]
- Loizeau, D., Pilorget, C., Riu, L., et al. 2023, Nat. Astron., 7, 391 [Google Scholar]
- Mahlke, M., Carry, B., & Mattei, P. A. 2022, A&A, 665, A26 [NASA ADS] [CrossRef] [EDP Sciences] [Google Scholar]
- Mahlke, M., Lantz, C., Baklouti, D., et al. 2023, in LPI Contributions, 2851, Asteroids, Comets, Meteors Conference, 2246 [NASA ADS] [Google Scholar]
- Matsuoka, M., Kagawa, E.-I., Amano, K., et al. 2023, Commun. Earth Environ., 4, 335 [NASA ADS] [CrossRef] [Google Scholar]
- Morota, T., Sugita, S., Cho, Y., et al. 2020, Science, 368, 654 [NASA ADS] [CrossRef] [Google Scholar]
- Nakamura, T., Matsumoto, M., Amano, K., et al. 2023, Science, 379, abn8671 [NASA ADS] [CrossRef] [Google Scholar]
- Nakato, A., Yada, T., Nishimura, M., et al. 2023, Earth Planets Space, 75, 45 [NASA ADS] [CrossRef] [Google Scholar]
- Nakauchi, Y., Abe, M., Ohtake, M., et al. 2021, Icarus, 355, 114140 [NASA ADS] [CrossRef] [Google Scholar]
- Noguchi, T., Matsumoto, T., Miyake, A., et al. 2023, Nat. Astron., 7, 170 [NASA ADS] [Google Scholar]
- Okazaki, R., Marty, B., Busemann, H., et al. 2023, Science, 379, abo0431 [Google Scholar]
- Pilorget, C., Okada, T., Hamm, V., et al. 2021, Nat. Astron., 6, 221 [Google Scholar]
- Popescu, M., Birlan, M., Binzel, R., et al. 2011, A&A, 535, A15 [NASA ADS] [CrossRef] [EDP Sciences] [Google Scholar]
- Potin, S., Beck, P., Usui, F., et al. 2020a, Icarus, 348, 113826 [CrossRef] [Google Scholar]
- Potin, S., Manigand, S., Beck, P., Wolters, C., & Schmitt, B. 2020b, Icarus, 343, 113686 [NASA ADS] [CrossRef] [Google Scholar]
- Raymond, S. N., & Izidoro, A. 2017a, Icarus, 297, 134 [CrossRef] [Google Scholar]
- Raymond, S. N., & Izidoro, A. 2017b, Sci. Adv., 3, e1701138 [NASA ADS] [CrossRef] [Google Scholar]
- Riu, L., Pilorget, C., Hamm, V., et al. 2022, Rev. Sci. Instrum., 93, 054503 [Google Scholar]
- Rivkin, A. S., Emery, J. P., Howell, E. S., et al. 2022, Planet. Sci. J., 3, 153 [NASA ADS] [CrossRef] [Google Scholar]
- Rubino, S., Lantz, C., Baklouti, D., et al. 2020, Planet. Sci. J., 1, 61 [NASA ADS] [CrossRef] [Google Scholar]
- Rubino, S., Potin, S., Lantz, C., et al. 2022, Icarus, 376, 114887 [NASA ADS] [CrossRef] [Google Scholar]
- Sugita, S., Honda, R., Morota, T., et al. 2019, Science, 364, eaaw0422 [Google Scholar]
- Suttle, M. D., King, A. J., Schofield, P. F., Bates, H., & Russell, S. S. 2021, Geochim. Cosmochim. Acta, 299, 219 [NASA ADS] [CrossRef] [Google Scholar]
- Takir, D., & Emery, J. P. 2012, Icarus, 219, 641 [NASA ADS] [CrossRef] [Google Scholar]
- Takir, D., Emery, J. P., McSween, H. Y., et al. 2013, Meteoritics & Planetary Science, 48, 1618 [NASA ADS] [CrossRef] [Google Scholar]
- Takir, D., Stockstill-Cahill, K. R., Hibbitts, C. A., & Nakauchi, Y. 2019, Icarus, 333, 243 [Google Scholar]
- Tinaut-Ruano, F., de León, J., Tatsumi, E., et al. 2024, A&A, 686, A76 [NASA ADS] [CrossRef] [EDP Sciences] [Google Scholar]
- Usui, F., Hasegawa, S., Ootsubo, T., & Onaka, T. 2019, PASJ, 71, 1 [NASA ADS] [CrossRef] [Google Scholar]
- Vernazza, P., Marsset, M., Beck, P., et al. 2015, ApJ, 806, 204 [Google Scholar]
- Vernazza, P., Castillo-Rogez, J., Beck, P., et al. 2017, AJ, 153, 72 [NASA ADS] [CrossRef] [Google Scholar]
- Viennet, J. C., Roskosz, M., Nakamura, T., et al. 2023, Geochem. Perspect. Lett., 25, 8 [NASA ADS] [CrossRef] [Google Scholar]
- Walsh, K. J., Morbidelli, A., Raymond, S. N., O’Brien, D. P., & Mandell, A. M. 2011, Nature, 475, 206 [Google Scholar]
- Walsh, K. J., Morbidelli, A., Raymond, S. N., O’Brien, D. P., & Mandell, A. M. 2012, Meteoritics & Planetary Science, 47, 1941 [NASA ADS] [CrossRef] [Google Scholar]
- Watanabe, S.-I., Tsuda, Y., Yoshikawa, M., et al. 2017, Space Sci. Rev., 208, 3 [NASA ADS] [CrossRef] [Google Scholar]
- Watanabe, S., Hirabayashi, M., Hirata, N., et al. 2019, Science, 364, 268 [NASA ADS] [Google Scholar]
- Yada, T., Abe, M., Okada, T., et al. 2021, Nat. Astron., 6, 214 [Google Scholar]
- Yada, T., Abe, M., Nishimura, M., et al. 2023, Earth Planets Space, 75, 170 [NASA ADS] [CrossRef] [Google Scholar]
- Yam-aguchi, A., Tomioka, N., Ito, M., et al. 2023, Nat. Astron., 7, 398 [Google Scholar]
- Yokoyama, T., Nagashima, K., Nakai, I., et al. 2023, Science, 379, abn7850 [NASA ADS] [CrossRef] [Google Scholar]
All Tables
KS statistic (D) and associated p-values calculated between the two distance distributions (A0159 before and after exposure) for all metrics.
All Figures
|
Fig. 1 Average spectra of grain A0159, measured at the Curation Facility (in grey) and in the PTAL chamber, after being exposed to air (in black). An offset of +0.012 has been applied to the spectrum measured at the Curation Facility for clarity. |
| In the text | |
|
Fig. 2 Top: example of a convex hull continuum (blue curve) applied to a smoothed version of the spectrum of one pixel in grain C0093 (black curve). The spectrum is normalised at the reflectance value at 2.6 µm. The interval used to define the continuum in this example is 2.50–3.33 µm (4000−3000 cm−1). Bottom: Example of a resulting fitting curve (red curve) applied to the same spectrum. In this example, the interval 2.66–3.20 µm (3765−3125 cm−1) is used to perform the fit. The four individual Gaussians used for the fit are shown in purple, pink, orange, and yellow. |
| In the text | |
|
Fig. 3 Panel a: cosine spectral distance distribution for the four orientations of different grains. The vertical black line indicates the threshold value of 6.19 × 10⁻⁵ and corresponds to the median of the distance distribution of the four orientations of grain A0159-exposed. Panel b: map of water signatures at the surface of uncontaminated grain A0159 (one orientation). The sample holder and the grain are in black and grey, respectively. Pixels with values less than the threshold are in white. Panel c: example of spectra with distance values lower than the threshold at the surface of uncontaminated A0159. The spectra correspond to the pixels in white in panel b and are arranged in order of increasing distance from top to bottom (the spectra at the top have lower distance values). The average spectrum of the entire surface of grain A0159 is in grey. |
| In the text | |
|
Fig. 4 Distribution of the average proportion of pixels with distance values below the threshold in grains from chamber A (in red) and chamber C (in blue). This value is the average of the proportions of the different orientations for each grain. |
| In the text | |
|
Fig. 5 Left: spectra of two ROIs (90 × 90 µm2 each) with distance values below the threshold (ROI 1 and ROI 2) in grains A0017 and C0093. The average spectra of grains A0017 and C0093 are also shown for comparison. Spectra of two asteroids measured by the AKARI space telescope are also plotted: 121 Hermione and 2 Pallas (Usui et al. 2019) The spectra measured by MicrOmega have been resampled to the spectral sampling of AKARI data. Right: dispersion graph between the FWHM and the peak position of the 3 µm band for different spectra of Ryugu samples (ROIs with a 3 µm band in purple, average spectra in red, and A0159-exposed in black) and asteroids from the AKARI survey (orange). |
| In the text | |
|
Fig. A.1 Distance distribution of grain A0159, before and after exposure, for different metrics. |
| In the text | |
Current usage metrics show cumulative count of Article Views (full-text article views including HTML views, PDF and ePub downloads, according to the available data) and Abstracts Views on Vision4Press platform.
Data correspond to usage on the plateform after 2015. The current usage metrics is available 48-96 hours after online publication and is updated daily on week days.
Initial download of the metrics may take a while.