Fig. 5
Download original image
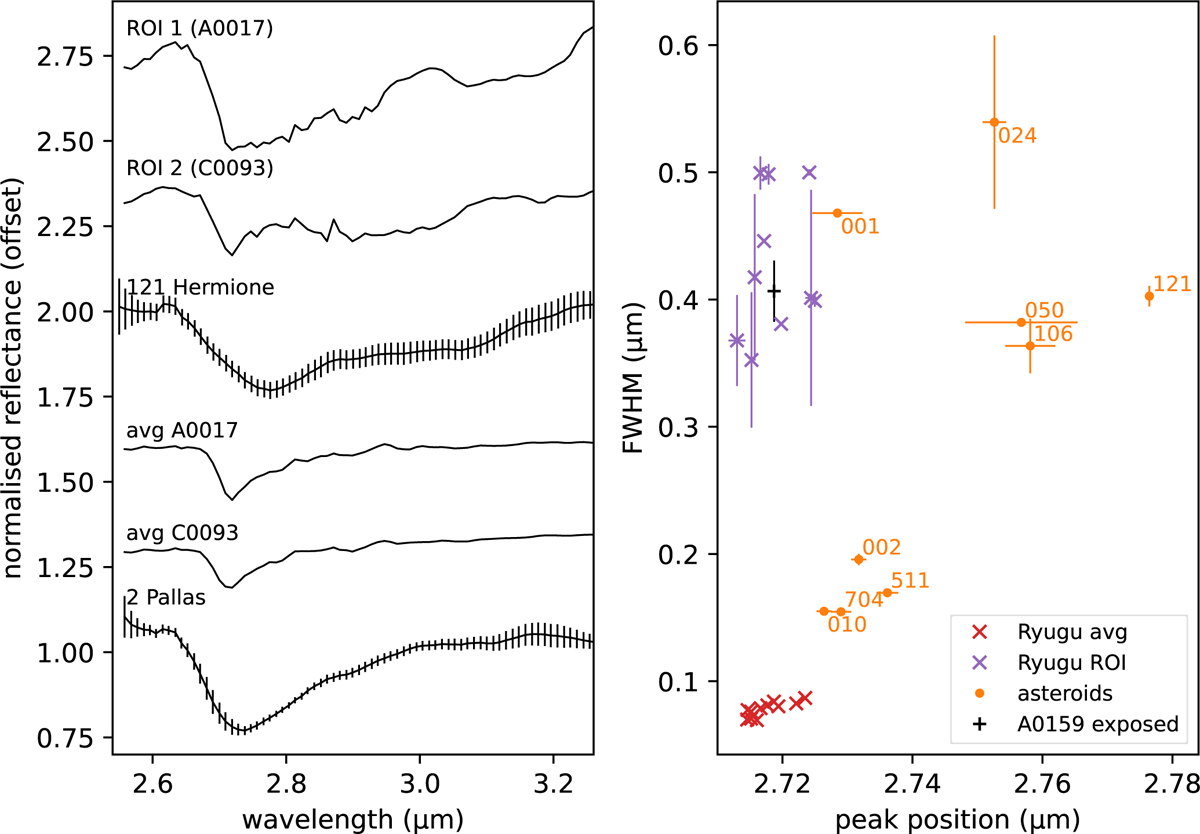
Left: spectra of two ROIs (90 × 90 µm2 each) with distance values below the threshold (ROI 1 and ROI 2) in grains A0017 and C0093. The average spectra of grains A0017 and C0093 are also shown for comparison. Spectra of two asteroids measured by the AKARI space telescope are also plotted: 121 Hermione and 2 Pallas (Usui et al. 2019) The spectra measured by MicrOmega have been resampled to the spectral sampling of AKARI data. Right: dispersion graph between the FWHM and the peak position of the 3 µm band for different spectra of Ryugu samples (ROIs with a 3 µm band in purple, average spectra in red, and A0159-exposed in black) and asteroids from the AKARI survey (orange).
Current usage metrics show cumulative count of Article Views (full-text article views including HTML views, PDF and ePub downloads, according to the available data) and Abstracts Views on Vision4Press platform.
Data correspond to usage on the plateform after 2015. The current usage metrics is available 48-96 hours after online publication and is updated daily on week days.
Initial download of the metrics may take a while.