Fig. 2
Download original image
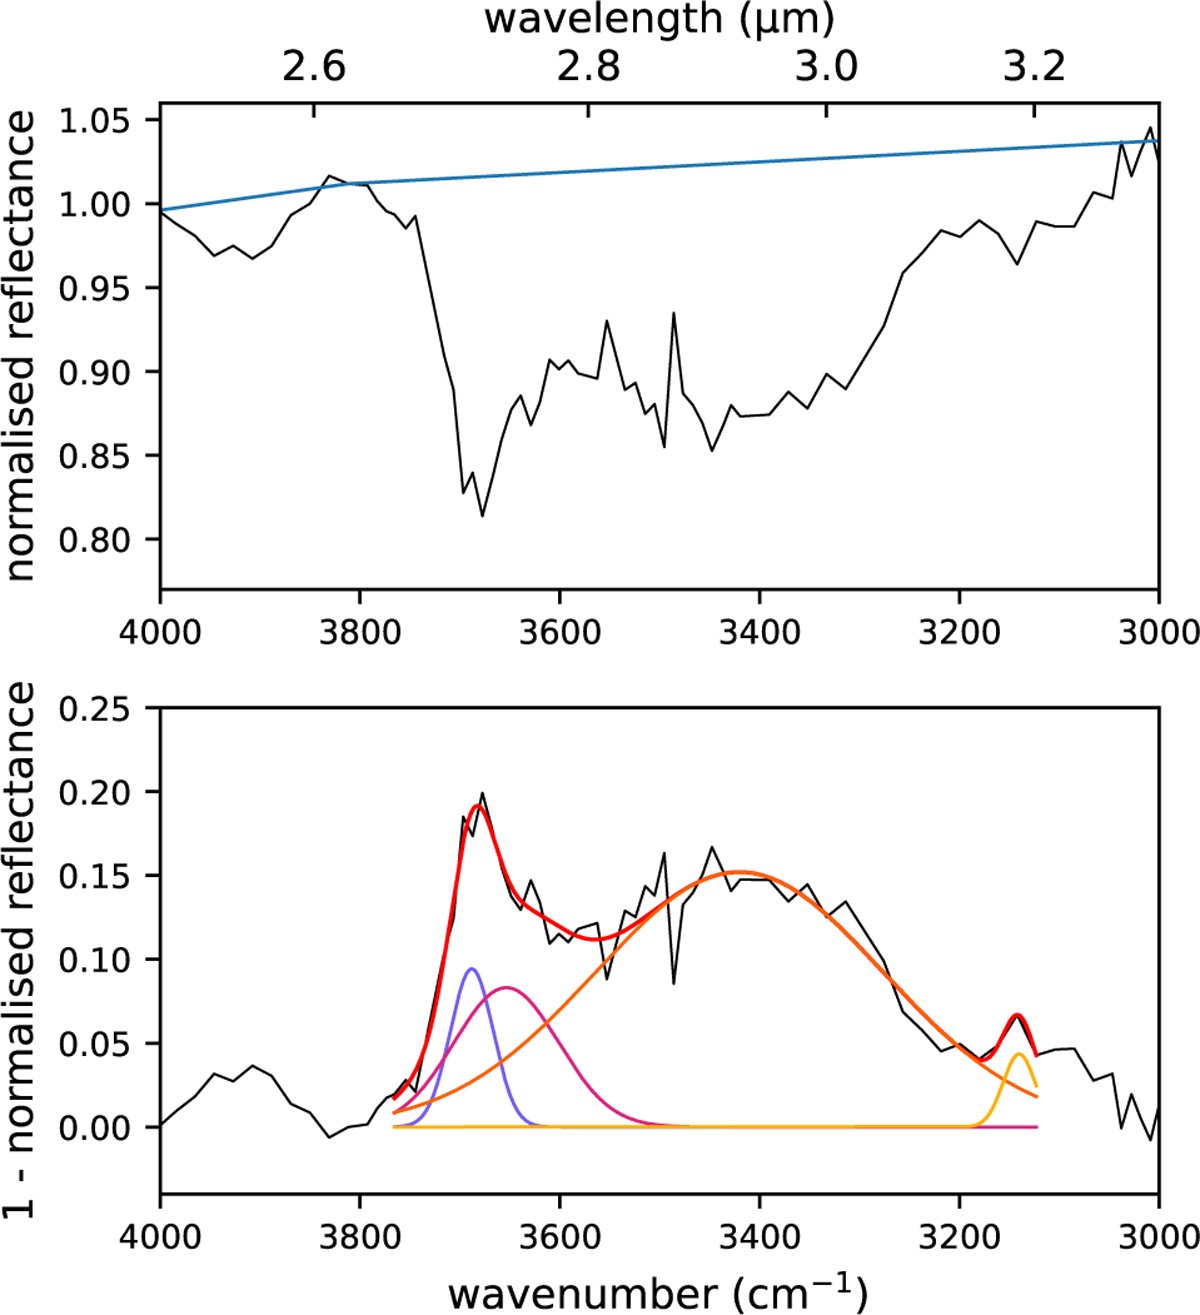
Top: example of a convex hull continuum (blue curve) applied to a smoothed version of the spectrum of one pixel in grain C0093 (black curve). The spectrum is normalised at the reflectance value at 2.6 µm. The interval used to define the continuum in this example is 2.50–3.33 µm (4000−3000 cm−1). Bottom: Example of a resulting fitting curve (red curve) applied to the same spectrum. In this example, the interval 2.66–3.20 µm (3765−3125 cm−1) is used to perform the fit. The four individual Gaussians used for the fit are shown in purple, pink, orange, and yellow.
Current usage metrics show cumulative count of Article Views (full-text article views including HTML views, PDF and ePub downloads, according to the available data) and Abstracts Views on Vision4Press platform.
Data correspond to usage on the plateform after 2015. The current usage metrics is available 48-96 hours after online publication and is updated daily on week days.
Initial download of the metrics may take a while.