Fig. 3
Download original image
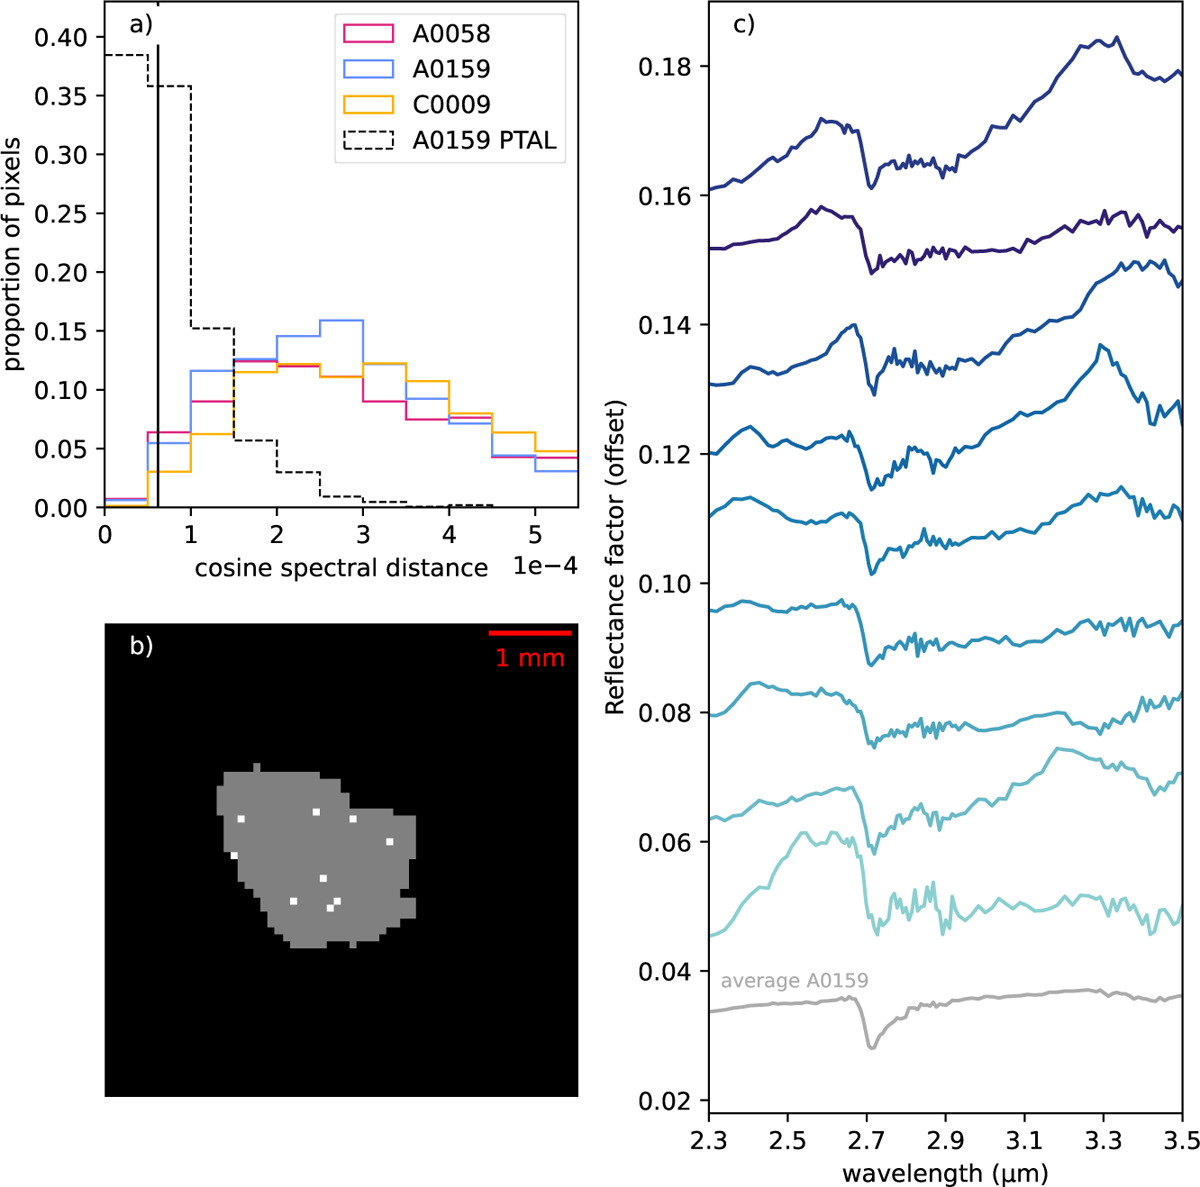
Panel a: cosine spectral distance distribution for the four orientations of different grains. The vertical black line indicates the threshold value of 6.19 × 10⁻⁵ and corresponds to the median of the distance distribution of the four orientations of grain A0159-exposed. Panel b: map of water signatures at the surface of uncontaminated grain A0159 (one orientation). The sample holder and the grain are in black and grey, respectively. Pixels with values less than the threshold are in white. Panel c: example of spectra with distance values lower than the threshold at the surface of uncontaminated A0159. The spectra correspond to the pixels in white in panel b and are arranged in order of increasing distance from top to bottom (the spectra at the top have lower distance values). The average spectrum of the entire surface of grain A0159 is in grey.
Current usage metrics show cumulative count of Article Views (full-text article views including HTML views, PDF and ePub downloads, according to the available data) and Abstracts Views on Vision4Press platform.
Data correspond to usage on the plateform after 2015. The current usage metrics is available 48-96 hours after online publication and is updated daily on week days.
Initial download of the metrics may take a while.