| Issue |
A&A
Volume 692, December 2024
|
|
|---|---|---|
| Article Number | A233 | |
| Number of page(s) | 9 | |
| Section | Extragalactic astronomy | |
| DOI | https://doi.org/10.1051/0004-6361/202450112 | |
| Published online | 17 December 2024 | |
Partial alignment between jets and megamasers: Coherent versus selective accretion
1
Università degli Studi di Milano-Bicocca, Piazza della Scienza 3, 20126 Milano, Italy
2
INFN, Sezione di Milano-Bicocca, Piazza della Scienza 3, I-20126 Milano, Italy
3
INAF – Osservatorio Astronomico di Brera, Via Brera 20, I-20121 Milano, Italy
4
Leibniz-Institute for Astrophysics Potsdam (AIP), An der Sternwarte 16, 14482 Potsdam, Germany
5
INAF – Osservatorio di Astrofisica e Scienza dello Spazio di Bologna, Via Gobetti 93/3, I-40129 Bologna, Italy
6
Dipartimento di Fisica “E. Fermi”, Università di Pisa, I-56127 Pisa, Italy
7
Istituto Nazionale di Fisica Nucleare, Sezione di Pisa, I-56127 Pisa, Italy
8
Institut für Astrophysik, Universität Zürich, Winterthurerstrasse 190, CH-8057 Zürich, Switzerland
⋆ Corresponding author; massimo.dotti@unimib.it
Received:
25
March
2024
Accepted:
6
November
2024
Spins play a crucial role in the appearance, evolution, and occupation fraction of massive black holes (MBHs). To date, observational estimates of MBH spins are scarce, and the assumptions commonly made in such estimates have recently been questioned. Similarly, theoretical models for MBH spin evolution, while reproducing the few observational constraints, are based on possibly oversimplified assumptions. New independent constraints on MBH spins are therefore of primary importance. We present a rigorous statistical analysis of the relative orientation of radio jets and megamaser disks in ten low-redshift galaxies. We find a strong preference for (partial) alignment between jets and megamaser that can be attributed to two different causes: coherent accretion and selective accretion. In the first case the partial alignment is due to an anisotropy in the gas reservoir fueling the growth of MBHs. In the second case the spin-dependent anisotropic feedback allows long-lived accretion only if the orbits of the gas inflows are almost aligned to the MBH equatorial plane. A discussion of the implications of the two accretion scenarios regarding the evolution of MBHs is presented, together with an outlook on future observational tests aiming at discriminating between the two scenarios and checking whether either applies to different redshifts and black hole mass regimes.
Key words: accretion / accretion disks / black hole physics / methods: statistical / quasars: supermassive black holes
© The Authors 2024
 Open Access article, published by EDP Sciences, under the terms of the Creative Commons Attribution License (https://creativecommons.org/licenses/by/4.0), which permits unrestricted use, distribution, and reproduction in any medium, provided the original work is properly cited.
This article is published in open access under the Subscribe to Open model. Subscribe to A&A to support open access publication.
1. Introduction
Astrophysical black holes (BHs) are described by their masses and their spin vectors only. The latter, more than mass, can inform us on the physical processes responsible for their fueling and feedback (e.g., Blandford & Znajek 1977; Berti & Volonteri 2008). Spin evolution through gas accretion is particularly relevant for massive BHs (MBHs, with masses MBH ≳ 105 M⊙; e.g., Cavaliere et al. 1971; Soltan 1982; Merloni & Heinz 2008; Shankar et al. 2013) as the main process shaping the MBH spin distribution. Only the heaviest MBHs, where gas-poor binary mergers may be relevant, might be an exception (e.g., Fanidakis et al. 2011; Barausse 2012).
Until a decade ago only two models for accretion-driven spin evolution were available in the literature. The first, called coherent accretion, assumes that MBHs accrete at least their initial mass from disks with fixed orientation1 during each accretion episode. Under such conditions the MBH spin rapidly aligns with its accretion disk, and the following accretion spins the MBH up to values of the adimensional spin parameter a ∼ 1 (Bardeen 1970; Bardeen & Petterson 1975). The alternative chaotic accretion model assumes small and isotropically distributed accretion episodes, during each of which the BH increases its mass by less than 10%, leading to slowly rotating MBHs (with a < 0.2, King & Pringle 2006).
The time evolution of the accretion disk orientation might differ, however, depending on the fueling mechanisms (e.g., minor and major galaxy mergers, or bar-within-bar instabilities Combes 2003). Dotti et al. (2013) first observed that the distribution of a does not need to be so dichotomic. By relaxing the assumption of perfect coherence or isotropy, Dotti et al. (2013) predicted that MBHs with masses < 107 M⊙ should have high (a ∼ 0.9, but not maximal) spins, while for the most massive MBHs, the spin should depend on the host-galaxy dynamics. The inclusion of the Dotti et al. (2013) model in semi-analytical codes allowed, for the first time and without fine-tuning the free parameters, us to match the distribution of a derived through X-ray spectral fitting (Sesana et al. 2014, Izquierdo-Villalba et al. 2020). It should be noted, however, that Sesana et al. (2014) somewhat arbitrarily assumed that the angular momentum direction of the accretion episodes at subparsec scales is dictated by the large-scale (≳100 pc) dynamics of the host’s gas and stars. Furthermore, the spin magnitude estimates through the fitting of the X-ray Fe K emission line could be biased by assumptions of the spectral analysis (e.g., Parker et al. 2022). For these reasons independent constraints on the small-scale orientations of accretion episodes (with respect to the MBH spin) are highly valuable.
Greene et al. (2013) presented observational evidence for the close alignment between nuclear jets and the angular momentum of the gas inflow up to ∼1 pc, traced by megamaser disks (see Kamali et al. 2019 for a confirmation of this result). These are geometrically thin disks on close-to-Keplerian orbits around MBHs, in which the observed spectral lines (associated with molecular transitions) are produced through stimulated emission. A peculiarity of megamasers is that in order to trigger enough transitions and produce the observed luminosities, the photons must travel an extended region of the molecular disk. As a consequence, megamasers are only observed within a few degrees from edge-on, so that measuring their projection on the plane of the sky strongly constrains their three-dimensional orientation. Under the assumption that jets and MBH spins are aligned, such observational evidence would imply a substantial alignment between the parsec and horizon scales. A significantly lesser degree of alignment is present between the small-scale (horizon/parsec scales, traced by jets and megamasers respectively) and the large-scale (circumnuclear and galactic disks) structures, to the point that the planes of these structures are consistent with being independently extracted from an isotropic distribution (Greene et al. 2013). Greene et al. (2013) extensively discuss the possible reasons for the weak (or lack of) alignment between megamasers and galactic-scale structures. However, the physical processes responsible for the (partial) alignment between jets and megamaser disks (horizon and parsec scales) have not been investigated by Greene et al. (2013) or by Kamali et al. (2019). To date, a straightforward explanation for such a partial alignment is missing as the relativistic effects forcing the accretion disk to align with the MBH spin (i.e., the Bardeen–Petterson effect, Bardeen & Petterson 1975) cannot operate at parsec scales (see Sect. 3).
In this study we re-analyze the sample presented in Greene et al. (2013), constraining through a Bayesian analysis the significance of the observed alignment between the jets and megamaser disks and the typical 3D degree of misalignments between the two structures (Sect. 2). We then focus on the possible processes leading to such alignment, proposing two alternative scenarios, one in which the accretion process is responsible for the observed alignment and a new scenario in which the alignment is required in order to sustain accretion events (Sect. 3). We conclude by discussing the implications of the two scenarios and the possible ways to distinguish between them (Sect. 4).
2. Bayesian evidence for jet–maser disk partial alignment
2.1. Observational sample
The sample we analyzed consists of ten galaxies hosting both a jet and a water megamaser (observed at 22 GHz). All the hosts of such active galactic nuclei (AGN) are disk galaxies (either spirals or S0s) and have luminosities close to L*2, as expected given the MBH mass estimates for these sources (in the 106 − 107 M⊙ range). The redshifts and masses of the stellar component and of the central MBH for each galaxy are listed in Table 1. The hosts do not show signs of ongoing strong interactions, and are typically found in galaxy groups, as we found cross-correlating the positions of the ten hosts with the group catalog by Tully (2015).
Main properties of the sample.
Our analysis starts from the position angles (PAs) observed for the jets (PAj) and megamasers (PAmm) of the ten AGN. The parameter PAj identifies the direction of the projection of the jet on the plane of the sky3, and it is assumed to be aligned with the direction of the MBH spin. The parameter PAmm is the position angle of the principal axis of the ellipse obtained by projecting the megamaser disk onto the plane of the sky4. An AGN with perfectly aligned jet and megamaser angular momentum will therefore result in a relative inclination between the two PAs of 90°. In the following we quantify the relative misalignments between megamasers and jets (ΔPA) as the smallest of the two angles generated by the crossing of the two straight lines (on the plane of the sky) defined by PAj and PAmm (as originally defined in Greene et al. 2013). A schematic illustration of the position angles is shown in Fig. 1.
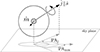 |
Fig. 1. Illustration of a jet–megamaser disk system and its orientation with respect to the observer line of sight, as seen by projection angles. The jet direction (assumed to be aligned with the MBH spin |


The AGN host-galaxy names and the measured PAmm and PAj values are listed in Table 2. Most measurements were obtained from Greene et al. (2013), though some PAs were not quoted and were searched for in the literature. Specifically, the PAmm and PAj of NGC 3079 and Circinus are from Kondratko et al. (2005) and Greenhill et al. (2003), respectively; the PAmm and PAj of NGC 1068 are from Gallimore & Impellizzeri (2023); and the PAmm of NGC 4258 is from Miyoshi et al. (1995), while its PAj is from Menezes et al. (2018). Since the PAs in Greene et al. (2013) are approximated within 5°, we assumed each ΔPA to follow a Gaussian distribution with σΔPA = 2.5°5. Finally, for NGC 2273 and NGC 2960 both the PAmm and PAj measurements and their uncertainties are from Kamali et al. (2019). More specifically, the uncertainty on PAmm (PAj) for NGC 2273 is 4.6° (1°), while for NGC 2960 the uncertainty of PAmm (PAj) is 0.7° (2°). The uncertainties on ΔPA were then computed under the assumption that the measurements of PAmm and PAj were uncorrelated, by adding in quadrature the uncertainties on the two measured angles.
AGN host galaxy names, jet position angles, megamaser position angles, and jet–megamaser projected misalignments used in our analysis.
2.2. Models
In order to gauge whether a partial 3D alignment between the jets and megamaser angular momenta is statistically preferred over isotropic relative orientations, we built mock distributions of ΔPA. For the isotropic case we fixed the direction of the normal to the megamaser disk ( ) to be the z direction, and drew the direction of the MBH jet from a uniform distribution on the sphere (i.e., with a constant probability density p for the azimuthal angle and p ∝ sin(θ) for the polar angle). For each jet–megamaser realization we extracted two directions for the line of sight (LoS,
  ), one isotropically distributed (ISO–ISO model, where the first and the second ISO refer to
  and
and  , respectively), and the other with θ = 90° and a random azimuth (ISO–EO model, where EO refers to the former, which is edge-on). The second distribution is expected to model the observed AGN more closely as the megamaser disk is close to edge-on. For this reason we consider as reference models those in which the megamaser is observed edge-on. However, since the
  is not required to be exactly perpendicular to
  , the two ISO–ISO and ISO–EO scenarios bracket the impact of the megamaser plane inclination uncertainty.
In the competing scenario, we assumed the same probability distributions for  and
and  , but limited the polar angle of the jet (
 , i.e., the angle between the megamaser disk normal and the jet axis) to be smaller than a limiting angle Θmax that varies between 1° and 180° with a step of 1°, resulting in 180 A–ISO models (in which the LoS is isotropically sampled) and 180 A–EO models. Each model (regardless of the assumptions on the jet and LoS distributions) has been sampled with ns = 105 jet–megamaser LoS realizations to minimize the impact of statistical fluctuations. In Fig. 2 we show the distribution of ΔPA in the observed sample together with ten mock distributions of ΔPA (normalized to the number of observed systems) for equally spaced values of Θmax in the A–ISO case (the mock model-dependent histograms were renormalized to the number of total systems in the observed sample). We note that Θmax = 180° corresponds to the ISO–ISO scenario as well. A summary of the schematic models is available in Table 3.
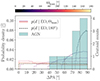 |
Fig. 2. Population distributions and measurements of misalignment in the plane of the sky between the megamaser disk projected semi-major axes and the jet direction (ΔPA). The teal histogram refers to centroid counts from observed data in Greene et al. (2013). The statistical analysis is performed approximating a truncated normal distribution each ΔPA observation, as described in Sect. 2.3. The colored lines denote population distributions for a few choices of Θmax, for the edge-on model. For reference, the dashed black line denotes the Θmax = 180° model. An absence of measurements below ∼40° constrain the population posterior in Fig. 3 to be above 41° at 95% confidence. Similarly, the majority of observations corresponding to ΔPA ≳70° constrain the posterior below 68° at 95% confidence. |
Summary of models.
2.3. Statistical analysis
We now focus on connecting the predictions in Sect. 2.2 to the observations in Sect. 2.1 through a Bayesian formalism. More precisely, our aim is to infer the population distribution of ΔPA from a sample of uncertain observations, described by a set of NAGN posterior distributions obtained from the data: {p(ΔPA ∣ di)}i = 1NAGN. For brevity, we refer to the set of NAGN data as d = {di}i = 1NAGN. This is a hierarchical inference problem. The family of models we explore is the Cartesian product of (i) a discrete two-element model for  (with equal prior probability) parameterized by Ψ = ISO, EO with (ii) a continuous family of models for the angular distribution of the jet,
  , parameterized by Θmax. In particular, we denote with “ISO” the model with cosΘmax = −1 and with “A” any other choice of Θmax. The resulting family of models is summarized in Table 3. We set priors on the A- and ISO- models as follows: in the partially aligned cases, the prior for Θmax is weighted proportionally to the solid angle within which the realizations of the jet directions are sampled. Including the normalization, the prior distribution reads
We chose this scaling simply because the possible three-dimensional configurations of the jet scale as the solid angle defined by Θmax. Since our choice tends to favor large values of Θmax (compared to, e.g., a flat prior), we consider it a conservative choice when searching for a possible partial alignment between jets and megamasers.
On the other hand, models with isotropically distributed jet directions assume Θmax = π, that is a prior ΠISO(Θmax) = δ(Θmax − π), where δ denotes the Dirac delta distribution. The evidence of each model is evaluated by numerically integrating the product of the prior and the likelihood over the prior support
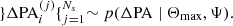
For the ISO–ISO and ISO–EO models (i.e., for the models in which Θmax has a fixed value of 180°) the evidence corresponds to the likelihood of the model, which, in turn, is equal to the likelihood of the partially aligned case with Θmax = π.
As discussed in Sect. 2.1, we approximate the posteriors on ΔPA from individual and independent data di as univariate normal distributions of known mean and fixed standard deviations,

suitably truncated and normalized over the physical range [0°,90°]. We connect the likelihood of a given population model (conditioned on given values of Θmax, Ψ) to the independent uncertain observations using Bayes’ theorem and the probability chain rule as follows:
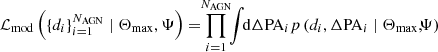
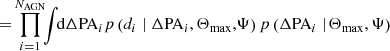
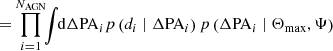
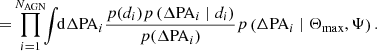
Individual likelihoods are completely specified by the values of ΔPA, so we drop the conditions Θmax, Ψ in Eq. (6). The formalism in Eq. (7) allows for distinct priors on individual measurements, though in this work we assume identical priors across all measurements. In the Bayesian context, the knowledge acquired about individual measurement ΔPAi, after some data di are observed (e.g., radio maps), is often represented through posterior samples drawn from p(ΔPAi ∣ di), while population models are known analytically. In this work we tackle the opposite scenario: measurement posteriors are approximated analytically, while population models are available only through samples:
Therefore, for each Θmax, we approximate the NAGN integrals of the likelihood in Eq. (7) via a Monte Carlo estimation as
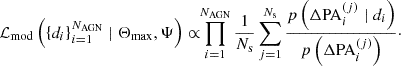
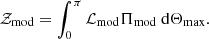
The statistical preference of a model with respect to another is quantified by the ratio of their evidence, that is the Bayes factor K. Therefore, evaluating the likelihood in Eq. (9) up to a normalization constant  suffices for our objective.
In the case of our (reference) EO models, the Bayes factor for the model in which the jets partially align with the megamaser angular momentum (A–EO) and the model in which they do not (ISO–EO) is
indicating a strong preference for the partially aligned model. The preference remains strong even in the case in which the LoS is sampled independently of the orientation of the megamaser disk (ISO–ISO and A–ISO models), yielding a Bayes factor of KISO = 𝒵A − ISO/𝒵ISO − ISO≈ 12.6.
Our analysis indicates a clear statistical preference for the partially aligned case, as concluded in Greene et al. (2013) as well. For this reason we further extend our analysis by deriving the posterior distribution of Θmax for the A–EO model:
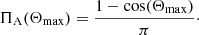
The resulting posterior is shown in Fig. 3. The posterior excludes at very high confidence Θmax = 180°, with a median-centered 90% confidence interval  , respectively. For reference, the thin dotted black line in Fig. 3 denotes the prior: the inference is clearly dominated by the population likelihood except for a small increase close to the upper domain boundary.
 |
Fig. 3. Posteriors and Bayes factors on the partial alignment angle models. (Left panel) Population posteriors for the models presented in Sect. 2.2. The black solid (black dashed) line denotes the distribution of the partial alignment angle Θmax, obtained by applying the hierarchical inference scheme in Sect. 2.3 to the EO (ISO) model. The vertical dashed gray line (solid gray lines) denotes the posterior median (90% credible interval) on Θmax. The dotted line shows the prior distribution assumed for Θmax, which has a small effect on the high-Θmax tail of the mean posterior, but is negligible for its posterior median and credible interval. The teal (orange) solid lines are posteriors on EO-Θmax (ISO-Θmax) obtained from the 300 resampled realizations of each measurement uncertainty described in Sect. 2.3. (Right panels) Bayes factors for the partially aligned vs. isotropic jet distribution model. The top (bottom) subpanel correspond to the edge-on (isotropic) LoS case. Histograms denote the distribution of Bayes factors obtained from resampled measurement error realizations. The teal (orange) dash-dotted lines denote the corresponding median and 90% credible interval. The solid (dashed) black line in the top (bottom) subpanel denotes the Bayes factor reported in the main text, KEO = 19.1 (KISO = 12.6), and obtained from the original measurement errors. |
The posterior of the A–ISO model peaks at  . The higher Bayes factor for isotropically distributed
  (compared to the edge-on case) and the Θmax, A − EO > Θmax, A − ISO inequality are both expected. Models with megamasers observed edge-on exhibit ΔPA necessarily smaller than the three-dimensional angle between the jet and the megamaser. Therefore, ΔPA < Θmax. A distribution of ΔPA limited within a given angle can therefore be produced by a broader (i.e., less aligned) distribution of
  and
and  , resulting in larger Θmax, A − EO. A partially aligned model in which
  (A–ISO model) can instead result in large ΔPA even if
  and
and  are closely aligned. For instance, if the two vectors are aligned within a few degrees, but the megamaser (or, equivalently, the jet) is even more aligned with the LoS, ΔPA can be arbitrarily large, and its distribution tends toward being flat for
  . A–ISO models can therefore result in distributions of ΔPA limited within a given angle, even if Θmax, A − EO is smaller than the value needed in the corresponding A–EO model, resulting in smaller Θmax, A − ISO.
We note that our results depend on the assumed measurements errors on PAmm and PAj. Since most of the uncertainties were not presented in the original observational papers (see Sect. 2.1), we quantified whether underestimated or overestimated uncertainties could severely affect our findings. We therefore performed the same analysis on a sample of 300 synthetic datasets, keeping the same estimates of PAs, while drawing each measurement error from a uniform distribution between one-half and two times the assumed uncertainty. The analysis performed on the 300 realizations yields results that are largely compatible with our original conclusions, with Bayes factors ranging at 90% confidence in the intervals  and
and 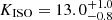 .
.
In order to further prove the robustness of our results, we ran an alternative test in which we compared the number of AGN observed in fixed bins of ΔPA (nΔPA) with the corresponding expected number of AGN (λΔPA) for each model and each ΔPA. The bin size was arbitrarily chosen to be 10°, as in Greene et al. (2013). In this case the prior is the same as in the previous analysis, while the likelihood ℒ of each model is estimated assuming a Poissonian probability distribution,
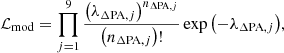
where “mod” can stand for ISO–ISO, A–ISO, ISO–EO, or A–EO, and nΔPA, j (λΔPA, j) denotes the bin count (distribution parameter) of the j-th bin.
In order to constrain the effect of the uncertainty on the measured PAs of the jets and megamasers, we re-sampled the observed data nbs = 4 × 10⁴ times, assuming that each PA follows a Gaussian probability distribution centered at the observed value quoted in Table 2 and with a σΔPA equal to the 2.5° uncertainty previously assumed. Since the number of bins in the likelihood analysis is limited to nine, the chosen value of nbs is large enough to cover all the possible outcomes and to constrain the average Bayes factors and their uncertainties. The median Bayes factor for models with edge-on megamaser disks on the resampled data is KEO − bs ≈ 19.7, and is greater than 4.7 (12.6) at 90% (85%) confidence. We note that the lower bound at 90% is driven by NGC3079: upon resampling, it contributes to the ΔPA bins below 40°, thus reducing the evidence for partially aligned models. Similarly the median ratio for the models with isotropically distributed LoS is KISO − bs ≈ 12.6 (with the ratio being greater than 7.7 (8.4) at 90% (85%) confidence) in good agreement with the first analysis, which is not affected by the arbitrary choice of the ΔPA bin size. The posterior distributions for the partially aligned cases are consistent with those obtained with the first analysis presented.
While a partial alignment between the jets and the megamaser is statistically preferred, our analysis indicates that, once projection effects are included, the degree of alignment in three-dimensions can be lower than what is shown by two-dimensional projections of the two structures on the plane of the sky. The angle between the jet and the normal to the megamaser in the plane of the sky (=90° −ΔPA) is limited to ≈30° for all but one of the systems in our observed sample6, in agreement with the analysis on a four-AGN sample (two of which were not present in the Greene et al. 2013 sample) by Kamali et al. (2019), who found a maximum misalignment of 32°. The maximum three-dimensional misalignment angle Θmax is somewhat larger, in particular when the information about the close-to-edge-on orientation of the megamaser is taken into account (Θmax, A − EO ≲ 68° within the 90% confidence interval).
3. Possible astrophysical origins of the observed alignment
The observed partial alignment between the parsec-scale Keplerian disk and the MBH spin (under the assumption that the jet traces the direction of the spin) requires a physical interpretation.
The Kerr metric of the MBH may modify the accretion disk plane, possibly inducing a warp (i.e., the direction of the disk angular momentum changes with radius inside the disk). The disk warping is a direct result of the frame-dragging Lense–Thirring (LT, Lense & Thirring 1918) effect on orbits whose angular momentum is misaligned with respect to the MBH spin. The different precession rates of the disk annuli coupled with the disk viscosity, which drives an inward radial drift, also causes a twist in the disk. This results in a nonzero torque component in the disk orbital plane, but perpendicular to the line of nodes that tends to align (or anti-align) with the MBH spin of the angular momentum of the fluid elements within the disk. This is known as the Bardeen–Petterson effect (Bardeen & Petterson 1975). There are two distinct regimes where the warp disturbance can propagate in the disk depending on the ratio of the viscosity parameter of the disk, α, and its aspect ratio H/R (Papaloizou & Pringle 1983): the diffusive and the bending-waves regime (Lubow et al. 2002; Lodato & Pringle 2007; Nixon & King 2016; Martin et al. 2019). In the former (α > H/R), viscosity acts to dissipate the warp, therefore aligning the disk angular momentum to the spin out to a characteristic radius Rwarp before the warp can propagate throughout the disk. Instead, in the latter (α < H/R) the sound speed inside the disk is high enough so that the warp propagation occurs much more rapidly than the viscous alignment. In this case, the warp reflects at the disk boundaries; the disk eventually reaches a warped configuration and starts precessing as a rigid body around the MBH spin.
Therefore, one could, in principle, naively explain the very large observed ΔPAs (i.e., the close alignment between jets and megamasers) as a consequence of the disk alignment or counter alignment with the MBH spin. However, in the diffusive regime, Rwarp is limited by the LT precession timescale. LT precession is indeed appreciable out to ∼1000 gravitational radii (∼5 × 10⁻⁵ pc for a 106 M⊙ MBH, much smaller scales than those probed by megamasers; see, e.g., Perego et al. 2009), while the timescale for LT precession becomes longer than a Hubble time at parsec scales. In the bending-wave regime, on the other hand, the sound speed required for a solid body precession of a whole disk extending up to parsec scales would be unphysically high and, even in this case, the steady-state wave-like warp at large distances is not expected to be aligned with the MBH spin as the alignment timescale would again be much longer than a Hubble time (Bate et al. 2000).
For the reasons above, we need to find an alternative explanation for the observed distribution of ΔPA instead of relying on the Bardeen–Petterson effect. The first possibility is that instead of the MBH spin aligning the outer radii of the accretion disk, it is the outer accretion disk that aligns the MBH spin with its angular momentum vector. The disk outer parts, misaligned with the MBH spin, supply material to the inner parts through the warp radius. As the inner parts of the disk quickly align with the MBH spin, if the accretion proceeds with a close-to-constant direction of the (outer) angular momentum for long enough (i.e., accreting ≳1% of the initial MBH mass), the spin of the MBH can move toward alignment with the global angular momentum of the accretion reservoir (e.g., Perego et al. 2009).
It is important to note that if the energy of the jet is extracted from the MBH rotation energy, MBHs with higher spins are expected to be jetted more often, and their jets to be more luminous (Blandford & Znajek 1977). As a consequence, our sample of jetted systems might be biased toward higher spins, achieved through prolonged gas accretion with some degree of alignment of the net angular momentum (i.e., far from the chaotic accretion regime with a close-to-isotropic rain of small gas clouds). Such an anisotropic feeding would automatically result in a partial alignment between the megamaser at parsec scales and the MBH spin (Dotti et al. 2013). This explanation for the observed (partial) alignment has two shortcomings. On the one hand, it requires some degree of fine-tuning in the orientation of the fueling events, possibly (see the discussion in the next section) in tension with the reduced evidence of alignment between the megamasers (or jets) and larger scale (∼0.1–10 kpc) structures observed in the Greene et al. (2013) sample7. The second shortcoming is that it is unclear if large initial misalignments between the outer accretion disk and the MBH spin would ever eventually result in partial alignment (e.g., Ogilvie 1999, see the discussion below).
A second possibility is represented by selective accretion, which is the triggering of accretion events only when the large-scale gas inflow is aligned (or counter-aligned) with the MBH spin, while other feeding processes with an inclination of angular momentum with respect to the MBH spin direction closer to 90° are choked on timescales short enough to become irrelevant for the MBH evolution and statistically hard to observe. Two physical processes could be responsible for selective accretion. On the one hand, the nonlinear dynamical analysis of warped viscous disks discussed by Ogilvie (1999) indicates that, for sufficiently large warps (i.e., large misalignment) the viscous torque component responsible for the gas inflow reverses its sign, breaking the accretion disk in independently precessing regions, potentially stopping accretion. However, we note that this accretion quenching is not observed in numerical simulations. Disk breaking was first investigated with purely hydrodynamical simulations by Nixon et al. (2012), who found continuous and rapid accretion as a consequence of the angular momentum cancellation between independently precessing detached-disk annuli. The dynamics of a disk subject to LT precession was further investigated with MHD simulations, where the angular momentum transport was not modeled with a simple viscosity parameterization (Sorathia et al. 2013a,b; Liska et al. 2019). They showed that thin accretion disks, initially strongly misaligned with the MBH spins, lead to prolonged, though modulated, accretion over multiple disk breaking episodes (Liska et al. 2021).
Selective accretion could, however, also be enforced by the small-scale radiative feedback self-generated by the accretion process. The angular radiation pattern emitted from the innermost regions of the accretion disk (well within the warp radius and perpendicular to the MBH spin) is always negligible in the MBH equatorial plane, while it peaks in the spin directions for small spins or at some intermediate inclinations for higher values of a (e.g., Campitiello et al. 2018). In a scenario where the angular momentum of the inflowing material is close to either alignment or counteralignment with the MBH spin, a small fraction of the emitted luminosity would impact on the accreting material, limiting the effect of feedback on the gas reservoir at (sub)parsec scales. If the inflowing material has some significant misalignment with the MBH spin, as soon as an intense accretion event starts, the outer regions of the accretion disk would be hit by a strong feedback that could eject the remaining gas quenching the accretion event. The threshold in terms of misalignment angle and accretion rate to trigger such feedback-driven selective accretion will depend on the value of the spin parameter. In this respect, it is worth noting that the most probable value of Θmax (≲50°) found in our analysis is comparable to the inclination required to maximize the irradiation of the outer disk for an anisotropic, spin-dependent, radiation pattern emitted by the most central part of the accretion disk8 for a spin magnitude of a ≈ 0.9 (Campitiello et al. 2018). An in-depth analysis of this process is left for future investigation.
4. Implications of the observed alignment and future prospects
Our study quantified the statistical evidence for a significant degree of three-dimensional alignment between the direction of the jet propagation ( ) and that of the angular momentum of 0.1–1 pc-scale megamaser disks (
 ). In our reference model, where the megamaser disk plane is realistically assumed to be observed edge-on, the angle between
  and
and  is constrained to be smaller than
  at 90% confidence. Relaxing the assumption of edge-on megamaser disks, the degree of alignment is even higher (at the same confidence level
 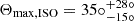 ). This further demonstrates the solidity of our findings.
Under the assumption that  traces the direction of the central MBH spin, our analysis opens the exciting possibility to link the properties of the accretion process at parsec scales with the proximity of the MBH horizon (≲10−5 pc, for the systems considered in this study). This link informs us about the MBH fueling process and/or the effect of accretion feedback. The partial alignment between nuclear and parsec-scale structures may be due to a preferred angular-momentum direction of the gas feeding MBHs in rotationally dominated structures (as assumed by Sesana et al. 2014, to reproduce the observed distribution of MBH spins). In this case, the alignment has profound implications on the whole MBH population. Such ordered accretion would imply high spins (and high radiative efficiencies), in agreement with the currently available constraints (see, e.g., Brenneman 2013; Reynolds 2013, 2021). Such prediction could be independently tested by the future Laser Interferometer Space Antenna (e.g., LISA Amaro-Seoane et al. 2017, 2023), sensible to the masses of the MBHs in the sample analyzed (∼107 M⊙, Greene et al. 2010), either through the modeling of extreme-mass-ratio inspirals or, if the same dynamics of the MBH feeding holds at higher redshift during galaxy mergers, analyzing MBH-MBH coalescences9.
It is possible, however, that the sample studied is not representative of the MBH population in its mass and redshift range. It should be noted that the galaxy sample we analyzed is only made up of disk galaxies, typically in galaxy groups, and does not include very small galaxies, hosting MBHs lighter than < 106 M⊙, or very massive ones, for example massive ellipticals in galaxy clusters. Further studies are needed to test the observed partial-alignment trend against a broader range of galaxy masses and morphologies. Furthermore, as commented in the previous section, the presence of a jet (required for the estimate of the alignment degree in current analysis) could be associated with high spins that would select MBHs growing and spinning up to somewhat coherent accretion. In this case, the observed partial alignment would have less significant implications on the more general population of MBHs, but would provide new strong observational support to the spin-paradigm for jet formation (e.g., Wilson & Colbert 1995; Tchekhovskoy et al. 2010, and references therein), in which jets are powered by the rotational energy of the MBH through the Blandford–Znajek effect (Blandford & Znajek 1977) and the spin determines whether an AGN would be radio-loud (i.e., jetted) or radio-quiet10.
A third possible explanation proposed here for the first time is represented by selective accretion. In this scenario, only accretion disks that are sufficiently aligned (or anti-aligned) with respect to the MBH spin result in long-lived accretion. This could (i) contribute to the limited AGN duty cycles observed as a sizable fraction of inflow episodes could not result in an observable AGN, or (ii) modify the MBH spin evolution predicted in current models, requiring the implementation of selective accretion prescriptions in models used to reproduce the observed spin distributions, as in Sesana et al. (2014). Finally, selective accretion could exacerbate the problem of growing the heaviest MBH at high redshifts (z > 6), hinting at the occurrence of significant super-Eddington accretion events (e.g., Madau et al. 2014; Volonteri et al. 2015).
The biggest limitation of our analysis is represented by the limited size of the AGN sample available11. The requirement of observing both a jet and a megamaser limits the number of systems of interest to about ten (Greene et al. 2013; Kamali et al. 2019). Increasing the sample of AGN with tracers of horizon and > 0.1 pc (up to kiloparsec) scales is therefore a priority. Due to the enhanced sensitivity of upcoming radio facilities, such as the ngVLA, the SKA–Mid (for the 22 GHz water maser), or the DSA-2000 (for hydroxyl masers; see Hallinan et al. 2019), targeted searches of extremely large samples of galaxies and blind searches in areas on the order of one square degree or more (particularly profitable when approaching cosmological distances) are foreseen to provide the detection of many more water or hydroxyl megamaser sources (Tarchi et al. 2020, 2023). In particular, from dozens of new megamaser sources up to a few hundred are expected to be detectable, both locally and up to z ∼ 3, especially if, as indicated in the literature, the water maser luminosity function evolves with redshift. The expected number of detected megamasers also strongly depends on the area covered by searches, and on the width of the redshift ranges probed (Ladu et al. 2024; Tarchi et al. 2024, and Tarchi et al. in prep.).
The statistical analysis discussed in Sect. 2.3 can be used to constrain the degree of alignment of other small (MBH horizon) and large-scale (≳ pc) galactic substructure pairs. The simplest possibility explored in the literature is to study the ΔPA between jets and the host galaxies as a whole. Different studies reached different conclusions, spanning from a complete lack of alignment to clear evidence of partial alignment (see Sect. 4 in Dotti et al. 2013, for an historical overview). As the size and the purity of the analyzed samples increases (by removing the contaminating radio emission from star-forming regions), a clearer tendency toward partial alignment seems to emerge (see, e.g., Battye & Browne 2009; Zheng et al. 2024, and references therein), in agreement with the theoretical predictions from cosmological simulations following the evolution of MBH spins (Dubois et al. 2014; Peirani et al. 2024). We note, however, that the minor axes of the host galaxies constrained by photometry alone might not be directly correlated with a preferential angular momentum of the inflows feeding the MBH growth, in particular for dynamically hot structures such as massive ellipticals (see the discussions in Battye & Browne 2009; Dotti et al. 2013).
Additionally, circumnuclear structures of ∼0.1–1 kpc in size can be used as large-scale tracers, including stellar structures (as done in Greene et al. 2013, who found a lack of a statistical preference for a partial alignment between megamaser and circumnuclear disks) and including cold molecular gas disks that, being dynamically colder, can more easily and more accurately trace the angular momentum direction of the large scale gas reservoir (see, e.g., Ruffa et al. 2019, who found a close alignment between jets and circumnuclear disks in four out of six systems).
Adding the observational constraints on the jet and galactic structure inclinations with respect to the line of sight could further improve the analysis. Evaluating the inclination of the jet is unfortunately not straightforward (see discussion in Boschini et al. 2024, and references therein). Ruffa et al. (2020) presented the first analysis of the 3D relative orientation between jets and circumnuclear disks on a sample of six AGN. Interestingly, the inclusion of the inclinations of jets and circumnuclear disks with respect to the line of sight demonstrated that the largest misalignment on the plane of the sky observed in Ruffa et al. (2019)12 was a consequence of the projection effect, and that all the jet–circumnuclear disk pairs have a relative misalignment ≲60°, similar to the value of Θmax, EO found in the reference case of our investigation.
Finally, the relative three-dimensional inclination between horizon and > 0.1 pc scales can be constrained from their inclinations with respect to the line of sight only, even without information about their PA. In this case, the sample of useful AGN can be further increased. The subparsec inclinations could be estimated most directly from the modeling of spatially resolved broad-line regions (e.g., GRAVITY Collaboration 2018; Abuter et al. 2024, in which case an estimate of the PA would also be available), or through reverberation-mapping of optical-UV broad lines (e.g., Blandford & McKee 1982; Peterson 1993), or even through the fitting of single-epoch UV, optical, and IR spectra (e.g., Storchi-Bergmann et al. 2003; Pancoast et al. 2014; Horne et al. 2021). While this last option would be affected by significantly larger uncertainties (and each AGN would set significantly weaker constraints on its horizon-to-subparsec scale relative orientation), it would increase the number of AGN by orders of magnitude, with an estimate of the inclination of the subparsec gas distribution.
At horizon scales one possibility is to use the inclination of the innermost accretion disk, constrained from the modeling of broad-band X-ray spectra (e.g., Du et al. 2024). In this case even the relative inclination dependence on the spin magnitude could be constrained for a subsample of systems (but see Parker et al. 2022, for a discussion of the possible difficulties in estimating both inclinations and spins). Using these constraints on the innermost accretion disk inclination (independent of the jet existence), we could test whether the observed partial alignment between small and large scales is affected by a selection effect or not.
We applied our analysis to the ΔPA between megamaser-circumnuclear disks presented in Greene et al. (2013), confirming that there is no strong statistical evidence of partial alignment (with an average Bayes factor of a few). A larger sample is needed to allow for any deeper insight on the nuclear-to-galactic relative orientation.
In the case of MBH-MBH coalescences, accretion triggered by the galaxy merger could, in principle, result in different feeding properties with respect to isolated MBHs, possibly biasing the population of binary coalescences observed by LISA (e.g., Bogdanović et al. 2007; Dotti et al. 2010).
MBH spins might not be the only parameter playing a role in the production of strong jets. It has been proposed that the galaxy mass and the local environment might play a role, with the most massive galaxies in rich galaxy clusters being more prone to jet emission (see, e.g., Sabater et al. 2019). We recall, however, that our sample does not include massive galaxies or massive MBHs (see Table 1).
Acknowledgments
The authors thank the anonymous referee for the insightful suggestions and the thorough review. The authors thank Paraskevi (Vivi) Tsalmantza, Margherita Giustini, Giuseppe Lodato, Andrea Merloni, Andrea Tarchi and Eric Murphy for sharing their invaluable insight. MD acknowledge funding from MIUR under the grant PRIN 2017-MB8AEZ and support from ICSC – Centro Nazionale di Ricerca in High Performance Computing, Big Data and Quantum Computing, funded by European Union – NextGenerationEU. RB acknowledges support through the Italian Space Agency grant Phase A activity for LISA mission, Agreement n. 2017-29-H.0, and CINECA HPC computing support through an ISCRA initiative grant. This study is supported by the Italian Ministry for Research and University (MUR) under Grant ‘Progetto Dipartimenti di Eccellenza 2023-2027’ (BiCoQ). AF acknowledges support provided by the “GW-learn” grant agreement CRSII5 213497.
References
- Abuter, R., Allouche, F., Amorim, A., et al. 2024, ArXiv e-prints [arXiv:2401.14567] [Google Scholar]
- Amaro-Seoane, P., Audley, H., Babak, S., et al. 2017, ArXiv e-prints [arXiv:1702.00786] [Google Scholar]
- Amaro-Seoane, P., Andrews, J., Arca Sedda, M., et al. 2023, Liv. Rev. Relat., 26, 2 [NASA ADS] [CrossRef] [Google Scholar]
- Barausse, E. 2012, MNRAS, 423, 2533 [NASA ADS] [CrossRef] [Google Scholar]
- Bardeen, J. M. 1970, Nature, 226, 64 [Google Scholar]
- Bardeen, J. M., & Petterson, J. A. 1975, ApJ, 195, L65 [Google Scholar]
- Bate, M. R., Bonnell, I. A., Clarke, C. J., et al. 2000, MNRAS, 317, 773 [NASA ADS] [CrossRef] [Google Scholar]
- Battye, R. A., & Browne, I. W. A. 2009, MNRAS, 399, 1888 [CrossRef] [Google Scholar]
- Berti, E., & Volonteri, M. 2008, ApJ, 684, 822 [NASA ADS] [CrossRef] [Google Scholar]
- Blandford, R. D., & McKee, C. F. 1982, ApJ, 255, 419 [Google Scholar]
- Blandford, R. D., & Znajek, R. L. 1977, MNRAS, 179, 433 [NASA ADS] [CrossRef] [Google Scholar]
- Bogdanović, T., Reynolds, C. S., & Miller, M. C. 2007, ApJ, 661, L147 [CrossRef] [Google Scholar]
- Boschini, M., Gerosa, D., Sharan Salafia, O., & Dotti, M. 2024, A&A, 686, A245 [NASA ADS] [CrossRef] [EDP Sciences] [Google Scholar]
- Brenneman, L. 2013, Measuring the Angular Momentum of Supermassive Black Holes (Springer) [CrossRef] [Google Scholar]
- Campitiello, S., Ghisellini, G., Sbarrato, T., & Calderone, G. 2018, A&A, 612, A59 [NASA ADS] [CrossRef] [EDP Sciences] [Google Scholar]
- Cavaliere, A., Morrison, P., & Wood, K. 1971, ApJ, 170, 223 [NASA ADS] [CrossRef] [Google Scholar]
- Combes, F. 2003, ASP Conf. Ser., 290, 411 [NASA ADS] [Google Scholar]
- Dotti, M., Volonteri, M., Perego, A., et al. 2010, MNRAS, 402, 682 [NASA ADS] [CrossRef] [Google Scholar]
- Dotti, M., Colpi, M., Pallini, S., Perego, A., & Volonteri, M. 2013, ApJ, 762, 68 [NASA ADS] [CrossRef] [Google Scholar]
- Du, R., Ding, Y., Ho, L. C., & Li, R. 2024, ArXiv e-prints [arXiv:2401.16665] [Google Scholar]
- Dubois, Y., Volonteri, M., & Silk, J. 2014, MNRAS, 440, 1590 [Google Scholar]
- Fanidakis, N., Baugh, C. M., Benson, A. J., et al. 2011, MNRAS, 410, 53 [NASA ADS] [CrossRef] [Google Scholar]
- Gallimore, J. F., & Impellizzeri, C. M. V. 2023, ApJ, 951, 109 [NASA ADS] [CrossRef] [Google Scholar]
- GRAVITY Collaboration (Sturm, E., et al.) 2018, Nature, 563, 657 [Google Scholar]
- Greene, J. E., Peng, C. Y., Kim, M., et al. 2010, ApJ, 721, 26 [NASA ADS] [CrossRef] [Google Scholar]
- Greene, J. E., Seth, A., den Brok, M., et al. 2013, ApJ, 771, 121 [NASA ADS] [CrossRef] [Google Scholar]
- Greenhill, L. J., Booth, R. S., Ellingsen, S. P., et al. 2003, ApJ, 590, 162 [NASA ADS] [CrossRef] [Google Scholar]
- Hallinan, G., Ravi, V., Weinreb, S., et al. 2019, BAAS, 51, 255 [NASA ADS] [Google Scholar]
- Horne, K., De Rosa, G., Peterson, B. M., et al. 2021, ApJ, 907, 76 [Google Scholar]
- Humphreys, E. M. L., Reid, M. J., Moran, J. M., Greenhill, L. J., & Argon, A. L. 2013, ApJ, 775, 13 [Google Scholar]
- Izquierdo-Villalba, D., Bonoli, S., Dotti, M., et al. 2020, MNRAS, 495, 4681 [NASA ADS] [CrossRef] [Google Scholar]
- Kamali, F., Henkel, C., Koyama, S., et al. 2019, A&A, 624, A42 [NASA ADS] [CrossRef] [EDP Sciences] [Google Scholar]
- King, A. R., & Pringle, J. E. 2006, MNRAS, 373, L90 [NASA ADS] [CrossRef] [Google Scholar]
- Kondratko, P. T., Greenhill, L. J., & Moran, J. M. 2005, ApJ, 618, 618 [NASA ADS] [CrossRef] [Google Scholar]
- Ladu, E., Tarchi, A., Castangia, P., et al. 2024, A&A, 682, A25 [NASA ADS] [CrossRef] [EDP Sciences] [Google Scholar]
- Lense, J., & Thirring, H. 1918, Phys. Z., 19, 156 [Google Scholar]
- Liska, M., Tchekhovskoy, A., Ingram, A., & van der Klis, M. 2019, MNRAS, 487, 550 [CrossRef] [Google Scholar]
- Liska, M., Hesp, C., Tchekhovskoy, A., et al. 2021, MNRAS, 507, 983 [NASA ADS] [CrossRef] [Google Scholar]
- Lodato, G., & Pringle, J. E. 2007, MNRAS, 381, 1287 [Google Scholar]
- Lubow, S. H., Ogilvie, G. I., & Pringle, J. E. 2002, MNRAS, 337, 706 [NASA ADS] [CrossRef] [Google Scholar]
- Madau, P., Haardt, F., & Dotti, M. 2014, ApJ, 784, L38 [NASA ADS] [CrossRef] [Google Scholar]
- Martin, R. G., Lubow, S. H., Pringle, J. E., et al. 2019, ApJ, 875, 5 [NASA ADS] [CrossRef] [Google Scholar]
- Menezes, R. B., da Silva, P., & Steiner, J. E. 2018, MNRAS, 473, 2198 [NASA ADS] [CrossRef] [Google Scholar]
- Merloni, A., & Heinz, S. 2008, MNRAS, 388, 1011 [NASA ADS] [Google Scholar]
- Miyoshi, M., Moran, J., Herrnstein, J., et al. 1995, Nature, 373, 127 [NASA ADS] [CrossRef] [Google Scholar]
- Nixon, C., & King, A. 2016, Lect. Notes Phys., 905, 45 [NASA ADS] [CrossRef] [Google Scholar]
- Nixon, C., King, A., Price, D., & Frank, J. 2012, ApJ, 757, L24 [NASA ADS] [CrossRef] [Google Scholar]
- Ogilvie, G. I. 1999, MNRAS, 304, 557 [NASA ADS] [CrossRef] [Google Scholar]
- Pancoast, A., Brewer, B. J., Treu, T., et al. 2014, MNRAS, 445, 3073 [Google Scholar]
- Papaloizou, J. C. B., & Pringle, J. E. 1983, MNRAS, 202, 1181 [NASA ADS] [Google Scholar]
- Parker, M. L., Matzeu, G. A., Matthews, J. H., et al. 2022, MNRAS, 513, 551 [NASA ADS] [CrossRef] [Google Scholar]
- Peirani, S., Suto, Y., Beckmann, R. S., et al. 2024, A&A, 686, A233 [NASA ADS] [CrossRef] [EDP Sciences] [Google Scholar]
- Perego, A., Dotti, M., Colpi, M., & Volonteri, M. 2009, MNRAS, 399, 2249 [NASA ADS] [CrossRef] [Google Scholar]
- Peterson, B. M. 1993, PASP, 105, 247 [NASA ADS] [CrossRef] [Google Scholar]
- Reynolds, C. S. 2013, Class. Quant. Grav., 30, 244004 [NASA ADS] [CrossRef] [Google Scholar]
- Reynolds, C. S. 2021, ARA&A, 59, 117 [NASA ADS] [CrossRef] [Google Scholar]
- Ruffa, I., Prandoni, I., Laing, R. A., et al. 2019, MNRAS, 484, 4239 [NASA ADS] [CrossRef] [Google Scholar]
- Ruffa, I., Laing, R. A., Prandoni, I., et al. 2020, MNRAS, 499, 5719 [NASA ADS] [CrossRef] [Google Scholar]
- Sabater, J., Best, P. N., Hardcastle, M. J., et al. 2019, A&A, 622, A17 [NASA ADS] [CrossRef] [EDP Sciences] [Google Scholar]
- Sesana, A., Barausse, E., Dotti, M., & Rossi, E. M. 2014, ApJ, 794, 104 [NASA ADS] [CrossRef] [Google Scholar]
- Shankar, F., Weinberg, D. H., & Miralda-Escudé, J. 2013, MNRAS, 428, 421 [NASA ADS] [CrossRef] [Google Scholar]
- Soltan, A. 1982, MNRAS, 200, 115 [Google Scholar]
- Sorathia, K. A., Krolik, J. H., & Hawley, J. F. 2013a, ApJ, 777, 21 [NASA ADS] [CrossRef] [Google Scholar]
- Sorathia, K. A., Krolik, J. H., & Hawley, J. F. 2013b, ApJ, 768, 133 [NASA ADS] [CrossRef] [Google Scholar]
- Storchi-Bergmann, T., Nemmen da Silva, R., Eracleous, M., et al. 2003, ApJ, 598, 956 [NASA ADS] [CrossRef] [Google Scholar]
- Tarchi, A., Castangia, P., Surcis, G., et al. 2020, MNRAS, 492, 45 [NASA ADS] [CrossRef] [Google Scholar]
- Tarchi, A., Surcis, G., Castangia, P., Ladu, E., & Bannikova, E. Y. 2023, 15th European VLBI Network Mini-Symposium and Users’ Meeting, 36 [Google Scholar]
- Tarchi, A., Castangia, P., Surcis, G., Ladu, E., & Bannikova, E. Y. 2024, Proc. Int. Astron. Union, 380, 50 [NASA ADS] [Google Scholar]
- Tchekhovskoy, A., Narayan, R., & McKinney, J. C. 2010, ApJ, 711, 50 [NASA ADS] [CrossRef] [Google Scholar]
- Tully, R. B. 2015, AJ, 149, 171 [NASA ADS] [CrossRef] [Google Scholar]
- Volonteri, M., Silk, J., & Dubus, G. 2015, ApJ, 804, 148 [Google Scholar]
- Wilson, A. S., & Colbert, E. J. M. 1995, ApJ, 438, 62 [NASA ADS] [CrossRef] [Google Scholar]
- Yamauchi, A., Nakai, N., Sato, N., & Diamond, P. 2004, PASJ, 56, 605 [NASA ADS] [Google Scholar]
- Zheng, X., Zhang, Y., & Röttgering, H. 2024, A&A, 686, A169 [NASA ADS] [CrossRef] [EDP Sciences] [Google Scholar]
- Zibetti, S., Charlot, S., & Rix, H.-W. 2009, MNRAS, 400, 1181 [NASA ADS] [CrossRef] [Google Scholar]
All Tables
AGN host galaxy names, jet position angles, megamaser position angles, and jet–megamaser projected misalignments used in our analysis.
All Figures
|
Fig. 1. Illustration of a jet–megamaser disk system and its orientation with respect to the observer line of sight, as seen by projection angles. The jet direction (assumed to be aligned with the MBH spin |
| In the text | |
|
Fig. 2. Population distributions and measurements of misalignment in the plane of the sky between the megamaser disk projected semi-major axes and the jet direction (ΔPA). The teal histogram refers to centroid counts from observed data in Greene et al. (2013). The statistical analysis is performed approximating a truncated normal distribution each ΔPA observation, as described in Sect. 2.3. The colored lines denote population distributions for a few choices of Θmax, for the edge-on model. For reference, the dashed black line denotes the Θmax = 180° model. An absence of measurements below ∼40° constrain the population posterior in Fig. 3 to be above 41° at 95% confidence. Similarly, the majority of observations corresponding to ΔPA ≳70° constrain the posterior below 68° at 95% confidence. |
| In the text | |
|
Fig. 3. Posteriors and Bayes factors on the partial alignment angle models. (Left panel) Population posteriors for the models presented in Sect. 2.2. The black solid (black dashed) line denotes the distribution of the partial alignment angle Θmax, obtained by applying the hierarchical inference scheme in Sect. 2.3 to the EO (ISO) model. The vertical dashed gray line (solid gray lines) denotes the posterior median (90% credible interval) on Θmax. The dotted line shows the prior distribution assumed for Θmax, which has a small effect on the high-Θmax tail of the mean posterior, but is negligible for its posterior median and credible interval. The teal (orange) solid lines are posteriors on EO-Θmax (ISO-Θmax) obtained from the 300 resampled realizations of each measurement uncertainty described in Sect. 2.3. (Right panels) Bayes factors for the partially aligned vs. isotropic jet distribution model. The top (bottom) subpanel correspond to the edge-on (isotropic) LoS case. Histograms denote the distribution of Bayes factors obtained from resampled measurement error realizations. The teal (orange) dash-dotted lines denote the corresponding median and 90% credible interval. The solid (dashed) black line in the top (bottom) subpanel denotes the Bayes factor reported in the main text, KEO = 19.1 (KISO = 12.6), and obtained from the original measurement errors. |
| In the text | |
Current usage metrics show cumulative count of Article Views (full-text article views including HTML views, PDF and ePub downloads, according to the available data) and Abstracts Views on Vision4Press platform.
Data correspond to usage on the plateform after 2015. The current usage metrics is available 48-96 hours after online publication and is updated daily on week days.
Initial download of the metrics may take a while.