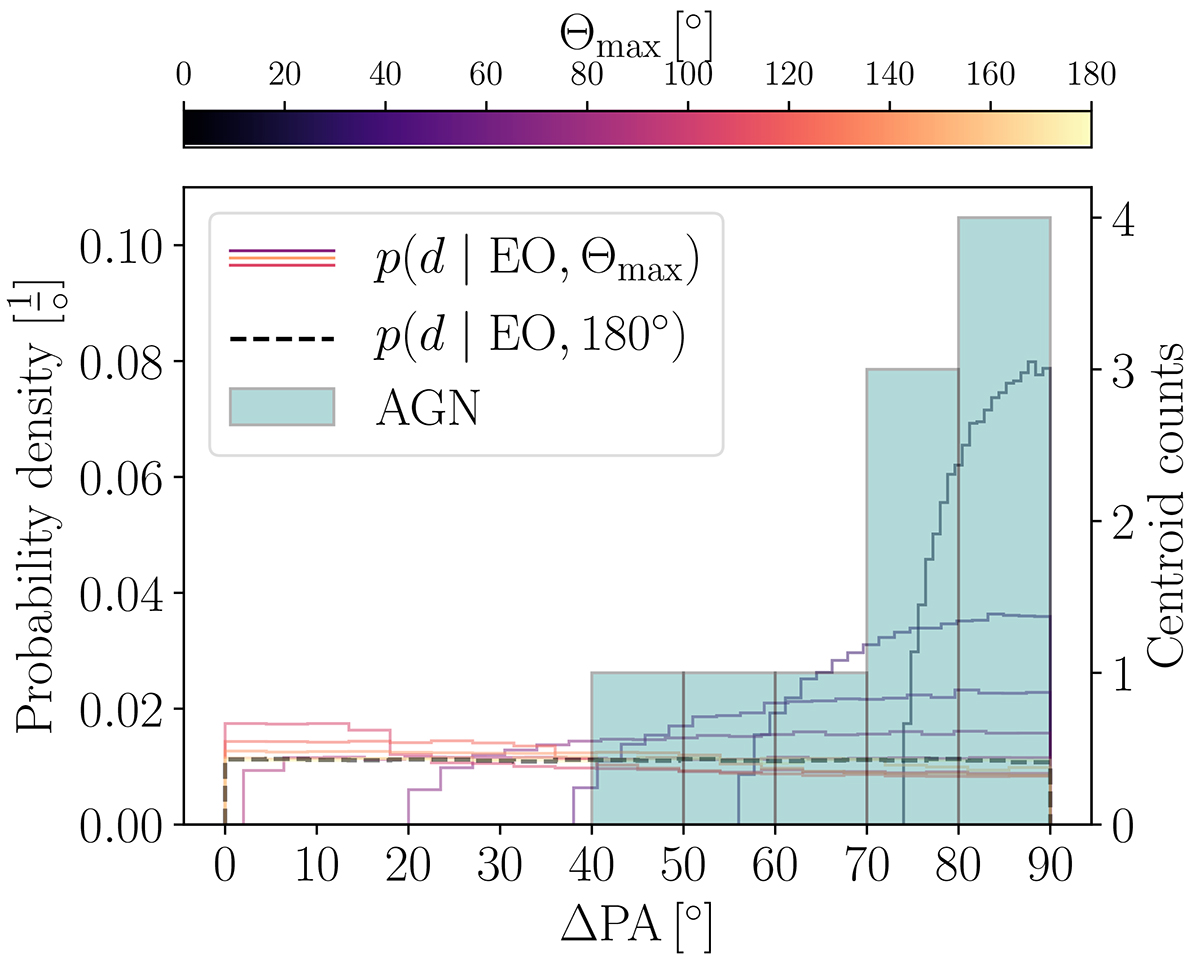
Fig. 2.
Download original image
Population distributions and measurements of misalignment in the plane of the sky between the megamaser disk projected semi-major axes and the jet direction (ΔPA). The teal histogram refers to centroid counts from observed data in Greene et al. (2013). The statistical analysis is performed approximating a truncated normal distribution each ΔPA observation, as described in Sect. 2.3. The colored lines denote population distributions for a few choices of Θmax, for the edge-on model. For reference, the dashed black line denotes the Θmax = 180° model. An absence of measurements below ∼40° constrain the population posterior in Fig. 3 to be above 41° at 95% confidence. Similarly, the majority of observations corresponding to ΔPA ≳70° constrain the posterior below 68° at 95% confidence.
Current usage metrics show cumulative count of Article Views (full-text article views including HTML views, PDF and ePub downloads, according to the available data) and Abstracts Views on Vision4Press platform.
Data correspond to usage on the plateform after 2015. The current usage metrics is available 48-96 hours after online publication and is updated daily on week days.
Initial download of the metrics may take a while.