Fig. 3.
Download original image
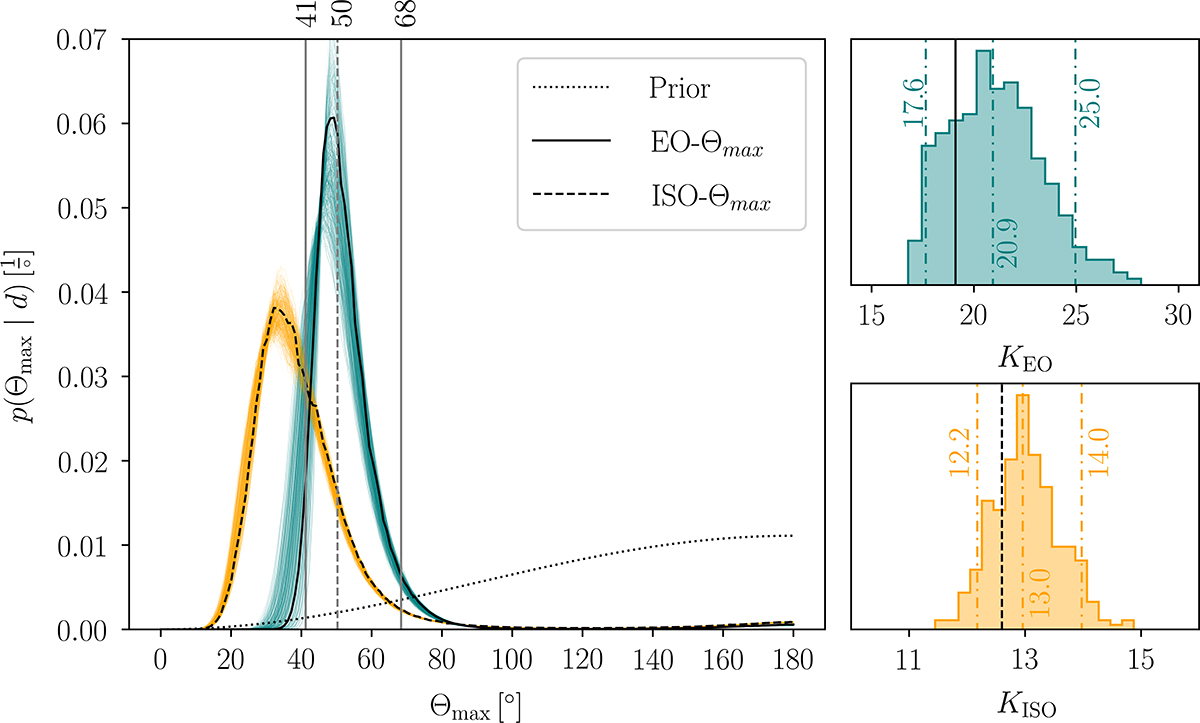
Posteriors and Bayes factors on the partial alignment angle models. (Left panel) Population posteriors for the models presented in Sect. 2.2. The black solid (black dashed) line denotes the distribution of the partial alignment angle Θmax, obtained by applying the hierarchical inference scheme in Sect. 2.3 to the EO (ISO) model. The vertical dashed gray line (solid gray lines) denotes the posterior median (90% credible interval) on Θmax. The dotted line shows the prior distribution assumed for Θmax, which has a small effect on the high-Θmax tail of the mean posterior, but is negligible for its posterior median and credible interval. The teal (orange) solid lines are posteriors on EO-Θmax (ISO-Θmax) obtained from the 300 resampled realizations of each measurement uncertainty described in Sect. 2.3. (Right panels) Bayes factors for the partially aligned vs. isotropic jet distribution model. The top (bottom) subpanel correspond to the edge-on (isotropic) LoS case. Histograms denote the distribution of Bayes factors obtained from resampled measurement error realizations. The teal (orange) dash-dotted lines denote the corresponding median and 90% credible interval. The solid (dashed) black line in the top (bottom) subpanel denotes the Bayes factor reported in the main text, KEO = 19.1 (KISO = 12.6), and obtained from the original measurement errors.
Current usage metrics show cumulative count of Article Views (full-text article views including HTML views, PDF and ePub downloads, according to the available data) and Abstracts Views on Vision4Press platform.
Data correspond to usage on the plateform after 2015. The current usage metrics is available 48-96 hours after online publication and is updated daily on week days.
Initial download of the metrics may take a while.