| Issue |
A&A
Volume 682, February 2024
|
|
|---|---|---|
| Article Number | L21 | |
| Number of page(s) | 7 | |
| Section | Letters to the Editor | |
| DOI | https://doi.org/10.1051/0004-6361/202449160 | |
| Published online | 23 February 2024 | |
Letter to the Editor
OGLE-GD-CEP-0516: The most metal-poor lithium-rich Galactic Cepheid⋆
1
INAF – Osservatorio Astrofisico di Catania, Via S.Sofia 78, 95123 Catania, Italy
e-mail: This email address is being protected from spambots. You need JavaScript enabled to view it.
2
INAF – Osservatorio Astronomico di Capodimonte, Salita Moiariello 16, 80131 Naples, Italy
e-mail: This email address is being protected from spambots. You need JavaScript enabled to view it.
3
Astrophysics Research Institute, Liverpool John Moores University, 146 Brownlow Hill, Liverpool L3 5RF, UK
e-mail: This email address is being protected from spambots. You need JavaScript enabled to view it.
4
INAF – Osservatorio Astronomico di Abruzzo, Via M. Maggini, s/n, 64100 Teramo, Italy
5
Leibniz-Institut für Astrophysik Potsdam (AIP), An der Sternwarte 16, 14482 Potsdam, Germany
6
Institut für Physik und Astronomie, Universität Potsdam, Haus 28, Karl-Liebknecht-Str. 24/25, 14476 Golm (Potsdam), Germany
Received:
4
January
2024
Accepted:
8
February
2024
Abstract
Context. Classical Cepheids (DCEPs) are important astrophysical objects not only as standard candles for the determination of the cosmic distance ladder but also as a test-bed for stellar evolution theory thanks to the connection between their pulsation (periods, amplitudes) and stellar (luminosity, mass, effective temperature, metallicity) parameters.
Aims. We aim to elucidate the nature of the Galactic DCEP OGLE-GD-CEP-0516 and other DCEPs showing an enhanced abundance of lithium in their atmospheres.
Methods. We collected high-resolution spectra for OGLE-GD-CEP-0516 with UVES at VLT. Accurate stellar parameters, such as effective temperature, gravity, micro- and macro-turbulence, radial velocity, and metal abundances, were measured for this star using spectral synthesis techniques based on the LTE plane-parallel atmospheric model.
Results. We find a chemical pattern, with most elements being under-abundant compared with the Sun; that is [Fe/H] = −0.54 ± 0.16 dex, [C/H] = −0.45 ± 0.05 dex, or [Mg/H] = −0.40 ± 0.16 dex, among others. In particular, we measured a lithium abundance of A(Li) = 3.06 ± 0.10 dex for OGLE-GD-CEP-0516, which makes this object the sixth Li-rich object to be identified among the Milky Way DCEPs.
Conclusions. Our results favour the scenario in which the six Galactic Li-rich DCEPs are crossing the instability strip for the first time having had slowly rotating progenitors during their main sequence phase. This study explores the link between lithium abundance and the pulsation period in classical Cepheids. We find that brighter Cepheids, indicative of higher mass, show enhanced lithium abundance, contrary to predictions from evolutionary models considering rotation. Additionally, our analysis of lithium abundance versus [Fe/H] reveals a lack of significant correlation, contradicting expectations from galactic chemical evolution (GCE) models.
Key words: stars: abundances / stars: fundamental parameters / stars: individual: OGLE-GD-CEP-0516 / stars: variables: Cepheids
Based on observations European Southern Observatory programs P105.20MX.001.
© The Authors 2024
 Open Access article, published by EDP Sciences, under the terms of the Creative Commons Attribution License (https://creativecommons.org/licenses/by/4.0), which permits unrestricted use, distribution, and reproduction in any medium, provided the original work is properly cited.
This article is published in open access under the Subscribe to Open model. This email address is being protected from spambots. You need JavaScript enabled to view it. to support open access publication.
1. Introduction
Classical Cepheids (DCEPs) are the most important standard candle for the extragalactic distance scale and are powerful tracers of the young (∼50–300 Myr) populations inside a galaxy, including the Milky Way. Moreover, observations of DCEPs are also crucial for our understanding of the physical mechanisms governing their evolution and pulsation. In this context, the rare lithium-rich DCEPs subclass is of particular interest. Indeed, only five DCEPs showing enhanced lithium abundance (through the detection of the Li I 6707.766 Å) have been discovered in the Galaxy so far (Luck & Lambert 2011; Kovtyukh et al. 2016, 2019; Catanzaro et al. 2020) and an additional one was detected in the Large Magellanic Cloud (LMC; Luck & Lambert 1992). All these objects show a surface lithium abundance of A(Li) ∼ 3.0 dex, which is in contrast to the majority of the Galactic DCEPs, which show A(Li) < 1.2 dex (Luck & Lambert 2011). This discovery was surprising, as Li is expected to be depleted by proton capture after the first dredge up (1DU) occurring at the beginning of the red giant branch (RGB) phase (Iben 1967). A natural explanation is that these DCEPs are at their first crossing of the instability strip (IS) and their envelopes do not show the signature of nuclear processes that occurred during the main sequence (MS) phase. Indeed, according to Kovtyukh et al. (2019), at least three of the four Milky Way (MW) Li-rich DCEPs also show CNO species abundances that are consistent with the solar values, that is not processed by the CN-cycle. However, the 1DU is not the only phenomenon capable of depleting lithium. Rotational mixing can reduce the lithium abundance by a factor of a hundred in a fraction of the MS lifetime in sufficiently fast rotating MS stars (e.g. Brott et al. 2011). This would then explain the scant number of Li-rich DCEPs. Indeed, as noted by Kovtyukh et al. (2019), about 80% of the DCEPs expected to be at their first crossing (about 5% of the total) are Li-depleted. Therefore, it can be hypothesised that the progenitors of the Li-rich and Li-depleted DCEPs (B stars) were slow and fast rotators, respectively, during their MS evolution. It is known that a fraction (∼15%) of the B-stars show v sin i < 20 km s−1 (Huang et al. 2010), while the large majority rotate much faster. It is thought that the slow rotators lose most of their angular momentum on the MS due to stellar winds enhanced by the rotation itself (Maeder & Meynet 2000). Therefore, upon becoming DCEPs, they show the moderate rotational velocities typical of these stars.
An additional feature of the Li-rich DCEPs is that they most frequently are multi-mode pulsators. Among the five MW Li-rich DCEPs, ASAS J075842−2536.1, ASAS J131714–6605.0, and V363 Cas pulsate in the first and second overtone (DCEP_1O2O), V371 Per pulsates in the fundamental and first overtone (DCEP_F1O), whereas V1033 Cyg is only a fundamental mode (DCEP_F) pulsator. According to Kovtyukh et al. (2019), multi-mode DCEPs have a less efficient mixing in their envelope than DCEP_Fs, and would therefore preferentially tend to retain their Li.
Although other more complex processes can address the presence of lithium in DCEPs (see Kovtyukh et al. 2019, for a detailed discussion), the basic mechanism to explain Li-rich DCEPs is their transit through the IS at the first crossing. This occurrence can be verified by measuring the rate of period change due to their evolution along the Hertzsprung–Russell diagram (HRD), as the period is expected to increase at the first and third crossing, and decrease at the second one (see e.g. Turner et al. 2006). The data available allowed Kovtyukh et al. (2019) and Catanzaro et al. (2020) to detect a quick period change in V1033 Cyg and in V363 Cas, respectively, but were insufficient to allow the detection of period changes in the other three MW DCEPs.
In the course of a large project devoted to measuring the metallicity dependence of the period–luminosity relations of DCEPs, dubbed C-MetaLL1 (Cepheid – Metallicity in the Leavitt Law; see Ripepi et al. 2021; Trentin et al. 2022), we obtained high-resolution spectroscopy for hundreds of Galactic DCEPs. As a by-product of the C-MetaLL project, we systematically searched all the targets for the presence of a deep Li I 6707.766 Å line in their spectra. In this Letter, we report the successful detection of this lithium line in the Galactic DCEP OGLE-GD-CEP-0516.
2. Spectroscopic observations and data analysis
We collected high-resolution spectroscopy for OGLE-GD-CEP-0516 using the Ultraviolet and Visual Echelle Spectrograph (UVES)2) instrument operated by the European Southern Observatory (ESO) and attached to the Unit Telescope 2 of the Very Large Telescope (VLT) in Paranal (Chile). The spectrum covers the wavelength range between λλ 4790 and 6800 Å, with a spectral resolution of R = 47 000. The signal-to-noise ratio (S/N) varies from 80 to 100. The main characteristics of OGLE-GD-CEP-0516 are summarised in Table 1.
Main characteristics of OGLE-GD-CEP-0516.
The spectrum reduction, which included bias subtraction, spectrum extraction, flat fielding, and wavelength calibration, was performed using the ESO reduction pipeline. The radial velocity was measured by cross-correlating the observed spectrum with a synthetic template using the Image Reduction and Analysis Facility (IRAF) task FXCOR and excluding Balmer lines as well as wavelength ranges containing telluric lines. The IRAF package RVCORRECT was adopted to determine the heliocentric velocity by correcting the spectrum for the Earth’s motion.
All the important quantities characterising the stellar atmosphere, such as effective temperature (Teff), surface gravity (log g), microturbulent (ξ), and lines broadening contributions (vbr) due to the combined effects of v sin i and macroturbulent velocity (which makes a dominant contribution in DCEPs), were derived by Trentin et al. (2022). These quantities are listed in Table 2.
Atmospheric parameters adopted for OGLE-GD-CEP-0516.
As a check of these parameters (principally Teff and log g), we reproduced the observed spectral energy distribution (SED) with the synthetic flux computed using the plane parallel local thermodynamic equilibrium (LTE) atmosphere models computed using the ATLAS9 code (Kurucz 1993). The observed flux was retrieved from the Virtual Observatory SED Analyzer (VOSA; Bayo et al. 2008) and corrected for reddening adopting AV = 1.446 mag (Anders et al. 2019) and the Fitzpatrick (1999) extinction law. The comparison between the observed and the theoretical SEDs is satisfactory, as shown in Fig. A.1. The SED can be used to estimate the bolometric luminosity Lbol of OGLE-GD-CEP-0516, provided we know its distance. To this aim, we adopted the distance obtained by Bailer-Jones et al. (2021) based on Gaia Early Data Release 3 (EDR3; Gaia Collaboration 2016, 2021), obtaining a final value of Lbol = 140 ± 5 L⊙.
As an additional check regarding the line-broadening value reported in Trentin et al. (2022), we adopted the code iacob-broad described in Simón-Díaz & Herrero (2014) to disentangle the effects of the rotational velocity from those of macroturbulence. In this code, the authors assumed a radial–tangential definition of the macroturbulence profile (see Gray 2008, for a detailed description). Briefly, we derived the macroturbulent velocity from the goodness-of-fit method (using a χ2 formalism) when the v sin i is fixed to the value corresponding to the first zero of the fast Fourier transform (FFT) of a chosen line profile. For this calculation, we have chosen five spectral lines well isolated in the spectrum and for which the S/N on both sides of the line is > 150, namely: Fe Iλλ 6003.011, 6027.051, 6056.004, 6065.481, and 6252.555 Å. The FFT of those lines is shown with different colours in Fig. A.2. For each of those, we computed both v sin i (first zero of the FFT) and ΘRT (by goodness-of-fit technique), and the weighted means of the results are reported in Table 2. As expected, the macroturbulence velocity completely dominates the rotational profile, being consistent with the value of vbr given by Trentin et al. (2022).
Except for lithium, the abundances reported in Table A.1 have been calculated by Trentin et al. (2022). Regarding lithium, we proceeded with this target as described in Catanzaro et al. (2020), that is, we performed spectral synthesis using the SYNTHE code (Kurucz & Avrett 1981) applied to an LTE plane-parallel atmosphere model computed by ATLAS9 (Kurucz 1993) for Teff and log g reported in Table 2. According to Amarsi et al. (2020), the non-LTE departure for [Li/H] in giant stars with the metallicity of our target is ≈0.05 dex, which is negligible for this study. In Fig. 1, we show the comparison between observed and synthetic spectra in three main spectral regions, namely Hβ and Hα, and the Li I 6708.766 Å line. For the synthesis of the Li I line, we took into account the hyperfine structure and the close Fe I 6708.282 Å line. The abundances of all the 24 species we detected in the spectrum of OGLE-GD-CEP-0516 are displayed in Fig. A.3. The analysis of this chemical pattern clearly shows that our target is metal poor. Indeed, the elements that contribute most to the metallicity are under-abundant compared with the solar composition (Grevesse et al. 2010). Furthermore, as [Fe/H] = −0.54 dex, we can conclude that OGLE-GD-CEP-0516 is the most metal-poor lithium-rich Galactic Cepheid.
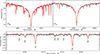 |
Fig. 1. Comparison between the spectrum of OGLE-GD-CEP-0516 obtained (black line) and the synthetic spectrum (red line) in three main spectral intervals centred, respectively, on Hβ (top-left panel), Hα (top-right panel), and the Li I line at 6707.766 Å (bottom panel). The spectral features not reproduced with the synthetic spectrum in the wing of Hα are telluric lines. The lithium line has been reproduced with A(Li) = 3.06 ± 0.10 dex. |
The lithium line was reproduced with an abundance of A(Li) = 3.06 ± 0.10, and the error on the lithium abundance was calculated by propagating the errors on the atmospheric parameters; that is, δT, δlog g, and δξ. This value is greater than the results from the standard Big Bang nucleosynthesis theory, which predicts a lithium abundance of A(Li) = 2.72 ± 0.06 dex (Cyburt et al. 2008), but is in agreement with the predictions of the Galactic Chemical Evolution models (GCE; e.g. Romano et al. 2021).
3. Discussion
The luminosity and the effective temperature derived in the previous section for OGLE-GD-CEP-0516 allowed us to place the star in the HR diagram (see Fig. 2). According to the evolutionary tracks by Bressan et al. (2012), its mass is M ≈ 2.7 M⊙. For comparison purposes, we placed in the same HR diagram all the DCEPs with lithium discovered so far, after a new estimate of their luminosities. In particular, we used the effective temperatures from the original sources, namely Kovtyukh et al. (2019), for all the stars except for V363 Cas, which was taken from Catanzaro et al. (2020), extinctions from Anders et al. (2019), and distances from Bailer-Jones et al. (2021). All these data are reported in Table 3.
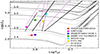 |
Fig. 2. HR diagram of the known MW Li-rich DCEPs. OGLE-GD-CEP-0516 is shown by the filled red circle. Different symbols are used for the other five stars from the literature (see labels). The ISs for fundamental (solid lines) and first-overtone (dashed lines) DCEPs by De Somma et al. (2020) as well as evolutionary tracks by Bressan et al. (2012) for Z = 0.008 (solid line) and Z = 0.014 (grey dashed line) in the mass range 2.4–5.0 M⊙ are also over-plotted on the data. |
Main parameters of the known MW Li-rich DCEPs.
When the DCEPs cross the IS for the first time, their surface chemical composition is the same as at the end of the MS phase. When the first dredge-up occurs, the surface abundances of the CNO elements change because Li-free material coming from the inner part of the star is mixed into the convective envelope. In particular, carbon becomes deficient relative to its initial abundance by about −0.3 dex, nitrogen is increased by ∼0.3 dex, while oxygen should remain practically unchanged (see e.g. Lyubimkov et al. 2011, 2015; Adamczak & Lambert 2014). Moreover, another possible evolutionary status indicator is the abundance of Na, which appears to be enhanced in post-first-dredge-up intermediate-mass stars (Sasselov 1986; Denissenkov 1994; Takeda et al. 2013). The limiting factor in this interpretation is the lack of knowledge of the initial abundance, while the star is in the main sequence. In the case of OGLE-GD-CEP-0516, we find C, O, and Na underabundant compared to the solar values, but this is not evidence for the first dredge-up because our target exhibits a low metallicity overall. This occurrence reinforces our hypothesis that the star is crossing the IS for the first time.
To further investigate the properties of Li-rich DCEPs, we searched for possible correlations between lithium and iron abundances, and also lithium abundances versus pulsational period. Figure 3 (left panel) displays an A(Li) versus [Fe/H] diagram. The sample of Li-rich DCEPs spans a relatively wide range in metallicity, from solar to [Fe/H] = –0.56 dex. The dispersion of A(Li) values around the mean is approximately 0.13 dex, exceeding the errors in individual measurements. The present sample of Li-rich DCEPs does not show any statistically significant correlation between lithium and iron. This finding is at odds with the predictions of the GCE models of Romano et al. (2021), for example, which display a significant reduction in lithium abundance when moving from [Fe/H] ∼ 0.0 dex to [Fe/H] ∼ −0.5 dex (see their Fig. 6). The right panel of Fig. 3 shows the distribution of A(Li) as a function of pulsation periods. We observed a moderate to strong positive Spearman rank correlation coefficient of 0.66 between the variables. However, the associated significance of the deviation from zero of 16% indicates that, although the correlation is not statistically significant at the 5% level, there is still a noteworthy relationship. Therefore, further investigation is needed to better understand this result. As the periods of DCEPs increase with the luminosity and, in turn, with the mass – thanks to the mass–luminosity relation –, we can conclude that brighter (more massive) objects show greater lithium abundances. To investigate this unexpected finding in more detail, in Fig. 4 we compare the lithium abundance of the six DCEPs versus Teff with the predictions of the STAREVOL (v3.00) evolutionary models (Lagarde et al. 2012, which are non-rotating and take into account thermohaline- and rotation-induced mixings). More specifically, by considering models for [Fe/H] = 0.0 dex, we show the evolution of A(Li) versus Teff for two masses, 2.5 M⊙ and 4.0 M⊙, both with and without rotation. According to Fig. 2, these values encompass the range of masses spanned by Li-rich DCEPs. Models without rotation do not predict lithium depletion within our temperature range as mass varies. Conversely, evolutionary models that take rotation into account show a strong lithium depletion of ≈1.4 dex and ≈1.8 dex, respectively, for 2.5 M⊙ and 4.0 M⊙. According to these models, more lithium is depleted in the atmosphere of less massive objects if they rotate. These predictions are in contrast to the trend shown by Li-rich DCEPs displayed in the right panel of Fig. 3. Indeed, in the case of no rotation, we should not expect any trend of lithium abundance with mass, while in the case of rotation, the expected trend is the opposite of what is observed. This strongly suggests that mixing due to rotation has not critically affected the evolution of the surface Li abundances in these stars, and that the measured A(Li) should closely reflect the initial values. In addition, we have to take into account that the surface rotation velocity in the STAREVOL models is on the order of 80–90 km s−1, which is considerably larger than what is measured for these DCEPs, whose surface rotation velocity, according to our measurements, should not exceed 10–20 km s−1. This also points to a very small surface Li depletion.
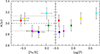 |
Fig. 3. Lithium abundances versus [Fe/H] (left panel) and the logarithm of pulsation periods (right panel). Colours have the same meaning as in Fig. 2. In the left panel, the dashed line represents the average A(Li), while dotted lines represent the ±1 σ level. |
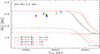 |
Fig. 4. Lithium abundances versus effective temperatures, compared with the predictions of the models STAREVOL (Lagarde et al. 2012). The curves are the predictions of the models for 2.5 M⊙ and 4.0 M⊙ with standard mixing (continuous lines) and with rotation-induced mixing and thermohaline instability (dashed lines). |
Based on these figures, a possible working scenario able to reconcile theory with observations is that more massive DCEPs rotate at a slightly slower surface velocity than the less massive ones. As lithium depletion is significant for large rotation velocities, we can speculate about the difference in rotational velocity between more and less massive DCEPs, which should be ∼10 km s−1 at most, a value compatible with the typical velocities measured in our targets.
4. Conclusions
In this Letter, we report the discovery of the sixth Li-rich DCEP, OGLE-GD-CEP-0516. This object adds further support to the idea that these objects tend to be short-period overtone pulsators. The presence of lithium in DCEP atmospheres is a rare event. In the course of the C-MetaLL project, we obtained spectroscopy for more than 330 DCEPs (e.g. Trentin et al. 2022, and in prep.), finding significant lithium abundance only in V363 Cas and OGLE-GD-CEP-0516. The high abundance of lithium and the low luminosity of OGLE-GD-CEP-0516 require that it cross the IS for the first time and has not experienced 1DU. Considering the ensemble properties of all six of the known Li-rich DCEPs in comparison with stellar evolution and GCE models, we find a general disagreement between theory and observations: (i) The DCEPs span a metallicity range of between 0.0 dex and −0.56 dex. In this interval, the measured lithium abundance is approximately constant, while GCE models predict a significant decrease to reach the plateau at A(Li) ∼ 2.7 dex. (ii) the Li-rich DCEPs show larger A(Li) values at larger masses (luminosities). According to evolutionary models, this trend might be explained by a scenario where higher-mass DCEPs rotate slightly slower than less massive ones.
The above conclusions are based on a small statistical sample of only six objects. An increase in the number of Li-rich DCEPs is essential to further our understanding of this puzzling phenomenon. To this aim, future wide spectroscopic surveys such as those planned with the WEAVE (WHT Enhanced Area Velocity Explorer)3 and 4MOST (4-m Multi-Object Spectroscopic Telescope)4 may allow us to discover many new Li-rich DCEPs and to obtain a definitive explanation for their existence.
Acknowledgments
We thank our anonymous Referee for her/his helpful comments. This work has made use of data from the European Space Agency (ESA) mission Gaia (https://www.cosmos.esa.int/gaia), processed by the Gaia Data Processing and Analysis Consortium (DPAC, https://www.cosmos.esa.int/web/gaia/dpac/consortium). Funding for the DPAC has been provided by national institutions, in particular, the institutions participating in the Gaia Multilateral Agreement. This publication makes use of VOSA, developed under the Spanish Virtual Observatory project supported by the Spanish MINECO through grant AyA2017-84089. VOSA has been partially updated by using funding from the European Union’s Horizon 2020 Research and Innovation Programme, under Grant Agreement no 776403 (EXOPLANETS-A). This research has made use of the SIMBAD database, operated at CDS, Strasbourg, France.
References
- Adamczak, J., & Lambert, D. L. 2014, ApJ, 791, 58 [NASA ADS] [CrossRef] [Google Scholar]
- Amarsi, A. M., Lind, K., Osorio, Y., et al. 2020, A&A, 642, A62 [EDP Sciences] [Google Scholar]
- Anders, F., Khalatyan, A., Chiappini, C., et al. 2019, A&A, 628, A94 [NASA ADS] [CrossRef] [EDP Sciences] [Google Scholar]
- Bailer-Jones, C. A. L., Rybizki, J., Fouesneau, M., Demleitner, M., & Andrae, R. 2021, AJ, 161, 147 [Google Scholar]
- Bayo, A., Rodrigo, C., Barrado Y Navascués, D., et al. 2008, A&A, 492, 277 [NASA ADS] [CrossRef] [EDP Sciences] [Google Scholar]
- Bressan, A., Marigo, P., Girardi, L., et al. 2012, MNRAS, 427, 127 [NASA ADS] [CrossRef] [Google Scholar]
- Brott, I., de Mink, S. E., Cantiello, M., et al. 2011, A&A, 530, A115 [NASA ADS] [CrossRef] [EDP Sciences] [Google Scholar]
- Catanzaro, G., Ripepi, V., Clementini, G., et al. 2020, A&A, 639, L4 [NASA ADS] [CrossRef] [EDP Sciences] [Google Scholar]
- Cyburt, R. H., Fields, B. D., & Olive, K. A. 2008, J. Cosmol. Astropart. Phys., 2008, 012 [CrossRef] [Google Scholar]
- De Somma, G., Marconi, M., Molinaro, R., et al. 2020, ApJS, 247, 30 [Google Scholar]
- Denissenkov, P. A. 1994, A&A, 287, 113 [NASA ADS] [Google Scholar]
- Fitzpatrick, E. L. 1999, PASP, 111, 63 [Google Scholar]
- Gaia Collaboration (Prusti, T., et al.) 2016, A&A, 595, A1 [NASA ADS] [CrossRef] [EDP Sciences] [Google Scholar]
- Gaia Collaboration (Brown, A. G. A., et al.) 2021, A&A, 649, A1 [NASA ADS] [CrossRef] [EDP Sciences] [Google Scholar]
- Gray, D. F. 2008, The Observation and Analysis of Stellar Photospheres (Cambridge, UK: Cambridge University Press) [Google Scholar]
- Grevesse, N., Asplund, M., Sauval, A. J., & Scott, P. 2010, Ap&SS, 328, 179 [Google Scholar]
- Huang, W., Gies, D. R., & McSwain, M. V. 2010, ApJ, 722, 605 [Google Scholar]
- Iben, I., Jr 1967, ARA&A, 5, 571 [NASA ADS] [CrossRef] [Google Scholar]
- Kovtyukh, V., Lemasle, B., Chekhonadskikh, F., et al. 2016, MNRAS, 460, 2077 [Google Scholar]
- Kovtyukh, V., Lemasle, B., Kniazev, A., et al. 2019, MNRAS, 488, 3211 [Google Scholar]
- Kurucz, R. L. 1993, in IAU Colloq. 138: Peculiar versus Normal Phenomena in A-type and Related Stars, eds. M. M. Dworetsky, F. Castelli, & R. Faraggiana, ASP Conf. Ser., 44, 87 [Google Scholar]
- Kurucz, R. L., & Avrett, E. H. 1981, SAO Special Report, 391 [Google Scholar]
- Lagarde, N., Decressin, T., Charbonnel, C., et al. 2012, A&A, 543, A108 [NASA ADS] [CrossRef] [EDP Sciences] [Google Scholar]
- Luck, R. E., & Lambert, D. L. 1992, ApJS, 79, 303 [Google Scholar]
- Luck, R. E., & Lambert, D. L. 2011, AJ, 142, 136 [Google Scholar]
- Lyubimkov, L. S., Lambert, D. L., Korotin, S. A., et al. 2011, MNRAS, 410, 1774 [NASA ADS] [Google Scholar]
- Lyubimkov, L. S., Lambert, D. L., Korotin, S. A., Rachkovskaya, T. M., & Poklad, D. B. 2015, MNRAS, 446, 3447 [NASA ADS] [CrossRef] [Google Scholar]
- Maeder, A., & Meynet, G. 2000, ARA&A, 38, 143 [Google Scholar]
- Ripepi, V., Catanzaro, G., Molinaro, R., et al. 2021, MNRAS, 508, 4047 [NASA ADS] [CrossRef] [Google Scholar]
- Romano, D., Magrini, L., Randich, S., et al. 2021, A&A, 653, A72 [NASA ADS] [CrossRef] [EDP Sciences] [Google Scholar]
- Sasselov, D. D. 1986, PASP, 98, 561 [NASA ADS] [CrossRef] [Google Scholar]
- Simón-Díaz, S., & Herrero, A. 2014, A&A, 562, A135 [NASA ADS] [CrossRef] [EDP Sciences] [Google Scholar]
- Takeda, Y., Kang, D. I., Han, I., Lee, B. C., & Kim, K. M. 2013, MNRAS, 432, 769 [NASA ADS] [CrossRef] [Google Scholar]
- Trentin, E., Ripepi, V., Catanzaro, G., et al. 2022, MNRAS, 519, 2331 [NASA ADS] [CrossRef] [Google Scholar]
- Turner, D. G., Abdel-Sabour Abdel-Latif, M., & Berdnikov, L. N. 2006, PASP, 118, 410 [Google Scholar]
Appendix A: Table and figures
Elemental abundances of OGLE-GD-CEP-0516.
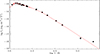 |
Fig. A.1. Spectral energy distribution of OGLE-GD-CEP-0516. Filled dots represent the observed fluxes as retrieved from the VOSA tool. A red line shows the theoretical flux computed using the ATLAS9 model for Teff = 6400 K and log g = 1.5. |
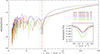 |
Fig. A.2. FFT of the Fe Iλλ 6003.011, 6027.051, 6056.004, 6065.481, and 6252.555 Å. First zeroes of the FFT, i.e. the v sin i values, are indicated by vertical dashed lines. The inset shows the spectral line profiles. |
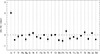 |
Fig. A.3. Chemical pattern derived for our target. The dashed line represents the solar standard abundance. |
All Tables
All Figures
|
Fig. 1. Comparison between the spectrum of OGLE-GD-CEP-0516 obtained (black line) and the synthetic spectrum (red line) in three main spectral intervals centred, respectively, on Hβ (top-left panel), Hα (top-right panel), and the Li I line at 6707.766 Å (bottom panel). The spectral features not reproduced with the synthetic spectrum in the wing of Hα are telluric lines. The lithium line has been reproduced with A(Li) = 3.06 ± 0.10 dex. |
| In the text | |
|
Fig. 2. HR diagram of the known MW Li-rich DCEPs. OGLE-GD-CEP-0516 is shown by the filled red circle. Different symbols are used for the other five stars from the literature (see labels). The ISs for fundamental (solid lines) and first-overtone (dashed lines) DCEPs by De Somma et al. (2020) as well as evolutionary tracks by Bressan et al. (2012) for Z = 0.008 (solid line) and Z = 0.014 (grey dashed line) in the mass range 2.4–5.0 M⊙ are also over-plotted on the data. |
| In the text | |
|
Fig. 3. Lithium abundances versus [Fe/H] (left panel) and the logarithm of pulsation periods (right panel). Colours have the same meaning as in Fig. 2. In the left panel, the dashed line represents the average A(Li), while dotted lines represent the ±1 σ level. |
| In the text | |
|
Fig. 4. Lithium abundances versus effective temperatures, compared with the predictions of the models STAREVOL (Lagarde et al. 2012). The curves are the predictions of the models for 2.5 M⊙ and 4.0 M⊙ with standard mixing (continuous lines) and with rotation-induced mixing and thermohaline instability (dashed lines). |
| In the text | |
|
Fig. A.1. Spectral energy distribution of OGLE-GD-CEP-0516. Filled dots represent the observed fluxes as retrieved from the VOSA tool. A red line shows the theoretical flux computed using the ATLAS9 model for Teff = 6400 K and log g = 1.5. |
| In the text | |
|
Fig. A.2. FFT of the Fe Iλλ 6003.011, 6027.051, 6056.004, 6065.481, and 6252.555 Å. First zeroes of the FFT, i.e. the v sin i values, are indicated by vertical dashed lines. The inset shows the spectral line profiles. |
| In the text | |
|
Fig. A.3. Chemical pattern derived for our target. The dashed line represents the solar standard abundance. |
| In the text | |
Current usage metrics show cumulative count of Article Views (full-text article views including HTML views, PDF and ePub downloads, according to the available data) and Abstracts Views on Vision4Press platform.
Data correspond to usage on the plateform after 2015. The current usage metrics is available 48-96 hours after online publication and is updated daily on week days.
Initial download of the metrics may take a while.