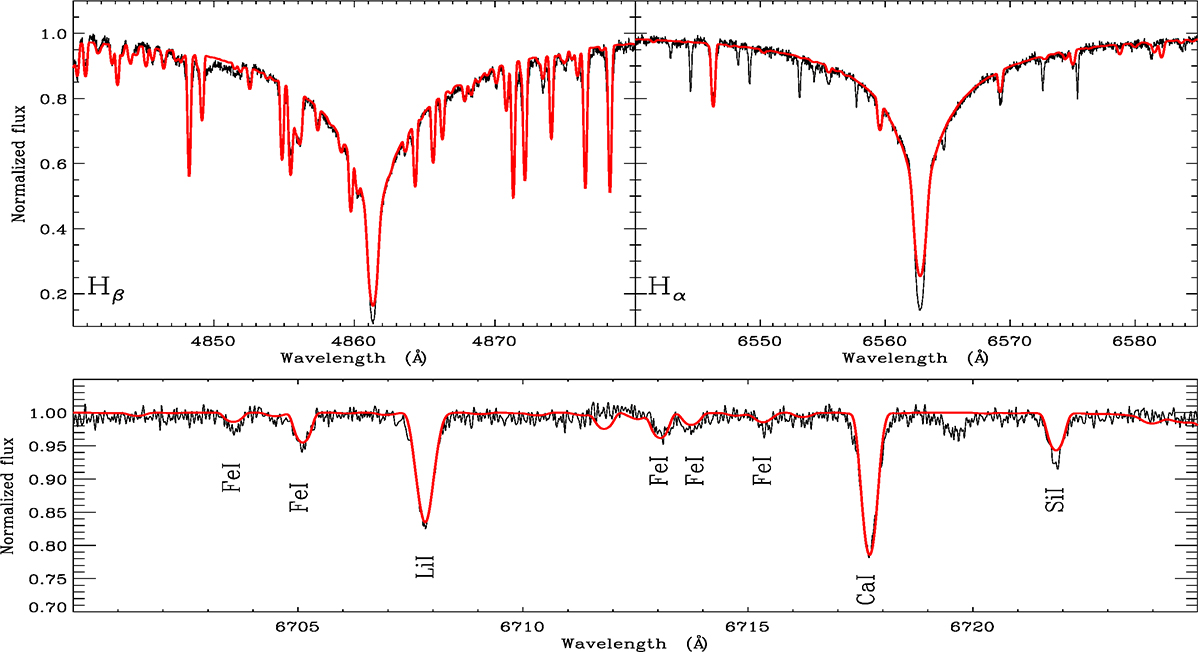
Fig. 1.
Download original image
Comparison between the spectrum of OGLE-GD-CEP-0516 obtained (black line) and the synthetic spectrum (red line) in three main spectral intervals centred, respectively, on Hβ (top-left panel), Hα (top-right panel), and the Li I line at 6707.766 Å (bottom panel). The spectral features not reproduced with the synthetic spectrum in the wing of Hα are telluric lines. The lithium line has been reproduced with A(Li) = 3.06 ± 0.10 dex.
Current usage metrics show cumulative count of Article Views (full-text article views including HTML views, PDF and ePub downloads, according to the available data) and Abstracts Views on Vision4Press platform.
Data correspond to usage on the plateform after 2015. The current usage metrics is available 48-96 hours after online publication and is updated daily on week days.
Initial download of the metrics may take a while.