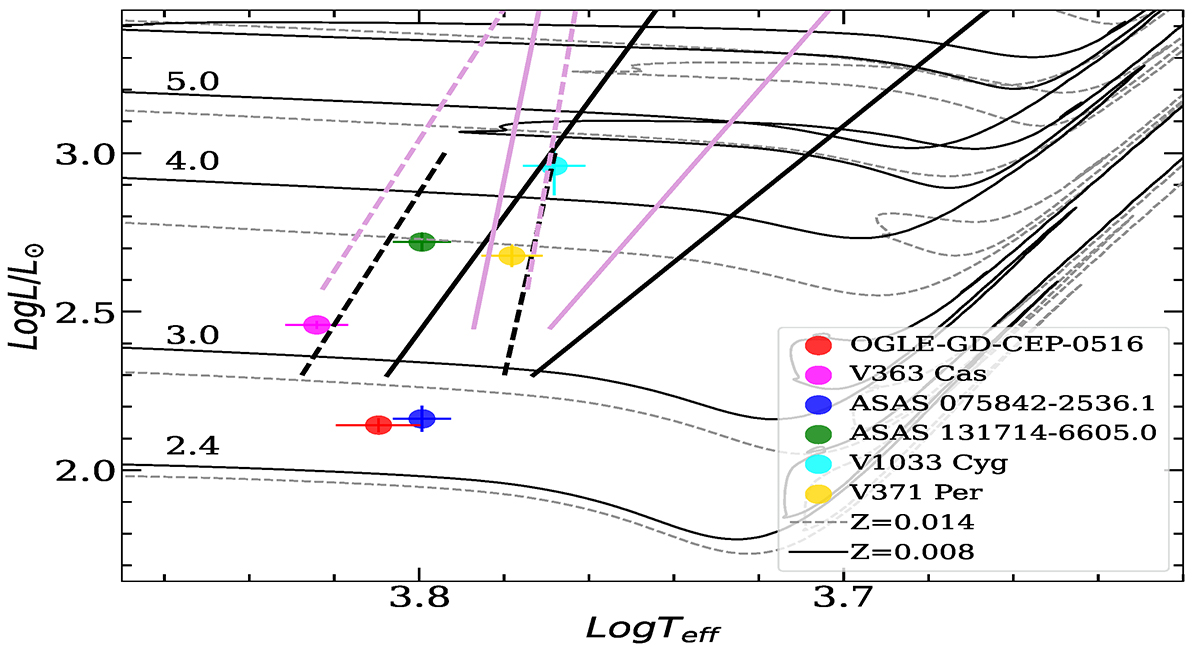
Fig. 2.
Download original image
HR diagram of the known MW Li-rich DCEPs. OGLE-GD-CEP-0516 is shown by the filled red circle. Different symbols are used for the other five stars from the literature (see labels). The ISs for fundamental (solid lines) and first-overtone (dashed lines) DCEPs by De Somma et al. (2020) as well as evolutionary tracks by Bressan et al. (2012) for Z = 0.008 (solid line) and Z = 0.014 (grey dashed line) in the mass range 2.4–5.0 M⊙ are also over-plotted on the data.
Current usage metrics show cumulative count of Article Views (full-text article views including HTML views, PDF and ePub downloads, according to the available data) and Abstracts Views on Vision4Press platform.
Data correspond to usage on the plateform after 2015. The current usage metrics is available 48-96 hours after online publication and is updated daily on week days.
Initial download of the metrics may take a while.