Open Access
Fig. 4.
Download original image
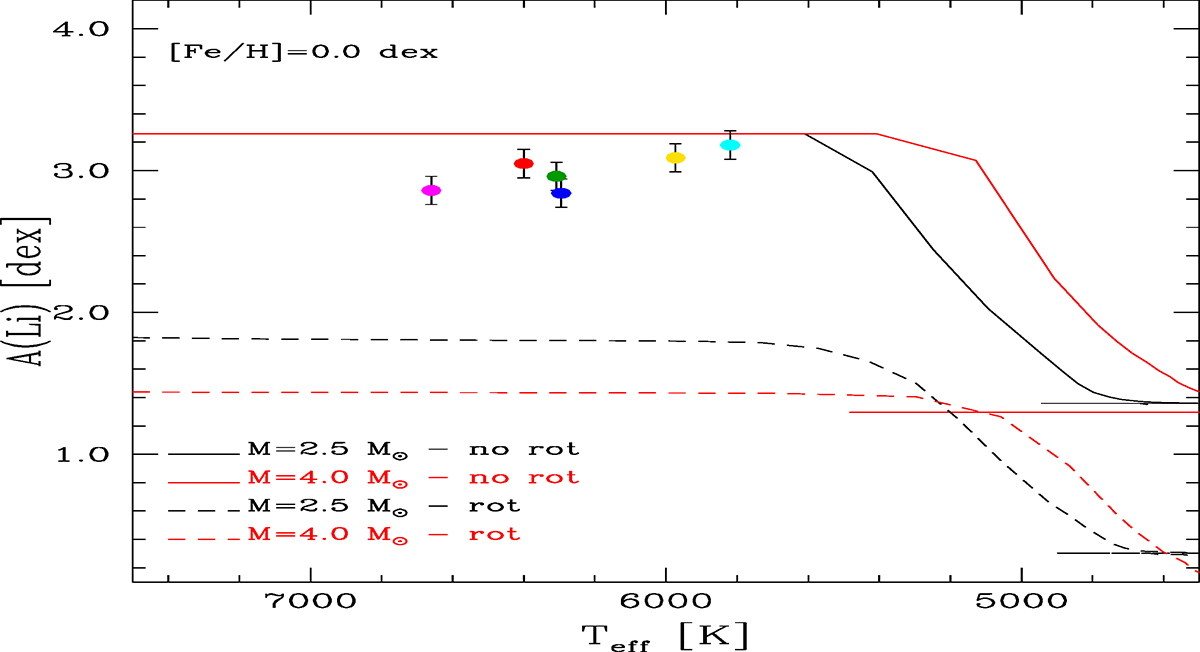
Lithium abundances versus effective temperatures, compared with the predictions of the models STAREVOL (Lagarde et al. 2012). The curves are the predictions of the models for 2.5 M⊙ and 4.0 M⊙ with standard mixing (continuous lines) and with rotation-induced mixing and thermohaline instability (dashed lines).
Current usage metrics show cumulative count of Article Views (full-text article views including HTML views, PDF and ePub downloads, according to the available data) and Abstracts Views on Vision4Press platform.
Data correspond to usage on the plateform after 2015. The current usage metrics is available 48-96 hours after online publication and is updated daily on week days.
Initial download of the metrics may take a while.