| Issue |
A&A
Volume 687, July 2024
|
|
|---|---|---|
| Article Number | A50 | |
| Number of page(s) | 14 | |
| Section | Extragalactic astronomy | |
| DOI | https://doi.org/10.1051/0004-6361/202348464 | |
| Published online | 26 June 2024 | |
MALS discovery of a rare H I 21 cm absorber at z ∼ 1.35: Origin of the absorbing gas in powerful active galactic nuclei
1
Inter-University Centre for Astronomy and Astrophysics, Post Bag 4, Ganeshkhind, Pune 411 007, India
e-mail: parthad@iucaa.in
2
Department of Astronomy & Astrophysics, The University of Chicago, 5640 South Ellis Avenue, Chicago, IL 60637, USA
3
Department of Astronomy, University of Michigan, Ann Arbor, MI 48109, USA
4
Institut d’Astrophysique de Paris, UMR 7095, CNRS-SU, 98bis bd Arago, 75014 Paris, France
5
Franco-Chilean Laboratory for Astronomy, IRL 3386, CNRS and Departamento de Astronomía, Universidad de Chile, Casilla 36-D Santiago, Chile
6
Observatoire de Paris, Collège de France, PSL University, Sorbonne University, CNRS, LERMA, Paris, France
7
Department of Astronomy, University of Maryland, College Park, MD 20742, USA
8
X-ray Astrophysics Laboratory, NASA/GSFC, Greenbelt, MD 20771, USA
9
Center for Research and Exploration in Space Science and Technology, NASA/GSFC, Greenbelt, MD 20771, USA
10
Ioffe Institute, 26 Politeknicheskaya st., St. Petersburg 194021, Russia
11
National Radio Astronomy Observatory, 520 Edgemont Road, Charlottesville, VA 22903, USA
12
Max-Planck-Institut für Radioastronomie, Auf dem Hügel 69, 53121 Bonn, Germany
13
Department of Physics and Electronics, Rhodes University, PO Box 94 Makhanda 6140, South Africa
14
Université Lyon 1, ENS de Lyon, CNRS, Centre de Recherche Astrophysique de Lyon UMR5574, 69230 Saint-Genis-Laval, France
15
National Radio Astronomy Observatory, 1003 Lopezville Rd., Socorro, NM 87801, USA
16
The Observatories of the Carnegie Institution for Science, 813 Santa Barbara Street, Pasadena, CA 91101, USA
Received:
2
November
2023
Accepted:
13
February
2024
We report a new, rare detection of H I 21 cm absorption associated with a quasar (only six quasars are known at 1 < z < 2) toward J2339−5523 at zem = 1.3531, discovered through the MeerKAT Absorption Line Survey (MALS). The absorption profile is broad (∼400 km s−1 ), and the peak is redshifted by ∼200 km s−1 from zem. Interestingly, optical/far-UV spectra of the quasar from the Magellan-MIKE/HST-COS spectrographs do not show any absorption features associated with the 21 cm absorption, despite the coincident presence of the optical quasar and the radio core inferred from a flat-spectrum component with a flux density of ∼65 mJy at high frequencies (> 5 GHz). The simplest explanation would be that no large H I column (N(H I) > 1017 cm−2) is present toward the radio core and the optical active galactic nucleus. Based on the joint optical and radio analysis of a heterogeneous sample of 16 quasars (zmedian = 0.7) and 19 radio galaxies (zmedian = 0.4) with H I 21 cm absorption detection and matched in 1.4 GHz luminosity (L1.4 GHz), a consistent picture emerges according to which quasars primarily trace the gas in the inner circumnuclear disk and cocoon created by the interaction of the jet with interstellar medium. They (i.e., quasars) exhibit a L1.4 GHz – ΔVnull correlation and a frequent mismatch of the radio and optical spectral lines. The radio galaxies show no such correlation and likely trace the gas from the cocoon and the galaxy-wide interstellar medium outside the photoionization cone. The analysis presented here demonstrates the potential of radio spectroscopic observations to reveal the origin of the absorbing gas associated with active galactic nuclei that may be missed in optical observations.
Key words: galaxies: ISM / quasars: absorption lines
© The Authors 2024
 Open Access article, published by EDP Sciences, under the terms of the Creative Commons Attribution License (https://creativecommons.org/licenses/by/4.0), which permits unrestricted use, distribution, and reproduction in any medium, provided the original work is properly cited.
This article is published in open access under the Subscribe to Open model. Subscribe to A&A to support open access publication.
1. Introduction
Observations and simulations both provide strong support for the feedback from active galactic nuclei (AGN) in regulating the star formation efficiency of the host galaxy (e.g., Croton et al. 2006; Fabian 2012). The impact of AGN feedback on the physical state of cold atomic and molecular gas is of particular importance in this context. Cold atomic and molecular gas represent the raw material for star formation and directly affect the evolutionary track of the galaxy (e.g., Veilleux et al. 2020). Absorption line studies provide a powerful way to study these phases in the AGN environment. At optical wavelengths, the obscuration of the AGN by dust prevents the detection of dense molecular clouds in absorption. Mostly diffuse (presumably warm, ∼104 K) H I has been detected through proximate damped Lyman-α absorption (e.g. Ellison et al. 2010), but progress is made to reach colder (∼100 K) and denser phases using H2 observations (Noterdaeme et al. 2019). At radio wavelengths, H I 21 cm absorption lines in turn provide a dust-unbiased way to probe the cold atomic gas toward the population of radio-loud AGNs.
To date, more than 500 AGN have been searched for H I 21 cm absorption at 0 < z < 5 (see Morganti & Oosterloo 2018, for a review). Most of the H I 21 cm absorption detections are associated with compact steep spectrum (CSS) and gigahertz-peaked spectrum (GPS) radio sources (sizes < 15 kpc) at low redshifts (z < 0.3). The typical H I column densities for an assumed spin temperature of 100 K in the case of detections are 1020 − 21 cm−2. The high 21 cm absorption detection rate (∼30%) for these detections is thought to be a direct consequence of the fact that these radio sources are young (age < 105 yr) and still embedded in the interstellar medium (ISM) of gas-rich host galaxy (e.g., Vermeulen et al. 2003; Gupta et al. 2006). This scenario is also supported by the observational signatures of gas outflows that occur at subkiloparsec scales, which result from radio jet-ISM interactions that are detected through an excess of blueshifted absorption lines (e.g., Morganti et al. 2005a,b; Mahony et al. 2013; Geréb et al. 2015; Morganti & Oosterloo 2018). Furthermore, a bulk of 21 cm absorption detections are associated with type II AGNs (i.e., here radio galaxies) that are seen edge-on. This led to the conclusion that a significant portion of the absorbing gas, especially gas represented by strong narrow absorption components, originates in the obscuring torus or galaxy-wide ISM outside the photoionization cone (Pihlström et al. 2003; Gupta et al. 2006; Gupta & Saikia 2006).
Quantifying the evolution with redshift in the properties of cold gas associated with AGN ought to be an obvious goal of H I 21 cm absorption line studies. However, despite great efforts over the past three decades, only a handful of absorption systems are known at z > 1: six systems at 1 < z < 2, and four systems at 2 < z < 3.5 (e.g., Aditya & Kanekar 2018b; Gupta et al. 2021b; Curran & Whiting 2012). Specifically, most targets at z > 2 are powerful quasars (log L1.4 GHz(W Hz−1) ≳ 27.0). They show an extremely low H I 21 cm absorption detection rate ( %), which agrees with the observed rate (2–5%) of proximate (Δv < 3000 km s−1 from zem) damped Lyα absorbers (N(H I) > 1020.3 cm−2; Ellison et al. 2002). Overall, no firm conclusions can be drawn about the redshift evolution because of the small number of high-z detections, the different selection methods that were applied to low- and high-z samples, and the luminosity bias affecting uniformly selected samples (see Aditya & Kanekar 2018a,b; Grasha et al. 2019).
Here, we report the first associated H I 21 cm absorption detection discovered by the ongoing MeerKAT Absorption Line Survey (MALS; Gupta et al. 2017). The corresponding AGN at z = 1.3531 is a bona fide quasar (Véron-Cetty & Véron 2001) and an extremely powerful radio source with 1.4 GHz luminosity, L1.4 GHz = 1027.2 W Hz−1. The combination of compact radio emission (< 5.2 kpc; Boettcher et al. 2022) and the steep spectral index (α ∼ −0.8) – modeled using a power law, Sν ∝ να – imply that the radio AGN may be classified as a CSS source (O’Dea & Saikia 2021). Interestingly, no signatures of neutral gas at the H I 21 cm absorption redshift are detected in the optical-ultraviolet spectrum. The joint radio-optical analysis of this case allows us to discuss the origin and distribution of absorbing gas in the vicinity of the radio source.
This paper is structured as follows. In Sect. 2, we present the details of the radio and far-UV (FUV)/optical observations and their data analysis. In Sect. 3, we present the results and explore the possibility that the absorption might occur against the radio-core component. In Sect. 4, we discuss J2339−5523 in the context of other quasars and radio galaxies in the literature with reported H I 21 cm detections, and we draw general conclusions about the origin of the absorbing gas. The results are summarized in Sect. 5.
Throughout this paper, we use a flat Λ cosmology with Ωm = 0.315, ΩΛ = 0.685, and H0 = 67.4 km s−1 Mpc−1 (Planck Collaboration VI 2020). At z = 1.3531, 1″ = 8.642 kpc.
2. Observations and data analysis
2.1. Radio observations
J2339−5523 was observed with the MeerKAT-64 array using the 32K mode of the SKA Reconfigurable Application Board (SKARAB) correlator, on 2020 June 14 and 22 (L-band; 856–1712 MHz), and on 2021 January 07 (UHF-band; 544–1088 MHz). The details of the L-band datasets providing a total on-source time of 112 min are presented in Boettcher et al. (2022). For the UHF observations, the SKARAB correlator was configured to split the 544 MHz bandwidth centered at 815.9917 MHz into 32 768 frequency channels. We also observed J0408-6545 for the flux density scale, delay, and bandpass calibrations, and we observed J2329−4730 for the complex gain calibration. The data were acquired in all four polarization products XX, XY, YX, and YY. The correlator dump time was 8 seconds. The total integration time on J2339−5523 was 120 min.
The data were flagged, calibrated, and imaged using the automated radio telescope imaging pipeline (ARTIP) described in Gupta et al. (2021a). The details of the Stokes-I continuum and spectral line imaging steps specific to the L- and UHF-band datasets were presented in Gupta et al. (2021a) and Combes et al. (2021), respectively. The spectral line processing in ARTIP proceeds by splitting the band into 15 spectral windows, labeled SPW0 to SPW14, and it generates continuum images and spectral line image cubes for each of them. For the continuum and spectral line imaging, we used Briggs weighting with a robust factor of 0, as implemented in the Common Astronomy Software Applications (CASA; McMullin et al. 2007). In Fig. 1, we show Stokes-I continuum images of the lowest- and highest-frequency spectral windows from the UHF and L bands, respectively. The restoring beams for these images at 580.1 MHz and 1642.3 MHz are  (position angle = −46.2°) and
  (position angle = +11.8°), respectively. The corresponding flux densities at these frequencies, that is, 363.7 ± 0.6 mJy at 580.1 MHz and 166.0 ± 0.1 mJy at 1642.3 MHz, lead to a spectral index of
  . The rms noise values close to the central bright source are 300 μJy beam−1 and 50 μJy beam−1, respectively. The radio emission is unresolved in these images, and using the 1642.3 MHz image, we estimate a deconvolved size
  (see also Boettcher et al. 2022). At z = 1.35, the 21 cm line frequency falls in the SPW1 of the UHF-band, covering 594.983–633.233 MHz and centered at 614.1 MHz (restoring beam =
  ; position angle = −45.7°). Using a single-component Gaussian fit to the radio emission, we estimate the total continuum and peak flux density of the source to be 343.0 ± 0.7 mJy and 336.4 ± 0.5 mJy beam−1, respectively.
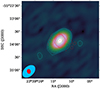 |
Fig. 1. Portion of the larger (6k × 6k pixels) MeerKAT Stokes-I continuum images centered on the quasar J2339−5523. The background is the UHF-band image at 580.1 MHz (SPW0). The contour levels are n × ( − 1, 1, 2, 4, 8, 16, ...), where n = 1.0 mJy beam−1 (cyan) and 0.15 mJy beam−1 (red) for the UHF- and L-band images at 580.1 MHz (SPW0) and 1642.3 MHz (SPW14), respectively. The restoring beams are shown as ellipses in the bottom left corner of the image. The shapes of the cyan and red contours simply follow the corresponding restoring beams, as expected for the unresolved emission (see text for details). |
Since the radio emission associated with J2339−5523 is unresolved in the MeerKAT images, we extracted spectra at the pixel (3″) corresponding to the peak intensity. As shown in Fig. 2, we clearly detect H I 21 cm absorption associated with J2339−5523. At the detected frequency, based on the spectra of other radio sources observed in MALS, there is no known RFI, and the absorption is consistently detected in the XX and YY spectra. The absorption profile can be well modeled (reduced χ2 = 1.04) with two Gaussians. The details of the fit and the values of the best-fit parameters are given in Table 1. The velocity width between the nulls of the absorption profile (ΔVnull) is ∼400 km s−1. The channel width and rms noise in the vicinity of the redshifted H I 21 cm line frequency in the unsmoothed spectrum are 8.3 km s−1 and 1.1 mJy beam−1 channel−1. The spectrum presented in Fig. 2 has been normalized using the peak flux density of the continuum emission.
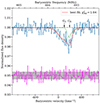 |
Fig. 2. H I 21 cm absorption associated with J2339−5523. Zero velocity corresponds to zem = 1.3531. Individual Gaussian components (Table 1) and the combined best-fit model are overplotted as dashed (green) and continuous lines (red), respectively. The residuals from the fit (magenta curve) and the 1σ uncertainty on the normalized flux density (shaded region in gray), arbitrarily offset for clarity, are also shown. |
Multiple Gaussian fits to the H I absorption in J2339−5523.
2.2. Far-ultraviolet and optical absorption spectra
Medium-resolution, high signal-to-noise ratio (S/N) FUV spectra of J2339−5523 were obtained under the Cosmic Ultraviolet Baryon Survey (CUBS) program (PID = 15163; PI: Chen) using the Cosmic Origins Spectrograph (COS; Green et al. 2012) on board the Hubble Space Telescope (HST). The COS FUV spectra offer a contiguous spectral coverage of λ = 1100–1800 Å, with a full width at half maximum (FWHM) of the instrumental function of ∼20 km s−1. Optical échelle spectra of J2339−5523 were obtained using the Magellan Inamori Kyocera Echelle (MIKE; Bernstein et al. 2003) spectrograph on the Magellan Clay Telescope, which cover a wavelength range of λ = 3330–9300 Å with an FWHM ∼ 8 km s−1. The details regarding the observations and data reduction of MIKE spectra were presented in Chen et al. (2020). All spectra were continuum-normalized using a low-order polynomial fit to spectral regions free of strong absorption features.
The final combined COS spectrum of the quasar has a median S/N per resolution element of ⟨ S/N⟩resol = 22 over the FUV spectral window. The final combined optical échelle spectrum has an ⟨ S/N⟩resol = 15 at λ ∼ 3500 Å. The joint COS FUV and MIKE optical échelle spectra of this quasar provide an extended spectral coverage to constrain the abundances of neutral gas and associated metal ions along the line of sight. Specifically, at z = 1.3531, sensitive constraints can be obtained for He I, C II, C IV, O III, Al II, Al III, Mg II, Fe II, and Ca II. However, the hydrogen Lyman series lines are redshifted outside of the COS FUV window. No direct UV absorption constraints are available for H I.
3. Results
3.1. H I 21 cm absorption line gas
The neutral hydrogen column density N(H I), spin temperature Ts, and covering factor of the radio emission by the absorbing gas (fc) are related to the integrated optical depth (∫τdv), through
The absorption profile presented in Fig. 2 corresponds to ∫τdv = 3.7 ± 0.2 km s−1. Assuming Ts = 100 K and fc = 1, the total column density is (6.7 ± 0.4) × 1020(TS/100)(1/fc) cm−2. The spin temperature is directly controlled by collisions, absorption of 21 cm continuum radiation, and pumping by Lyα photons (Field 1958). In the neighborhood of AGN, the radiative effects may dominate and Ts ≫ 100 K (Maloney et al. 1996). In order to derive N(H I), we also need constraints on the fraction of radio continuum emission covered by the absorbing gas in addition to Ts, that is, fc which may be lower than 1. The assumptions of Ts = 100 K and fc = 1 therefore provide a lower limit to the true N(H I).
3.2. Comparison with the optical/UV spectral line
Despite the absorption detected in H I 21 cm, no absorption transitions in the UV are seen in available FUV and optical spectra of the quasar. As described in Sect. 2.2, the available HST COS and Magellan MIKE spectra provide spectral coverage for He I, C II, C IV, O III, Al II, Al III, Mg II, Fe II, and Ca II at the redshift of the 21 cm absorber. In Fig. 3, we show FUV/optical spectra at the locations of some of these lines. Clearly, no absorption features are seen in the vicinity of the 21 cm absorption to within sensitive column density limits. The lack of both low- and intermediate-ionization species indicates that the absence of signals is unlikely due to the ionization state of the gas. Furthermore, the lack of He I, a nonmetal, indicates that the absence of cold-gas signatures cannot be attributed to a possibly low metal content. While the data do not provide coverage for the hydrogen Lyman series lines, the observed 2σ upper limit of He I can be converted into an H I column density limit of log N(H I)/cm−2 < 15.2 (e.g., Qu et al. 2023). In Fig. 3 and Table 2, we present the constraints imposed by C IV, Mg II, and He I. These are the strongest UV transitions available at this redshift.
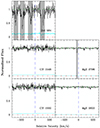 |
Fig. 3. Constraints on the UV absorption features for a subset of strong transitions commonly seen in quasar absorption-line surveys. Zero velocity corresponds to the quasar emission redshift zem = 1.3531. Contaminating features associated with systems in the foreground at z< zem are grayed out. At this redshift, H I Lyman series lines are redshifted out of the COS FUV spectral coverage. |
UV absorption line constraints for G0 and G1 fitted to the 21 cm line.
It is worth mentioning here that in the FUV band (λeff ∼ 1528 Å) of the Galaxy Evolution Explorer (GALEX; Bianchi et al. 2017) observations, the quasar is detected with an AB magnitude of 17.91 mag. This detection directly rules out the presence of a DLA, or even a Lyman limit system (LLS), at z = 1.3531 along the UV line of sight, regardless of any assumptions about the metallicity or the ionization state. This is because the Lyman limit at z = 1.3531 occurs at a much redder wavelength (λ ∼ 2146 Å) than the cutoff of the GALEX FUV filter. If there were such a strong H I absorber toward the sight line, GALEX would not detect the quasar in the FUV images.
3.3. Origin of the absorbing gas
The CSS sources such as J2339−5523 typically exhibit a core-jet or a double-lobed structure reminiscent of large-scale radio sources (O’Dea & Saikia 2021). Since J2339−5523 is a quasar, we anticipate a dominant core component. Nearly simultaneous high-frequency radio observations at 5, 8, and 20 GHz from the AT20G survey carried out using the Australia Telescope Compact Array (ATCA) over 2004–2008 (Murphy et al. 2010) exhibit a flat spectrum component (αATCA = −0.3 ± 0.2) with flux densities of 102 ± 5, 69 ± 4 and 65 ± 3 mJy, respectively. We note that in the W3 (12 μm) and W4 (24 μm) bands of the Wide-field Infrared Survey Explorer (WISE; Wright et al. 2010; Cutri et al. 2014), the quasar has a brightness of 8.475 ± 0.022 mag and 6.033 ± 0.047 mag, respectively. For non-AGN sources, the 33 GHz flux density (S33 GHz) in mJy is related to the flux density at 24 μm (f24 μm) in mJy through  (Murphy et al. 2012). The W3 and W4 band flux densities correspond to rest frame fluxes at ∼5 μm and ∼10 μm, respectively. Assuming that a simple power law holds in the range (5–24 μm), we derived the rest frame 24 μm flux density to be ∼235 mJy, corresponding to S33 GHz ∼ 1.73 mJy. Using this value, we found that the mid-infrared flux density, if due to star formation, only contributes about 2.7% to the optically thin emission detected in AT20G measurements (rest frequency ∼10–40 GHz and core flux density ∼65 mJy). Hereafter, we consider the entire flux density of this quasar as measured in the AT20G survey to be associated with the AGN, that is, the radio core.
The detected H I 21 cm absorption may stem from gas within the circumnuclear disk, it might arise from kinematically disturbed gas affected by AGN or stellar feedback, or it might originate in the regularly rotating gas within the galactic disk. Depending on the location, extent, and clumpiness of the gas, it may cover the radio emission only partially. Due to its central location, the detection of absorption toward the radio core or the absence of it can provide crucial constraints on the origin of the absorbing gas (see e.g., Carilli et al. 1998; Gupta et al. 2022). In the case of J2339−5523, the contribution of the radio core to the detected 21 cm absorption primarily depends on its brightness near the 21 cm line frequency and on the actual column density of the gas. For a given column density and covering factor, the strength of the H I 21 cm absorption toward the core can be suppressed in the following two ways: (i) suppression of the background radio continuum due to free-free absorption (FFA) or synchrotron self-absorption (SSA), or (ii) excitation mechanisms that increase the spin temperature of the gas, especially due to the proximity to the AGN.
For the modification of radio SED, both FFA and SSA may provide viable solutions. In the latter case, however, the models strongly depend on the flux density and the frequency of the low-frequency turnover, and also on the size of the radio sources (e.g., Orienti & Dallacasa 2012; Callingham et al. 2015; Shao et al. 2022). Since we do not have observational constraints on either of these, we considered the viability of a simple homogeneous FFA scenario (Bicknell et al. 1997). To verify this, we assumed that the determination of radio SED is not affected by temporal variability. This is a reasonable assumption considering that a single power-law model can provide a reasonable fit (α = −0.71 ± 0.01) to GLEAM, SUMSS, and MALS L- and UHF-band measurements spread over more than 20 years (see the left panel of Fig. 4).
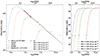 |
Fig. 4. Spectral energy distribution (SED) of the compact quasar (J2339−5523) and its flat-spectrum core component. Left panel: SED of J2339−5523 obtained by combining measurements from GLEAM (red circles), the MALS L- and UHF-bands (blue circles), SUMSS (brown plus), and the AT20G catalog (magenta circles). A power-law (Sν ∝ να) fit (dashed black line) to the MALS and GLEAM flux densities yields a spectral index, α = −0.71 ± 0.01. The dotted lines represent the SED attenuated by FFA due to a range of emission measures. Right panel: attenuation of the flat-spectrum core component due to FFA for a range of emission measures. In both panels, asterisks represent νp (see Sect. 3.3). |
The attenuation, that is, the optical depth, due to FFA is related to the electron temperature (Te) in Kelvin, to the frequency (ν) in GHz, and to the free electron density (ne) in cm−3 through
![$$ \begin{aligned} \tau _\nu = 8.24\times 10^{-2} \left[\frac{T_{\rm e}}{\text{ K}}\right]^{-1.35} \times \left[\frac{\nu }{\text{ GHz}}\right]^{-2.1} \times \left[\frac{\text{ EM}}{\text{ pc} \text{ cm}^{-6}}\right], \end{aligned} $$](/articles/aa/full_html/2024/07/aa48464-23/aa48464-23-eq10.gif)
where EM =  is the emission measure, and l is the distance through the screen in pc (Mezger & Henderson 1967). In the left panel of Fig. 4, we also show the observed SED attenuated by the FFA optical depth, τν = (ν/νp)−2.1, where νp is the frequency at which the FFA optical depth is 1. We assumed Te = 104 K. At the lowest-frequency measurements from GLEAM, no signature of flattening in the radio SED is observed. This implies that any external screen covering the radio source has an emission measure of < 2 × 10³ pc cm−6 (see the dotted blue curve in the left panel of Fig. 4).
However, it is possible that the radio core is embedded in a denser environment. In the right panel of Fig. 4, we show the attenuation of the radio core flux density due to FFA. Clearly, an external ionized screen with an emission measure (EM ∼ 107 pc cm−6) is required to attenuate the continuum flux density of the flat-spectrum core component at the redshifted H I 21 cm line frequency to a few mJy such that it does not produce detectable 21 cm absorption. The unresolved emission from the source does not allow us to further investigate the scenario in which the core is attenuated by FFA. Hence, while the suppression due to FFA cannot be completely ruled out, the nondetection (log N(He I)\cm−2 < 13.8) of associated UV absorption signatures in the optical spectrum (Fig. 3) points toward the simplest scenario in which no high H I column (N(H I) > 1017 cm−2) is present toward the radio core and optical AGN, regardless of whether the core is attenuated by FFA. The optical/UV observations also rule out the possibility of a high-Ts H I gas in front of the radio core. In the absence of any direct constraints on the morphology of the radio source, hereafter, we assume it to possess the canonical structure comprising a radio core with lobes on its either side, which is viewed close to the jet axis.
4. Properties of absorbing gas: Is J2339−5523 unique?
The properties of H I 21 cm absorption associated with radio sources are known to be related to the orientation and size of the source. Among compact radio sources (< 15 kpc), the detection rates are found to be significantly lower for quasars than radio galaxies (Gupta & Saikia 2006). This is consistent with the unification scheme, implying that the lines of sight to the radio components for quasars more frequently pass through the ionization cone, which is in general devoid of cold gas (see Fig. 5). Trace molecular gas has been detected through these channels as well, however (Noterdaeme et al. 2021). The jet axis is not always perfectly aligned with respect to the circumnuclear disk (Ruffa et al. 2020), and a jet-ISM interaction may also push the gas over a wider range of angles, forming a cocoon, thereby increasing its covering factor for absorption (Wagner et al. 2012; Mukherjee et al. 2016). Additionally, this jet-ISM interaction can also cause the development of the strong large-scale outflows, which can entrain a large amount of the gas and facilitate the formation of the cold gas by condensation of the medium in the envelope of the shocked gas (e.g., Villar-Martín et al. 1999; Morganti 2017). These factors along with the intrinsic misalignment in the radio morphology may produce H I 21 cm absorption in some of these cases (e.g., Gupta et al. 2022).
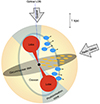 |
Fig. 5. Cartoon depicting quasar and radio galaxy views of an AGN. The H I clouds in yellow are located in the circumnuclear disk, and the clouds in blue are offset from the disk plane. The optical line of sight is indicated by the dashed blue line, sampling only little of the H I clouds. The sight lines to the quasars primarily pass through photoionization cone and sample cold gas closer to the jet axis and inner circumnuclear disk. The receding lobe would sample both positive and negative velocities corresponding to blue clouds. The galaxy view, with a weak core, primarily samples cold gas from blue clouds (negative velocities) in front of the lobes and the galaxy-wide ISM outside the photoionization cone. |
At optical wavelengths, the detection of H I clouds can be tricky because of leaking Ly-α emission (e.g. Finley et al. 2013; Fathivavsari et al. 2018), but the presence of cold gas in the quasar environment can be revealed by H2 absorption toward the central engine (Noterdaeme et al. 2019). In these cases, large molecular reservoirs likely in the host galaxy are also frequently seen from CO emission (e.g., Dasyra & Combes 2012; Noterdaeme et al. 2023). At redshifted 21 cm line frequencies, the prominent jets and lobes along with the radio core provide multiple sight lines to more efficiently sample the distribution and kinematics of gas in the circumnuclear disk and host galaxy ISM (see Fig. 5).
In the literature, H I 21 cm absorption detections associated with 15 quasars have been reported (see Table A.1). They form a very heterogeneous sample that spans a wide range in redshift (zem = 0.2–3.5) and 1.4 GHz spectral luminosity (L1.4 GHz = 1026−29 W Hz−1). The quasars were observed with varied spectral resolution in terms of Δv (0.54–31.3 km s−1 ) and optical depth sensitivity (τ1σ). These basic properties are listed in Table A.1, and their distributions are shown in Fig. 6. We smoothed all the spectra to a common velocity resolution of ∼30 km s−1 and measured the following two quantities as proxies for gas kinematics from the absorption profiles: (i) ΔVnull, that is, width between the nulls of the absorption profile (in km s−1 ) indicating the velocity spread of the absorbing gas; and, (ii) Ap = |Vnull, B|−|Vnull, R| to quantify the blue- or redward asymmetry in the line profile. To measure ΔVnull, we fit the smoothed absorption profile using multiple Gaussians and determined nulls as velocities when the fitted profile fell below 1σ optical depth sensitivity. In Table A.1, we provide the blueward (Vnull, B) and redward (Vnull, R) null velocities with respect to the 21 cm absorption peak. From these, ΔVnull can be obtained using ΔVnull = |Vnull, B − Vnull, R|. For J2339−5523, ΔVnull = 397 km s−1 is typical of the quasar sample. However, the profile is slightly redshifted with an absorption peak at ∼200 km s−1 (Fig. 2). The absorption component G1 is consistent with the systemic velocity and may represent clouds in the circumnuclear disk. The redshifted component G0 may then correspond to inflowing gas. This simplistic interpretation is compromised by the simultaneous possibility of multiple origins of the gas, however (Combes & Gupta 2024).
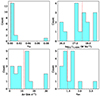 |
Fig. 6. Distribution of τ1σ (top left), radio luminosity at 1.4 GHz (L1.4 GHz in W Hz−1; top right), spectral resolution (Δv in km s−1; bottom left), and redshift (zem; bottom right) for the sample of 16 quasars (including J2339−5523) with associated H I 21 cm detections. The vertical dotted lines indicate the median values of each parameter on the x-axis. |
We investigated the origin of the absorbing gas by comparing the H I absorption properties of the quasar sample with a sample of 19 radio-galaxies from the literature (Vermeulen et al. 2003; Aditya 2019), matched in 1.4 GHz luminosity with the quasar sample and have an associated H I 21 cm absorption detection. The details are provided in Table B.1. For the quasar sample, we find a significant correlation between L1.4 GHz and ΔVnull (Kendall’s tau coefficient, r = 0.65 and p-value = 2 × 10⁻⁴). The corresponding scatter plot is shown in Fig. 7a. Interestingly, ΔVnull for radio galaxies exhibits no correlation (r = −0.08; p-value = 0.68; Fig. 7b). However, the extent of the absorption lines is similar to that of the quasar sample (Figs. 7c–f). The galaxies show marginally larger ΔVnull (KS test p-value = 0.70) and blueshifts (KS test p-value = 0.37) measured with respect to optical redshifts. We do not find any significant correlations between |Ap| and L1.4 GHz either for quasars and galaxies. However, between |Ap| and ΔVnull a moderate correlation for quasars and a relatively stronger correlation for galaxies is observed. The Kendall tau-coefficients and p-values for quasars and galaxies are 0.48 and 0.008, and 0.60 and 0.0001, respectively. This suggests that broader lines associated with powerful AGN (L1.4 GHz > 1026 W Hz−1) may also be more asymmetric, as seen among relatively less powerful AGN (L1.4 GHz = 1024−26 W Hz−1; Maccagni et al. 2017).
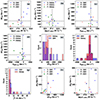 |
Fig. 7. Distributions of various observables associated with the H I 21 cm absorption line and radio continuum associated with quasars (16) and radio galaxies (19). Different symbols and colors are used for systems with different radio SEDs: steep spectrum (S, filled blue circles), peaked spectrum (P, filled green diamonds) and flat spectrum (F, filled red triangles). In all the panels, the dotted lines mark the median. The location of J2339−5523, a steep-spectrum source, is shown using a five-point star. |
The quasars and radio galaxies with different radio SEDs, that is, steep spectrum (S; α ≤ −0.5), peaked spectrum (P; turnover at GHz frequencies), and flat spectrum (F; α > −0.5), are also distinguished in Fig. 7. The spectral classifications provide important information on both the size and nature of the background radio emission. Radio sources with higher turnover frequencies are more compact, and vice versa, flatter spectra indicate a dominant core component, while emission from older population of electrons (e.g., lobes) gives rise to steeper spectra. Generally, core-dominated and peaked-spectrum sources have smaller projected largest linear sizes (LLS) estimated from milliarcsecond-scale images (see Tables A.1 and B.1). However, we note that LLS have been estimated using high-frequency (> 2.3 GHz) milliarcsecond-scale images and present only a very approximate picture of radio emission close to the H I 21 cm line frequencies. Nevertheless, we find no significant correlation between LLS and ΔVnull for the quasar sample (r = 0.27 ; p-value = 0.17), indicating that the observed L1.4 GHz and ΔVnull relation is not affected by other observables such as the LLS (see Fig. 9 of Gupta et al. 2012).
The luminosity (L1.4 GHz) and redshift are strongly correlated in the quasar sample. A varying optical depth sensitivity in a given sample, either due to the selection of brighter AGNs or poor spectral rms, may also affect the measurements of ΔVnull and Ap. A Kendall tau test for the quasars indicates a weak anticorrelation, with a statistical significance lower than 2σ (tau = −0.35, p-value = 0.07). This suggests that sensitivity issues due to Malmquist bias affect our results very little, as illustrated in Fig. 8. We note that 14 out of the 16 systems (∼88%) in the quasar sample exhibit optical depth sensitivities within 1σ of the median sensitivity (Fig. 6). We investigated the potential biases due to optical depth sensitivity by dividing the quasar sample into two equal groups at median τ1σ, 30. We then upscaled the rms noise in the spectra with better sensitivities to match the common median τ1σ, 30 of the lower-sensitivity subset. This rendered absorption profiles of 5 systems unsuitable for the analysis. The remaining 11 systems still exhibit a correlation between ΔVnull and L1.4 GHz (tau = 0.56, p-value = 0.01). However, the weaker correlation between ΔVnull and |Ap| seen in Fig. 7h disappeared. We were unable to perform a similar detailed investigation for the sample of radio galaxies due to the unavailability of adequate information in the literature. However, since these are generally bright radio sources, we do not expect any additional biases, except due to any intrinsic redshift evolution among quasars (zmedian = 0.7) and radio galaxies (zmedian = 0.4).
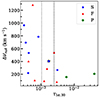 |
Fig. 8. Velocity width between the nulls of the absorption profiles, ΔVnull (in km s−1) as a function of τ1σ, 30 for all the 16 quasars listed in Table A.1. The markers and dotted vertical lines are same as in Fig. 7. The dashed vertical line marks the median τ1σ, 30 of higher τ1σ, 30 bin. |
Overall, the correlation of L1.4 GHz and ΔVnull among powerful quasars but not radio galaxies suggests that the orientation of the AGN may play an important role in the observed gas properties. As illustrated in Fig. 5, in the radio-galaxy view, the sight lines toward the radio lobes would be effective in tracing the kinematically disturbed gas within the cocoon created by the jet-ISM interaction and galaxy-wide ISM outside the photoionization cone. In the quasar view, the jet axis is closely aligned with the line of sight. Therefore, a significant portion of the absorbing clouds, particularly at extreme velocities, may (scenario 1) originate from the inner circumnuclear disk and experience the strong gravitational field of the central black hole, or (scenario 2) may be perturbed by energy output associated with radio jets. Since powerful AGN are associated with massive red galaxies (e.g., Goulding et al. 2014), the role of starbursts in gas perturbations may be ignored. The conclusion is also supported by the mid-infrared colors of AGN considered here (see Wright et al. 2010). In line with scenario 1, the integrated optical depths toward quasars that probe the inner regions of the galaxy with a higher filling factor of cold gas are also marginally higher (Fig. 7g; KS test p-value = 0.05). Figure 5 illustrates that in the quasar view (scenario 2), the sight line toward the receding lobe may trace both inflowing and outflowing clouds (< 1 kpc for the sample), exhibiting positive and negative velocities, respectively, thereby resulting in symmetric line profiles. This may explain the less asymmetric absorption lines observed in the case of quasars and the broader or more blueshifted absorption profiles observed among radio galaxies. Scenario 1 assumes that more powerful quasars at higher redshifts in the sample are associated with more massive black holes. While this cannot be ruled out (Labita et al. 2009), a larger complete sample observed with uniform sensitivity is required to draw conclusions.
Interestingly, despite the incompleteness of the sample and the nonuniform quality and wavelength coverage of the radio spectra, the case of J2339−5523 does not appear unique. In all of the above, it is interesting to note that J2339−5523 exhibits typical properties among quasars with H I 21 cm absorption (see the five-pointed star in Fig. 7).
Finally, we examined the generality of the discrepancy between radio and optical sight lines in the case of J2339−5523 using the samples in Tables A.1 and B.1. Optical spectra are available for five quasars (see Table A.2). In only one case are absorption lines of Mg II and Mg I, indicators of high-N(H I) gas, detected. Among the remaining four cases, no absorption is detected. Even in the case of J080133.56+141443.0, although strong Mg II doublets as well as Mg I absorption lines are detected in the SDSS DR6 spectrum (Adelman-McCarthy et al. 2008), the radio core is self-absorbed at the frequency of the H I 21 cm absorption (Ishwara-Chandra et al. 2003). Hence, toward J0801+1414, the cold gas seen in the 21 cm absorption is not against the radio core and does not correspond to the gas that produces the metal absorption in the optical spectrum.
Optical spectra adequate to search for absorption lines are available for 7 out of 19 radio galaxies (see Table A.2) In all the cases, the signatures of cold gas through the absorption lines of Ca IIλλ3934,3969 and/or Na Iλλ5891,5897 are reliably detected. The peak absorption in 5 out of 6 cases also matches the H I 21 cm absorption well. The increased occurrence of a concurrent cold-gas detection in both radio and optical observations for radio galaxies suggests that they both trace the same population of clouds in the less clumpy outer regions of the galaxy.
5. Summary
We have reported the detection of H I 21 cm absorption associated with the quasar J2339−5523 at z = 1.3531. These detections are rare, and only six quasars are known at 1 < z < 2. The detected absorption profile is wide, with a velocity width between nulls of ΔVnull = 397 km s−1. However, the profile is slightly redshifted, with an absorption peak at ∼200 km s−1 (Fig. 2). Assuming Ts = 100 K and fc = 1, we derived a lower limit to N(H I) ≥ 6.7 × 1020 cm−2. Interestingly, the FUV and optical spectra toward this source obtained using HST/COS and MIKE spectrographs, respectively, do not reveal any signature of metal absorption. The simplest explanation would be that no high H I column (N(H I) > 1017 cm−2) is present toward the radio core and the optical AGN.
Based on the joint optical and radio analysis of a heterogeneous sample of 16 quasars (zmedian = 0.7) and 19 radio galaxies (zmedian = 0.4) with H I 21 cm absorption and matched in 1.4 GHz luminosity (L1.4 GHz > 1026 W Hz−1), a consistent picture emerges according to which powerful quasars that exhibit a correlation between L1.4 GHz and ΔVnull trace the gas in the inner circumnuclear disk and/or clouds close to the jet axis that is perturbed by the jet-ISM interaction. Consistent with this, the integrated optical depths toward quasars probing the inner regions of the galaxy with a higher filling factor of cold gas are also marginally higher. In contrast, the radio galaxies have absorption lines of similar extent, but exhibit no correlation with the L1.4 GHz. These absorbers most likely trace the gas from the extended cocoon that is created by the jet-ISM interaction and the galaxy-wide ISM outside the photoionization cone. The absorption associated with them is also marginally broader, more asymmetric, and blueshifted with respect to the systemic velocity. While these data exhibit the different origins of absorbing gas detected in quasars and radio galaxies, a larger complete sample observed with uniform sensitivity is required for an exact interpretation.
The H I 21 cm absorption detection toward J2339−5523 and the analysis presented here demonstrate the potential of radio spectroscopic observations, even when they are spatially unresolved, to reveal the origin of the absorbing gas through multiple sight lines toward core, jet, and lobes. In the near future, a clearer picture of the origin and structure of the absorbing gas will emerge from the larger samples from the ongoing surveys (Gupta et al. 2017; Allison et al. 2022; Hu et al. 2023). Specifically, in the near future, bright radio sources from MALS will reveal the evolution of cold gas associated with a variety of AGN at 0 < z < 1.5 (Deka et al. 2024).
Acknowledgments
We thank an anonymous referee for useful comments. The MeerKAT telescope is operated by the South African Radio Astronomy Observatory, which is a facility of the National Research Foundation, an agency of the Department of Science and Innovation. The MeerKAT data were processed using the MALS computing facility at IUCAA (https://mals.iucaa.in/). EB acknowledges support by NASA under award number 80GSFC21M0002. The National Radio Astronomy Observatory is a facility of the National Science Foundation operated under cooperative agreement by Associated Universities, Inc. This paper includes data gathered with the 6.5 meter Magellan Telescopes located at Las Campanas Observatory, Chile. This paper has utilized data from the Cosmic Origins Spectrograph (COS) onboard HST. This research has made use of NASA’s Astrophysics Data System and the NASA/IPAC Extragalactic Database (NED), which is operated by the Jet Propulsion Laboratory, California Institute of Technology, under contract with the National Aeronautics and Space Administration.
References
- Adelman-McCarthy, J. K., Agüeros, M. A., Allam, S. S., et al. 2008, ApJS, 175, 297 [NASA ADS] [CrossRef] [Google Scholar]
- Aditya, J. N. H. S. 2019, MNRAS, 482, 5597 [Google Scholar]
- Aditya, J. N. H. S., & Kanekar, N. 2018a, MNRAS, 473, 59 [NASA ADS] [CrossRef] [Google Scholar]
- Aditya, J. N. H. S., & Kanekar, N. 2018b, MNRAS, 481, 1578 [NASA ADS] [CrossRef] [Google Scholar]
- Aditya, J. N. H. S., Kanekar, N., Prochaska, J. X., et al. 2017, MNRAS, 465, 5011 [NASA ADS] [CrossRef] [Google Scholar]
- Aditya, J. N. H. S., Jorgenson, R., Joshi, V., et al. 2021, MNRAS, 500, 998 [Google Scholar]
- Albareti, F. D., Allende Prieto, C., Almeida, A., et al. 2017, ApJS, 233, 25 [Google Scholar]
- Allison, J. R., Sadler, E. M., Amaral, A. D., et al. 2022, PASA, 39 [CrossRef] [Google Scholar]
- Bernstein, R., Shectman, S. A., Gunnels, S. M., Mochnacki, S., & Athey, A. E. 2003, in Instrument Design and Performance for Optical/Infrared Ground-based Telescopes, eds. M. Iye, & A. F. M. Moorwood, SPIE Conf. Ser., 4841, 1694 [NASA ADS] [CrossRef] [Google Scholar]
- Bianchi, L., Shiao, B., & Thilker, D. 2017, ApJS, 230, 24 [Google Scholar]
- Bicknell, G. V., Dopita, M. A., & O’Dea, C. P. O. 1997, ApJ, 485, 112 [NASA ADS] [CrossRef] [Google Scholar]
- Boettcher, E., Gupta, N., Chen, H.-W., et al. 2022, ApJ, 926, L33 [NASA ADS] [CrossRef] [Google Scholar]
- Britzen, S., Vermeulen, R. C., Taylor, G. B., et al. 2007, A&A, 472, 763 [NASA ADS] [CrossRef] [EDP Sciences] [Google Scholar]
- Callingham, J. R., Gaensler, B. M., Ekers, R. D., et al. 2015, ApJ, 809, 168 [Google Scholar]
- Carilli, C. L., & van Gorkom, J. H. 1992, ApJ, 399, 373 [CrossRef] [Google Scholar]
- Carilli, C. L., Wrobel, J. M., & Ulvestad, J. S. 1998, AJ, 115, 928 [NASA ADS] [CrossRef] [Google Scholar]
- Chen, H.-W., Zahedy, F. S., Boettcher, E., et al. 2020, MNRAS, 497, 498 [NASA ADS] [CrossRef] [Google Scholar]
- Combes, F., & Gupta, N. 2024, A&A, 683, A20 [NASA ADS] [CrossRef] [EDP Sciences] [Google Scholar]
- Combes, F., Gupta, N., Muller, S., et al. 2021, A&A, 648, A116 [NASA ADS] [CrossRef] [EDP Sciences] [Google Scholar]
- Croton, D. J., Springel, V., White, S. D. M., et al. 2006, MNRAS, 365, 11 [Google Scholar]
- Curran, S. J., & Whiting, M. T. 2012, ApJ, 759, 117 [NASA ADS] [CrossRef] [Google Scholar]
- Cutri, R. M., Wright, E. L., Conrow, T., et al. 2014, VizieR Online Data Catalog: II/328 [Google Scholar]
- Dasyra, K. M., & Combes, F. 2012, A&A, 541, L7 [NASA ADS] [CrossRef] [EDP Sciences] [Google Scholar]
- Deka, P. P., Gupta, N., Jagannathan, P., et al. 2024, ApJS, 270, 33 [NASA ADS] [CrossRef] [Google Scholar]
- Deller, A. T., & Middelberg, E. 2014, AJ, 147, 14 [Google Scholar]
- Ellison, S. L., Yan, L., Hook, I. M., et al. 2002, A&A, 383, 91 [NASA ADS] [CrossRef] [EDP Sciences] [Google Scholar]
- Ellison, S. L., Prochaska, J. X., Hennawi, J., et al. 2010, MNRAS, 406, 1435 [NASA ADS] [Google Scholar]
- Fabian, A. C. 2012, ARA&A, 50, 455 [Google Scholar]
- Fathivavsari, H., Petitjean, P., Jamialahmadi, N., et al. 2018, MNRAS, 477, 5625 [NASA ADS] [CrossRef] [Google Scholar]
- Fey, A. L., & Charlot, P. 2000, ApJS, 128, 17 [NASA ADS] [CrossRef] [Google Scholar]
- Field, G. B. 1958, Proc. IRE, 46, 240 [NASA ADS] [CrossRef] [Google Scholar]
- Finley, H., Petitjean, P., Pâris, I., et al. 2013, A&A, 558, A111 [NASA ADS] [CrossRef] [EDP Sciences] [Google Scholar]
- Geréb, K., Maccagni, F. M., Morganti, R., & Oosterloo, T. A. 2015, A&A, 575, A44 [CrossRef] [EDP Sciences] [Google Scholar]
- Goulding, A. D., Forman, W. R., Hickox, R. C., et al. 2014, ApJ, 783, 40 [Google Scholar]
- Grasha, K., Darling, J., Bolatto, A., Leroy, A. K., & Stocke, J. T. 2019, ApJS, 245, 3 [NASA ADS] [CrossRef] [Google Scholar]
- Green, J. C., Froning, C. S., Osterman, S., et al. 2012, ApJ, 744, 60 [NASA ADS] [CrossRef] [Google Scholar]
- Gupta, N., & Saikia, D. J. 2006, MNRAS, 370, 738 [NASA ADS] [CrossRef] [Google Scholar]
- Gupta, N., Salter, C. J., Saikia, D. J., Ghosh, T., & Jeyakumar, S. 2006, MNRAS, 373, 972 [NASA ADS] [CrossRef] [Google Scholar]
- Gupta, N., Srianand, R., Petitjean, P., et al. 2012, A&A, 544, A21 [NASA ADS] [CrossRef] [EDP Sciences] [Google Scholar]
- Gupta, N., Srianand, R., Baan, W., et al. 2017, arXiv e-prints [arXiv:1708.07371] [Google Scholar]
- Gupta, N., Jagannathan, P., Srianand, R., et al. 2021a, ApJ, 907, 11 [Google Scholar]
- Gupta, N., Srianand, R., Shukla, G., et al. 2021b, ApJS, 255, 28 [NASA ADS] [CrossRef] [Google Scholar]
- Gupta, N., Srianand, R., Momjian, E., et al. 2022, ApJ, 927, L24 [NASA ADS] [CrossRef] [Google Scholar]
- Helmboldt, J. F., Taylor, G. B., Tremblay, S., et al. 2007, ApJ, 658, 203 [NASA ADS] [CrossRef] [Google Scholar]
- Hu, W., Wang, Y., Li, Y., et al. 2023, A&A, 675, A40 [NASA ADS] [CrossRef] [EDP Sciences] [Google Scholar]
- Ishwara-Chandra, C. H., Dwarakanath, K. S., & Anantharamaiah, K. R. 2003, J. Astrophys. Astron., 24, 37 [NASA ADS] [CrossRef] [Google Scholar]
- Kanekar, N., & Chengalur, J. N. 2008, MNRAS, 384, L6 [CrossRef] [Google Scholar]
- Labita, M., Decarli, R., Treves, A., & Falomo, R. 2009, MNRAS, 399, 2099 [NASA ADS] [CrossRef] [Google Scholar]
- Lawrence, C. R., Zucker, J. R., Readhead, A. C. S., et al. 1996, ApJS, 107, 541 [NASA ADS] [CrossRef] [Google Scholar]
- Liu, X., Cui, L., Luo, W. F., Shi, W. Z., & Song, H. G. 2007, A&A, 470, 97 [NASA ADS] [CrossRef] [EDP Sciences] [Google Scholar]
- Maccagni, F. M., Morganti, R., Oosterloo, T. A., Geréb, K., & Maddox, N. 2017, A&A, 604, A43 [NASA ADS] [CrossRef] [EDP Sciences] [Google Scholar]
- Mahony, E. K., Morganti, R., Emonts, B. H. C., Oosterloo, T. A., & Tadhunter, C. 2013, MNRAS, 435, L58 [NASA ADS] [CrossRef] [Google Scholar]
- Malkin, Z. 2018, ApJS, 239, 20 [Google Scholar]
- Maloney, P. R., Hollenbach, D. J., & Tielens, A. G. G. M. 1996, ApJ, 466, 561 [Google Scholar]
- McMullin, J. P., Waters, B., Schiebel, D., Young, W., & Golap, K. 2007, in Astronomical Data Analysis Software and Systems XVI, eds. R. A. Shaw, F. Hill, & D. J. Bell, ASP Conf. Ser., 376, 127 [Google Scholar]
- Mezger, P. G., & Henderson, A. P. 1967, ApJ, 147, 471 [Google Scholar]
- Morganti, R. 2017, Front. Astron. Space Sci., 4, 42 [CrossRef] [Google Scholar]
- Morganti, R., & Oosterloo, T. 2018, A&ARv, 26, 4 [Google Scholar]
- Morganti, R., Oosterloo, T. A., Tadhunter, C. N., van Moorsel, G., & Emonts, B. 2005a, A&A, 439, 521 [NASA ADS] [CrossRef] [EDP Sciences] [Google Scholar]
- Morganti, R., Tadhunter, C. N., & Oosterloo, T. A. 2005b, A&A, 444, L9 [NASA ADS] [CrossRef] [EDP Sciences] [Google Scholar]
- Mukherjee, D., Bicknell, G. V., Sutherland, R., & Wagner, A. 2016, MNRAS, 461, 967 [NASA ADS] [CrossRef] [Google Scholar]
- Murphy, T., Sadler, E. M., Ekers, R. D., et al. 2010, MNRAS, 402, 2403 [Google Scholar]
- Murphy, E. J., Bremseth, J., Mason, B. S., et al. 2012, ApJ, 761, 97 [Google Scholar]
- Noterdaeme, P., Balashev, S., Krogager, J. K., et al. 2019, A&A, 627, A32 [NASA ADS] [CrossRef] [EDP Sciences] [Google Scholar]
- Noterdaeme, P., Balashev, S., Krogager, J. K., et al. 2021, A&A, 646, A108 [EDP Sciences] [Google Scholar]
- Noterdaeme, P., Balashev, S., Cuellar, R., et al. 2023, A&A, 673, A89 [NASA ADS] [CrossRef] [EDP Sciences] [Google Scholar]
- O’Dea, C. P., & Saikia, D. J. 2021, A&ARv, 29, 3 [Google Scholar]
- Orienti, M., & Dallacasa, D. 2012, MNRAS, 424, 532 [Google Scholar]
- Pihlström, Y. M., Vermeulen, R. C., Taylor, G. B., & Conway, J. E. 1999, ApJ, 525, L13 [CrossRef] [Google Scholar]
- Pihlström, Y. M., Conway, J. E., & Vermeulen, R. C. 2003, A&A, 404, 871 [NASA ADS] [CrossRef] [EDP Sciences] [Google Scholar]
- Planck Collaboration VI. 2020, A&A, 641, A6 [NASA ADS] [CrossRef] [EDP Sciences] [Google Scholar]
- Polatidis, A. G., Wilkinson, P. N., Xu, W., et al. 1995, ApJS, 98, 1 [NASA ADS] [CrossRef] [Google Scholar]
- Qu, Z., Chen, H.-W., Rudie, G. C., et al. 2023, MNRAS, 524, 512 [NASA ADS] [CrossRef] [Google Scholar]
- Ruffa, I., Laing, R. A., Prandoni, I., et al. 2020, MNRAS, 499, 5719 [NASA ADS] [CrossRef] [Google Scholar]
- Sanghera, H. S., Saikia, D. J., Luedke, E., et al. 1995, A&A, 295, 629 [NASA ADS] [Google Scholar]
- Shao, Y., Wagg, J., Wang, R., et al. 2022, A&A, 659, A159 [NASA ADS] [CrossRef] [EDP Sciences] [Google Scholar]
- Sokolovsky, K. V., Kovalev, Y. Y., Pushkarev, A. B., Mimica, P., & Perucho, M. 2011, A&A, 535, A24 [NASA ADS] [CrossRef] [EDP Sciences] [Google Scholar]
- Torrealba, J., Chavushyan, V., Cruz-González, I., et al. 2012, Rev. Mex. Astron. Astrofis., 48, 9 [NASA ADS] [Google Scholar]
- Veilleux, S., Maiolino, R., Bolatto, A. D., & Aalto, S. 2020, A&ARv, 28, 2 [NASA ADS] [CrossRef] [Google Scholar]
- Vermeulen, R. C., Pihlström, Y. M., Tschager, W., et al. 2003, A&A, 404, 861 [NASA ADS] [CrossRef] [EDP Sciences] [Google Scholar]
- Véron-Cetty, M. P., & Véron, P. 2001, A&A, 374, 92 [NASA ADS] [CrossRef] [EDP Sciences] [Google Scholar]
- Villar-Martín, M., Tadhunter, C., Morganti, R., Axon, D., & Koekemoer, A. 1999, MNRAS, 307, 24 [CrossRef] [Google Scholar]
- Wagner, A. Y., Bicknell, G. V., & Umemura, M. 2012, ApJ, 757, 136 [CrossRef] [Google Scholar]
- Wright, E. L., Eisenhardt, P. R. M., Mainzer, A. K., et al. 2010, AJ, 140, 1868 [Google Scholar]
Appendix A: List of quasars from the literature
Here we present the properties of quasars selected from the literature. Table A.1 provides radio continuum and H I 21 cm absorption line details. The details from optical spectra are provided in Table A.2.
Quasars with H I 21 cm absorption from literature.
Rest equivalent width (Wr in Å) estimates from optical spectra.
Appendix B: List of radio galaxies from the literature
Here we present the properties of radio galaxies selected from the literature and matched in L1.4 GHz with the quasar sample. Table B.1 provides radio continuum and H I 21 cm absorption line details. The details from optical spectra are provided in Table A.2.
Radio galaxy sample with H I 21 cm absorption from literature.
All Tables
All Figures
|
Fig. 1. Portion of the larger (6k × 6k pixels) MeerKAT Stokes-I continuum images centered on the quasar J2339−5523. The background is the UHF-band image at 580.1 MHz (SPW0). The contour levels are n × ( − 1, 1, 2, 4, 8, 16, ...), where n = 1.0 mJy beam−1 (cyan) and 0.15 mJy beam−1 (red) for the UHF- and L-band images at 580.1 MHz (SPW0) and 1642.3 MHz (SPW14), respectively. The restoring beams are shown as ellipses in the bottom left corner of the image. The shapes of the cyan and red contours simply follow the corresponding restoring beams, as expected for the unresolved emission (see text for details). |
| In the text | |
|
Fig. 2. H I 21 cm absorption associated with J2339−5523. Zero velocity corresponds to zem = 1.3531. Individual Gaussian components (Table 1) and the combined best-fit model are overplotted as dashed (green) and continuous lines (red), respectively. The residuals from the fit (magenta curve) and the 1σ uncertainty on the normalized flux density (shaded region in gray), arbitrarily offset for clarity, are also shown. |
| In the text | |
|
Fig. 3. Constraints on the UV absorption features for a subset of strong transitions commonly seen in quasar absorption-line surveys. Zero velocity corresponds to the quasar emission redshift zem = 1.3531. Contaminating features associated with systems in the foreground at z< zem are grayed out. At this redshift, H I Lyman series lines are redshifted out of the COS FUV spectral coverage. |
| In the text | |
|
Fig. 4. Spectral energy distribution (SED) of the compact quasar (J2339−5523) and its flat-spectrum core component. Left panel: SED of J2339−5523 obtained by combining measurements from GLEAM (red circles), the MALS L- and UHF-bands (blue circles), SUMSS (brown plus), and the AT20G catalog (magenta circles). A power-law (Sν ∝ να) fit (dashed black line) to the MALS and GLEAM flux densities yields a spectral index, α = −0.71 ± 0.01. The dotted lines represent the SED attenuated by FFA due to a range of emission measures. Right panel: attenuation of the flat-spectrum core component due to FFA for a range of emission measures. In both panels, asterisks represent νp (see Sect. 3.3). |
| In the text | |
|
Fig. 5. Cartoon depicting quasar and radio galaxy views of an AGN. The H I clouds in yellow are located in the circumnuclear disk, and the clouds in blue are offset from the disk plane. The optical line of sight is indicated by the dashed blue line, sampling only little of the H I clouds. The sight lines to the quasars primarily pass through photoionization cone and sample cold gas closer to the jet axis and inner circumnuclear disk. The receding lobe would sample both positive and negative velocities corresponding to blue clouds. The galaxy view, with a weak core, primarily samples cold gas from blue clouds (negative velocities) in front of the lobes and the galaxy-wide ISM outside the photoionization cone. |
| In the text | |
|
Fig. 6. Distribution of τ1σ (top left), radio luminosity at 1.4 GHz (L1.4 GHz in W Hz−1; top right), spectral resolution (Δv in km s−1; bottom left), and redshift (zem; bottom right) for the sample of 16 quasars (including J2339−5523) with associated H I 21 cm detections. The vertical dotted lines indicate the median values of each parameter on the x-axis. |
| In the text | |
|
Fig. 7. Distributions of various observables associated with the H I 21 cm absorption line and radio continuum associated with quasars (16) and radio galaxies (19). Different symbols and colors are used for systems with different radio SEDs: steep spectrum (S, filled blue circles), peaked spectrum (P, filled green diamonds) and flat spectrum (F, filled red triangles). In all the panels, the dotted lines mark the median. The location of J2339−5523, a steep-spectrum source, is shown using a five-point star. |
| In the text | |
|
Fig. 8. Velocity width between the nulls of the absorption profiles, ΔVnull (in km s−1) as a function of τ1σ, 30 for all the 16 quasars listed in Table A.1. The markers and dotted vertical lines are same as in Fig. 7. The dashed vertical line marks the median τ1σ, 30 of higher τ1σ, 30 bin. |
| In the text | |
Current usage metrics show cumulative count of Article Views (full-text article views including HTML views, PDF and ePub downloads, according to the available data) and Abstracts Views on Vision4Press platform.
Data correspond to usage on the plateform after 2015. The current usage metrics is available 48-96 hours after online publication and is updated daily on week days.
Initial download of the metrics may take a while.