Fig. 4.
Download original image
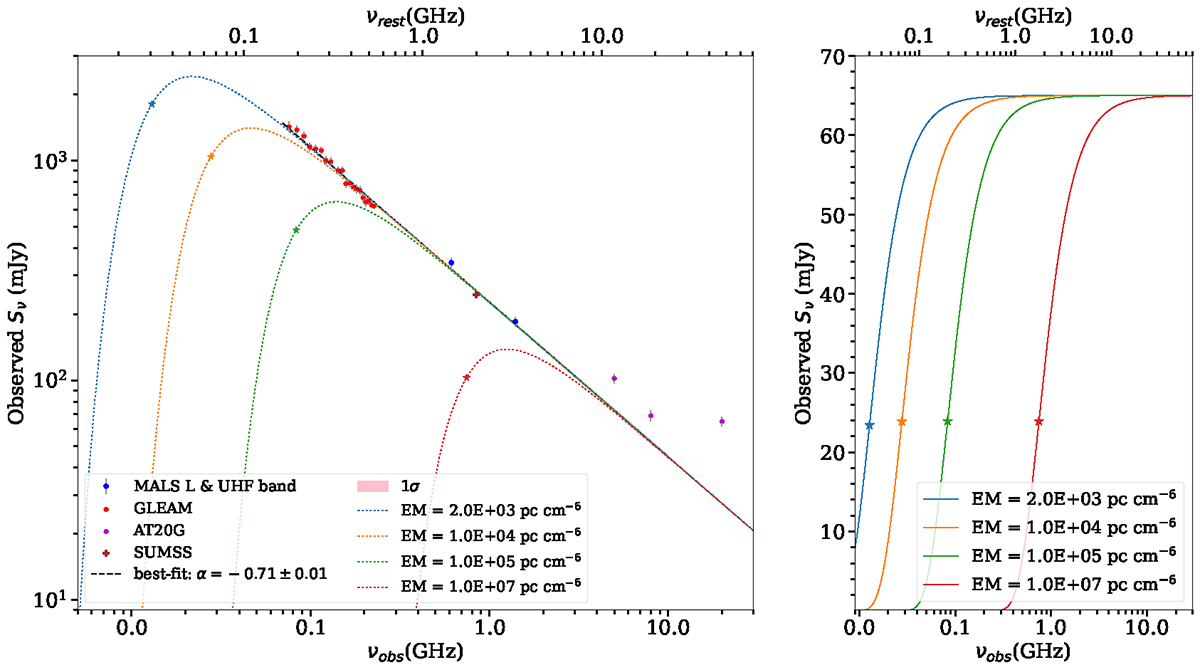
Spectral energy distribution (SED) of the compact quasar (J2339−5523) and its flat-spectrum core component. Left panel: SED of J2339−5523 obtained by combining measurements from GLEAM (red circles), the MALS L- and UHF-bands (blue circles), SUMSS (brown plus), and the AT20G catalog (magenta circles). A power-law (Sν ∝ να) fit (dashed black line) to the MALS and GLEAM flux densities yields a spectral index, α = −0.71 ± 0.01. The dotted lines represent the SED attenuated by FFA due to a range of emission measures. Right panel: attenuation of the flat-spectrum core component due to FFA for a range of emission measures. In both panels, asterisks represent νp (see Sect. 3.3).
Current usage metrics show cumulative count of Article Views (full-text article views including HTML views, PDF and ePub downloads, according to the available data) and Abstracts Views on Vision4Press platform.
Data correspond to usage on the plateform after 2015. The current usage metrics is available 48-96 hours after online publication and is updated daily on week days.
Initial download of the metrics may take a while.