| Issue |
A&A
Volume 682, February 2024
|
|
|---|---|---|
| Article Number | A36 | |
| Number of page(s) | 11 | |
| Section | Extragalactic astronomy | |
| DOI | https://doi.org/10.1051/0004-6361/202347665 | |
| Published online | 31 January 2024 | |
Massive black holes in nuclear star clusters
Investigation with SRG/eROSITA X-ray data★
1
Donostia International Physics Center,
Paseo Manuel de Lardizabal 4,
20118
Donostia-San Sebastián,
Spain
e-mail: This email address is being protected from spambots. You need JavaScript enabled to view it.
2
Max-Planck-Institut für Astronomie,
Königstuhl 17,
69117
Heidelberg,
Germany
3
Institute of Astronomy, Pontificia Universidad Católica de Chile,
Avenida Vicuña Mackena
4690,
Santiago,
Chile
4
Universität Heidelberg,
Seminarstrasse 2,
69117
Heidelberg,
Germany
5
Max-Planck-Institut für extraterrestrische Physik (MPE),
Giessenbachstrasse 1,
85748
Garching,
Germany
6
MIT Kavli Institute for Astrophysics and Space Research,
70 Vassar Street,
Cambridge,
MA
02139,
USA
7
Ikerbasque, Basque Foundation for Science,
48013
Bilbao,
Spain
Received:
7
August
2023
Accepted:
2
December
2023
Abstract
Context. Massive black holes (MBHs) are typically hosted in the centres of massive galaxies but they appear to become rarer in lower mass galaxies, where nuclear star clusters (NSCs) frequently appear instead. The transition region, where both an MBH and NSC can co-exist, has been poorly studied to date and only a few dozen galaxies are known to host them. One avenue for detecting new galaxies with both an MBH and NSC is to look for accretion signatures of MBHs.
Aims. Here, we use new SRG/eROSITA all-sky survey eRASS:4 data to search for X-ray signatures of accreting MBHs in NSCs, while also investigating their combined occupation fraction.
Methods. We collected more than 200 galaxies containing an NSC, spanning multiple orders in terms of galaxy stellar mass and morphological type, within the footprint of the German eROSITA Consortium survey. We determined the expected X-ray contamination from binary stellar systems using the galaxy stellar mass and star formation rate as estimated from far-ultraviolet and mid-infrared emission.
Results. We find significant detections for 18 galaxies (~8.3%), including one ultra-luminous X-ray source; however, only three galaxies (NGC 2903, 4212, and 4639) have X-ray luminosities that are higher than the expected value from X-ray binaries, indicative of the presence of an MBH. In addition, the X-ray luminosity of six galaxies (NGC 2903, 3384, 4321, 4365, 4639, and 4701) differs from previous studies and could indicate the presence of a variable active galactic nucleus. For NGC 4701 specifically, we find a variation of X-ray flux within the eRASS:4 data set. Stacking X-ray non-detected galaxies in the dwarf regime M*gal ≤ 109 M⊙) results in luminosity upper limits of a few times 1038 erg s−1. The combined occupation fraction of accreting MBHs and NSCs becomes non-zero for galaxy masses above ~ 107.5 M⊙ and this result is slightly elevated as compared to the literature data.
Conclusions. Our data extend, for the first time, towards the dwarf elliptical galaxy regime and identify promising MBH candidates for higher resolution follow-up observations. At most galaxy masses (and with the exception of three cases), the X-ray constraints are consistent with the expected emission from binary systems or an Eddington fraction of at most 0.01%, assuming a black holes mass of 106.5 M⊙. This work confirms the known complexities in similar-type of studies, while providing the appealing alternative of using X-ray survey data of in-depth observations of individual targets with higher resolution instruments.
Key words: galaxies: nuclei / galaxies: star clusters: general / X-rays: galaxies
Full Table 1 is available at the CDS website/ftp to cdsarc.cds.unistra.fr (130.79.128.5) or via https://cdsarc.cds.unistra.fr/viz-bin/cat/J/A+A/682/A36
NASA Einstein fellow.
© The Authors 2024
 Open Access article, published by EDP Sciences, under the terms of the Creative Commons Attribution License (https://creativecommons.org/licenses/by/4.0), which permits unrestricted use, distribution, and reproduction in any medium, provided the original work is properly cited.
This article is published in open access under the Subscribe to Open model. This email address is being protected from spambots. You need JavaScript enabled to view it. to support open access publication.
1 Introduction
Since the first detections of massive compact objects in nearby galaxy centres almost forty years ago (Tonry 1984), it has become evident that massive black holes (MBHs) occupy many nearby galaxy centres (e.g. Kormendy & Richstone 1995; Maggorian et al. 1998; Tremaine et al. 2002; Kormendy & Ho 2013). This insight was made possible by significant advancements in the performance and capabilities of many ground-based facilities, including NIRC on Keck (Ghez et al. 1998; Filippenko & Ho 2003; Walsh et al. 2012), SHARP on NTT (Genzel et al. 2000; Gillessen et al. 2009), GRAVITY (Abuter et al. 2017, 2021), SAURON (Bacon et al. 2001a; van den Bosch & de Zeeuw 2010), CFHT (Bender et al. 1996; Kormendy et al. 1997), SINFONI (Nowak et al. 2008; Rusli et al. 2011; Saglia et al. 2016), VLBI (Kuo et al. 2011), GEMINI/NIFS (Nguyen et al. 2018; Merrell et al. 2023), VLT (Marconi et al. 2001), and with the Hubble Space Telescope (HST; e.g. Gebhardt et al. 2003; Devereux et al. 2003; Atkinson et al. 2005; Gültekin et al. 2009; Walsh et al. 2010; Nguyen et al. 2019), as well as improvements in dynamical models of galaxy centres (e.g. Cappellari & Emsellem 2004; Cappellari 2020; Thater et al. 2019, 2022a, but see also Thater et al. 2022b and references therein). These measurements were only performed on massive galaxies as secure detections of MBHs towards the lowest galaxy masses become rare both because of weaker observational signatures and an apparent decline in the MBH occupation fraction, as suggested by observational (e.g. Miller et al. 2015a; Trump et al. 2015; Nguyen et al. 2018) and theoretical (e.g. Volonteri et al. 2003; Bellovary et al. 2011; Habouzit et al. 2017; Haidar et al. 2022) studies1. Despite numerous investigations (see e.g. Sharma et al. 2022; Beckmann et al. 2023; Spinoso et al. 2023, for recent studies), the functional shape and value of the decline of the occupation fraction from unity as a function of galaxy stellar (or halo) mass remain only loosely constrained.
Galaxy centres can also host dense stellar systems, known as nuclear star clusters (NSCs), which are more commonly found in the dwarf galaxy regime, occupying about 80% of  galaxies in the local universe (Sánchez-Janssen et al. 2019; Neumayer et al. 2020; Hoyer et al. 2021; Ashok et al. 2023). Contrary to MBHs, their occupation fraction rapidly declines in the most massive galaxies, where MBHs are most common, potentially due to interactions between the two objects (e.g. Antonini et al. 2015; Arca-Sedda & Capuzzo-Dolcetta 2017) or tidal evaporation of progenitor clusters (Leaman & van de Ven 2022). Nevertheless, a transition region where both types of nuclei are present exists and includes, for example, the Milky Way (e.g. Genzel et al. 2010). As the functional shape of the MBH occupation fraction with respect to the host galaxy stellar mass is currently unclear, the extent of this transition region is unclear as well.
Due to observational constraints all firm MBH detections within NSCs are confined to relatively nearby galaxies (see e.g. Fig. 2 in Greene et al. 2020 and the compilation of Neumayer et al. 2020) and are located in the NSC’s centre with the exception of M31 (e.g. Lauer et al. 1993; Bacon et al. 1994, 2001b; Bender et al. 2005). Consequently, the total number of these systems is limited to a few dozen (e.g. Neumayer et al. 2020; Nguyen et al. 2022; Thater et al. 2023), including ultra-compact dwarfs as previous NSCs of accreted galaxies (e.g. Seth et al. 2014; Pfeffer et al. 2016; Ahn et al. 2017; Pechetti et al. 2022). As we are now aware of more than 1000 nucleated galaxies (Muñoz et al. 2015; Venhola et al. 2018; Sánchez-Janssen et al. 2019; Carlsten et al. 2020; Habas et al. 2020; Poulain et al. 2021; Su et al. 2021; Hoyer et al. 2023) and given the significant overlap between the NSC and MBH occupation fractions, we should expect a significantly higher number of galaxies with both an MBH and NSC. While dynamical measurements are important to obtain reliable mass measurements for MBHs within NSCs, focusing on accretion signatures can help to identify larger samples out to higher distances, including dwarf galaxies where NSCs are most common (e.g. Kauffmann et al. 2003; Baldassare et al. 2018; Birchall et al. 2020; Mezcua & Dominguez Sánchez 2020; Mezcua et al. 2023; Cann et al. 2023).
Accretion events onto MBHs from gas or stars via tidal disruption events (Rees 1988) leads to bright X-ray emission (e.g. Komossa & Bade 1999; Esquej et al. 2008; Maksym et al. 2010) which can be used to study the mass of the black hole (e.g. Mockler et al. 2019) and potentially that of black hole binaries (Mockler et al. 2023). Additionally, data from large-scale surveys was previously used to trace MBHs (e.g. Miller et al. 2015b) and to constrain their occupation fraction (Miller et al. 2015a). One avenue to detect more MBHs in NSCs is to combine optical and X-ray data to detect and characterise the NSC and MBH, respectively, requiring an active galactic nucleus (AGN) that does not outshine the NSC in the optical regime.
Previous works have already taken advantage of combining various wavelength regimes (Seth et al. 2008; Baldassare et al. 2022), using, among other instruments, Chandra for X-rays.
Another approach compared to using high-resolution Chandra data is to perform a shallower wide-area survey, allowing us to study a greater number of NSCs in galaxies of various masses and morphologies. The extended ROentgen Survey with an Imaging Telescope Array instrument (eROSITA; Predehl et al. 2021) aboard the Spectrum-Roentgen-Gamma (SRG; Sunyaev et al. 2021) takes this approach and serves as an ideal laboratory for such a study. The poorer resolution of eROSITA operating in its survey mode (half-energy width of 26″; Predehl et al. 2021) does not allow us to distinguish clearly between nuclear and off-nuclear emission as securely as Chandra but can still be used to detect MBH candidates for follow-up studies and to potentially probe MBH signatures in a large number of NSCs directly.
In this paper, we explore these possibilities using the cumulative data from eROSITA’s already completed four all-sky surveys (dubbed eRASS:4; Predehl et al. 2021) to locate X-ray emission in a large sample of NSCs. We introduce the eROSITA, galaxy and literature data sets in Sect. 2 and we analyse their properties in Sect. 3. Section 4 presents a discussion of the results and Sect. 5 gives the conclusions.
2 Data
2.1 Sample of nucleated galaxies
To generate an all-sky catalogue of nucleated galaxies, we first consider all galaxies up to a distance of 100 Mpc, which are part of the HyperLEDA2 data base (Makarov et al. 2014), containing approximately 63 000 objects. Based on this catalogue, we search the Hubble Legacy Archive3 for available high-resolution imaging data (Advanced Camera for Surveys, Wide Field and Planetary Camera 2, and Wide Field Camera 3). Based on these data, we assigned a nuclear classification to all galaxies, not taking into account previous classifications in the literature. The HyperLEDA data base becomes incomplete towards the dwarf galaxy regime, which is why we add to the classified galaxy sample the data of den Brok et al. (2014); Muñoz et al. (2015); Sánchez-Janssen et al. (2019); Zanatta et al. (2021); Su et al. (2022) for members of the Fornax, Virgo, and Coma galaxy clusters. The combined catalogue contains 888 nucleated galaxies across the whole sky, which we used to cross-match with the German footprint of eROSITA.
2.2 eROSITA observations: eRASS:4
We systematically extracted X-ray photometry at the input coordinates of the nucleated galaxies in the cumulative eRASS:4 images within the footprint of the German eROSITA Consortium (i.e. Galactic longitudes between 179.944 and 359.944). This led to a starting sample of 239/888 galaxies, with mean exposure of ~418 s and standard deviation of ~58 s (see Fig. 1) for three examples. A detailed description of the methodology is presented in Arcodia et al. (2024) and we only outline here the basic steps.
X-ray counts were extracted between 0.2–2.0 keV within a circular aperture of 30”, corresponding to ~75% of the encircled energy fraction of eROSITA’s point spread function in the adopted energy band. The background contribution was estimated from an annulus with inner and outer radii of 120” and 360”, respectively. Contaminating X-ray sources were masked following the prescription from Comparat et al. (2023; Appendix A). For a small number of cases (21/239), more than 70% of the source aperture was masked out and the NSC was therefore excluded from the analysis. Consequentially, the sample size of nucleated galaxies with extracted X-ray properties from the automated pipeline reduced down to 239 − 21 = 218.
From eRASS:4 X-ray spectra were extracted from the same aperture using the srctool task in the eROSITA Science Analysis Software System (eSASS, Brunner et al. 2022), with products version 020. The spectral analysis was performed with the Bayesian X-ray Analysis software (BXA) version 4.0.5. (Buchner et al. 2014), which connects the nested sampling algorithm UltraNest (Buchner 2019, 2021) with the fitting environment XSPEC version 12.12.0. (Arnaud et al. 1996), in its Python version PyXspec4. We adopted a simple power-law model (zpowerlw) with absorption fixed at the Galactic column density from HI4PI (HI4PI Collaboration 2016) and redshifted to rest-frame. We quoted median, first, and 99th percentiles from the fit posteriors for fluxes and luminosity, unless otherwise stated. In our approach, we followed the method from Arcodia et al. (2024) and adopted Pbinom = 3 × 10⁻⁴ as threshold for a significant detection, which corresponds to a spurious fraction of For non-detections (Pbinom > 3 × 10⁻⁴), we quoted upper limits using the 99th percentiles of the fit posteriors.
Potential individual sources of contamination from within the source aperture were treated a posteriori after visual inspection and were considered on a case-by-case basis. For instance, we cross-matched our sample with the catalogue from Walton et al. (2022), which compiled ultraluminous X-ray source (ULXs) candidates from XMM-Newton, Swift-XRT, and Chandra data. We manually masked out a handful of apertures with known ULX candidates and other obvious off-nuclear X-ray sources, whose centroid lies within the source aperture. In some cases, this resulted in the NSC being non-detected after the masking: the galaxy NGC 4559 contains a known ULX (Walton et al. 2022) and after its masking, the whole source aperture is masked-out and no products from the NSC can be analysed. Therefore, after a visual inspection, the number of galaxies with extracted X-ray properties from the automated pipeline was 217/218. We provide in Table the properties of all 217 galaxies, derived as explained in the next subsections, with their measured eRASS:4 X-ray luminosities.
From this sample, we obtain that 18/217 targets are detected. After computing 1a binomial uncertainties on this fraction from Cameron (2011), this results in a detection fraction of  .
.
Finally, we performed a stacking analysis of non-detections following the methodology outlined in Comparat et al. (2022) and Arcodia et al. (2024). Around each galaxy, we retrieved a photon cube with the angular position, physical distance to the associated galaxy, exposure time, observed and emitted energy (shifted to the rest-frame of the galaxy), and the effective area for each photon. Detected sources in the field were masked. The cubes were merged for the desired sub-sample of non-detected galaxies. We took a weighted mean of all events within 10 kpc using the weight described in Eq. (3) of Comparat et al. (2022) to obtain the surface brightness. We estimated the background surface brightness by repeating the procedure with events located at a distance between 15 and 50 kpc. Finally, we subtracted the background from the mean surface brightness (within a 10 kpc radius) and converted it to a luminosity.
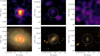 |
Fig. 1 Cutouts of eROSITA eRASS:4 images (top panels) and of the DESI Legacy Imaging Surveys (bottom panels) Data Release 10 [Legacy Surveys/D. Lang (Perimeter Institute)] of three galaxies in our sample: NGC 4651, IC 3602 and LEDA 40679. Both images are centered at the input optical coordinates of the NSC (white cross), with the 30″ aperture circle used for X-ray photometry highlighted in white. In case of an X-ray detection (left column) X-ray contours are also overlayed to the optical image (red). |
2.3 NSC and galaxy parameters
The imaging data from HST used to classify galaxies are inho-mogeneous with different spatial resolutions and available filters. Instead of deriving new NSC parameter estimates from these data, we looked for available values from the literature. As a consequence, not all nucleated galaxies of our sample have available NSC properties (seen in Figs. 4,5). More specifically, we searched for available NSC parameters for nucleated galaxies within the Local Volume (d ≲ 11Mpc; Seth et al. 2006; Georgiev et al. 2009; Graham & Spitler 2009; Baldassare et al. 2014; Schödel et al. 2014; Calzetti et al. 2015; Carson et al. 2015; Crnojevic et al. 2016; Nguyen et al. 2017, 2018; Baumgardt & Hilker 2018; Bellazzini et al. 2020; Pechetti et al. 2020; Hoyer et al. 2023), the field environment outside the Local Volume (Georgiev & Boker 2014; Georgiev et al. 2016), and the Virgo galaxy cluster (Sánchez-Janssen et al. 2019). Nucleated galaxies in the Coma and Fornax galaxy clusters are not part of our data set.
Galaxy stellar masses were determined as presented in the next subsection. Morphological type values are adopted from HyperLEDA and for the data sample of Sánchez-Janssen et al. (2019), we assumed a value of −5, corresponding to elliptical galaxies.
Galaxy stellar masses. To compute galaxy stellar masses, we used three different tracers: (1) the B − V colour, (2) the ɡ − r colour, and (3) the K-band luminosity. First, we obtained the photometric parameters and distance estimates from both the HyperLEDA and NED data bases. We then computed the aforementioned colours and B-, ɡ-, and K-band luminosities using the absolute magnitude of the Sun5 (Willmer 2018), accounting for Galactic extinction via the re-calibrated version of the Schlegel et al. (1998) extinction maps (Schlafly & Finkbeiner 2011), assuming RV = 3.1 (Fitzpatrick 1999). Internal extinction was not taken into account. The mass-to-light ratios for the different colours and K-band luminosity were taken from McGaugh & Schombert (2014) and Du et al. (2020), which give re-calibrated versions of the original relations by Bell et al. (2003); Portinari et al. (2004); Zibetti et al. (2009); Into & Portinari (2013); Roediger & Courteau (2015). The uncertainties on the final stellar mass estimates were based on those of the photometric parameters, the distance estimate, the absolute magnitude of the Sun (assumed to be 0.04 mag), and the stellar mass-to-light relation (assumed to be 0.3 dex). Usually, the latter one dominates over all other uncertainties.
For the dwarf galaxies in the Virgo cluster, we directly took the mass estimates from Sánchez-Janssen et al. (2019), which are based on fits to the spectral energy distributions and overall match to the other three approaches outlined above (Hoyer et al. 2021).
Their stellar mass estimates lack an uncertainty which is why we assumed a value of 0.3 dex.
Literature and eROSITA eRASS:4 data for our sample of nucleated galaxies. The complete data table is available at the CDS.
2.4 Literature X-ray data
As pointed out in the Introduction, previous work investigated the X-ray emissivity of NSCs in search for MBHs. Based on optical spectroscopy as well as radio and X-ray data (via Chandra, ROSAT, and XMM-Newton), Seth et al. (2008) found X-ray emission indicative of the presence of MBHs consistent with the position of NSCs in a sample of 176 early- and late-type galaxies. Most recently, Baldassare et al. (2022) used data from the Chandra X-ray observatory to search for such signatures in 108 nearby (d ≲ 40 Mpc) nuclei from the galaxy sample of Georgiev & Boker (2014), which is composed of massive late-type galaxies. They classified 29 targets as having significant X-ray emission and, thus, harbouring AGN.
Some other studies investigated the X-ray luminosity of the central region of galaxies without taking into account their nuclear classification. Here, we took into account data from She et al. (2017) and Ohlson et al. (2023), which used archival Chandra data.
We extracted fluxes and luminosities in the 0.5–7 keV range to compare with Ohlson et al. (2023) and in the 2–10 keV range to compare with Baldassare et al. (2022). We note that compared to Chandra, eROSITA is most sensitive in the 0.2–2.3 keV energy band (Predehl et al. 2021). From Ohlson et al. (2023) we used their luminosity values for a circular aperture with a radius of 3″ to better match the PSF of eROSITA. Baldassare et al. (2022) gives luminosities in both bands and we confirmed that the results (given in Sect. 3.4) remain unchanged when changing to the 0.5-7 keV band.
3 Analysis
3.1 X-ray contamination from binaries
Both low- and high-mass X-ray binaries, namely, binary stellar systems composed of a donor and either a neutron star or stellar mass black hole, can significantly contribute to a galaxy’s total X-ray luminosity (e.g. Iwasawa et al. 2009), sometimes rivalling that of the AGN (e.g. Lehmer et al. 2010). This contribution is especially important for our analysis given the size of eROSITA’s PSF (half-energy width of approximately 30arcsec; Predehl et al. 2021). The formation of low-mass X-ray binaries (LMXBs) typically takes 1-10 Gyr (Verbunt & van den Heuvel 1995) as we require stellar evolution to first produce a neutron star, which then has to dynamically enter into a binary system with a donor. The collective X-ray luminosity of these systems in older disks and bulges is related to the stellar mass of the galaxy (Gilfanov 2004) via  (e.g. Colbert et al. 2004; Lehmer et al. 2010), where log10
  (Lehmer et al. 2019).
In contrast, high-mass X-ray binaries (HMXBs) require a stellar mass black hole and their X-ray emission is related to the stellar evolution timescale of the massive donor star, resulting in a luminous phase about 100 Myr after formation of the binary (Verbunt & van den Heuvel 1995). Due to the high-mass of the donor and its short lifetime, the X-ray luminosity is related to the star formation rate (SFR) of the host galaxy via  (e.g. Grimm et al. 2003), where
  (Lehmer et al. 2019).
To estimate the current star formation rate of our sample, which we assume to be constant over the last 100 Myr (i.e. no star bursts or quenching effects from tidal interactions or bright AGN), we used the correlation from Hao et al. (2011, but see also from Kennicutt & Evans 2012, then) relating the emission in the far-ultraviolet (LFUV) with the mid-infrared (LMIR) and star formation rate via:
 (1)
(1)
We took this approach, contrary to, for instance, an estimation via X-rays (Colbert et al. 2004; Symeonidis et al. 2011; Riccio et al. 2023), due to the availability and homogeneity of the available luminosities: to estimate the far-ultraviolet luminosity, we used the publicly available data from Galex (Morrissey et al. 2007). For the mid-infrared luminosity, we used the A11WISE W4 (Wright et al. 2010; Cutri et al. 2013) or Spitzer MIPS (Rieke et al. 2004) magnitudes. For dwarf elliptical galaxies in the Virgo cluster, we assumed that no star formation occured over the last few hundred Myr and that the expected X-ray binary contamination is solely produced by LMXBs.
After computing the galaxy stellar mass and star formation rates, we determined the luminosities of both classes of binary systems. The expected contamination by X-ray binary systems is the sum of the two components, . Objects that were detected above this expected X-ray binary emission could indicate the presence of an MBH (however, see Sect. 4.2 for caveats).
3.2 Galaxy properties of X-ray detected sources
We compared the expected X-ray luminosity from the binary populations in the 2-10keV range with the eRASS:4 data in Fig. 2, distinguishing between X-ray detected sources (Pbinom ≤ 3 × 10⁻⁴) and undetected sources (Pbinom > 3 × 10⁻⁴, shown as upper limits). We also distinguished between objects only detected with eROSITA and the ones also detected with other instruments taken from Seth et al. (2008); She et al. (2017); Baldassare et al. (2022) or Ohlson et al. (2023). All significant detections in the eRASS:4 data have measured X-ray luminosities of  and similarly high expected luminosities from the galaxies LMXBs and HMXBs. Only three galaxies in our sample (NGC2903, NGC4212, and NGC4639) have measured luminosities greater than the expected values from binaries at 3σ confidence. Some of the X-ray detected sources are also measured below the expected value which may be related to uncertainties in the estimates of the galaxy-only predictions. We will discuss this observation further in Sect. 4.2. Below
  we find no significant emission and can only determine upper limits. Some of the NSCs with X-ray upper limits in Fig. 2 reside in dwarf elliptical galaxies in the core of the Virgo cluster (29/117 galaxies at
  ). A lack of photometric data in the literature makes it challenging to determine star formation rates and we assumed that no star formation takes place for these objects. While this assumption may be justified for the dwarf galaxy sample, the presented X-ray luminosity from binaries remains only a lower limit.
Figure 3 shows the distribution of measured X-ray luminosity versus galaxy stellar mass. To further constrain the emission in the dwarf galaxies, we stack non-detected galaxies within bins of stellar mass of 1 dex starting at  until 1010.5 M⊙ (see Sect. 2.2). None of the stacked X-ray images contains signals above background level, with upper limits of the order of 2 × 1038 erg s−1 found in each stellar mass bin. Estimating the expected X-ray luminosity from LMXBs with these galaxy stellar masses reveals that these upper limits are either matching or higher than the expected values; so, while we cannot rule out the presence of MBHs with low Eddington fractions (see Sect. 4.1 for more discussion below), these galaxies do not contain X-ray bright AGN.
From the low-mass towards the high-mass end in Fig. 3 the X-ray luminosity of the significant detections appears to increase, starting around  . While this increase could be related to the increasing contribution from the nuclear emission, as seen for a few sources in Fig. 2, most of the detected sources feature the expected luminosities from X-ray binary systems. Therefore, it appears plausible that this increase is mostly related to the increasing strength of LMXBs and not due to the presence of AGN.
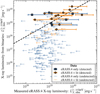 |
Fig. 2 Expected X-ray luminosity from the combined high- and low-mass binary population in the 2-10keV range |


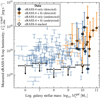 |
Fig. 3 Measured X-ray luminosity in the 2–10 keV range |


3.3 NSC properties of X-ray detected sources
Regarding NSC properties, we show the NSC versus host galaxy stellar mass relation (e.g. Georgiev et al. 2016; Neumayer et al. 2020; Ashok et al. 2023) in Fig. 4. We complement our data with the sample of Baldassare et al. (2022), which is based on the data of Georgiev & Boker (2014). Similar to the previous observation for galaxy masses in Fig. 3, only the most massive NSCs are X-ray detected, above  . Other lower-mass NSCs are not detected, including objects, which were detected previously with Chandra down to
  .
.
Figure 5 shows the NSC effective radius versus stellar mass plane. The eRASS:4 detected NSCs have both high stellar mass and large radii, as is expected from scaling relations (Georgiev et al. 2016; Neumayer et al. 2020; Ashok et al. 2023). The average half-mass density of these objects,  , is consistent with other X-ray detected but lower-mass NSCs in the literature, falling between
  .
.
Baldassare et al. (2022) also investigated the properties of their NSC sample distinguishing between X-ray luminosities likely originating from a massive black hole and X-ray binaries. Due to our limited sample of new detections, we refer to their study for further discussion with NSC properties.
3.4 X-ray variable sources
We compare in Fig. 6 the X-ray luminosity of nucleated galaxies in the German footprint of the eRASS:4 data with matches in Chandra, ROSAT, or XMM-Newton data from Seth et al. (2008), She et al. (2017), Baldassare et al. (2022), and Ohlson et al. (2023), as introduced in Sect. 2.4. Given their upper limits, most of the eRASS:4 values are in agreement with the literature. However, six other galaxies (NGC 2903, 3384, 4321, 4365, 4639, and 4701) have values not in agreement with the literature.
For one galaxy, NGC 2903, there exist literature data from both Baldassare et al. (2022) and Ohlson et al. (2023). Although the same data were analysed, they quote fluxes differing by a factor ~ 100, which is likely due to the difference between catalogue fluxes (Evans et al. 2010; Ohlson et al. 2023) and those estimated through aperture photometry (Baldassare et al. 2022). We computed the X-ray fluxes through spectral analysis and obtained that the eRASS:4 spectrum is sufficiently well described by a simple power-law with photon index 2.08 ± 0.20, although a more complex spectral model would be most likely required with higher count statistics in the 2–10 keV band. Based on this, we are not able to infer whether the difference between eROSITA and Chandra values is due to intrinsic variability or differences in the flux estimate methods.
We investigate this object further by looking at the X-ray luminosity in each eROSITA survey to find that it was detected in eRASS2 (with  erg s−1) but not in any other individual image. This indicates that NGC 2903 likely hosts an AGN, which is variable on time scales shorter than six months (i.e. the time between all-sky scans by eROSITA).
For the other five galaxies, we find no significant signs of X-ray variability within the eRASS:4 data. This could indicate that the inconsistency detected here, if not caused by any differences in analysis strategy between our approach and the one of Ohlson et al. (2023), occurs on time scales longer than six months but shorter than the time difference between the Chandra and eROSITA observations of a few years.
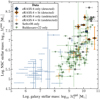 |
Fig. 4 Nuclear star cluster |


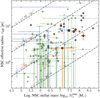 |
Fig. 5 Nuclear star cluster effective radius (reff) versus stellar mass |

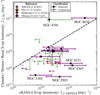 |
Fig. 6 Comparison of literature Chandra, XMM-Newton, or ROSAT X-ray luminosity versus eRASS:4 values. Full colour-coded symbols show X-ray detections in eRASS:4. The dashed line gives the one-to-one values. We compare to Seth et al. (2008), She et al. (2017) and Baldassare et al. (2022) using the 2 to 10 ke V band. Ohlson et al. (2023) give Chandra X-ray data in the 0.5 to 7 keV band. Galaxies, which likely show some X-ray variability, are specifically named. |
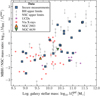 |
Fig. 7 Mass ratio of the SMBH and NSC stellar mass (log10 |


4 Discussion
4.1 Evaluating the presence of massive black holes
Most of the X-ray detected NSCs in eRASS:4 are in agreement with the expected luminosity from binary system, therefore, we are not able to unambiguously associate it with an AGN. Three NSCs (NGC 2903, NGC 4212, and NGC 4639) have emission above the expected value and this supports the presence of an AGN. For NGC 4212 the NSC properties are not known and no secure black hole measurement exists. For the other two galaxies, She et al. (2017) estimates the black hole mass using the MBH − σ relation from Kormendy & Ho (2013) to find  and
and  , resulting in
  and
and  , respectively, after taking into account a bolometric correction from Duras et al. (2020). The NSC masses are log10
  (Pechetti et al. 2020) and log10
  (Georgiev et al. 2016), resulting in mass fractions of
  and −0.4, respectively. These values compare well to other literature values, as we show in Fig. 7.
In comparison to previous studies, our investigation also takes into account a large sample of 111 early-type galaxies of various stellar masses. We show in Fig. 8, the galaxy stellar mass versus Hubble morphological type plane, with additions of Seth et al. (2008) and Baldassare et al. (2022) for NSCs without observational data in eRASS:4. As previously explored, only the most massive galaxies  have significant X-ray emission, irrespective of the host galaxy’s morphology. The focus of Baldassare et al. (2022) on the late-type sample of Georgiev & Böker (2014) results in detections down to galaxy masses of ~108 M⊙, as explored previously. In contrast, with the exception of one NSC (NGC 4467) from Seth et al. (2008), no early-type galaxy in the same mass range is X-ray detected within eRASS:4. This could imply several points:
- 1.
The accreting MBHs fall below the sensitivity of the cumulative data of eROSITA;
- 2.
The black hole occupation fraction is different for galaxies of different Hubble type resulting in fewer X-ray detections at the same host galaxy stellar mass;
- 3.
Assuming that the massive black hole occupation fraction does not depend on environment, this could indicate smaller black hole masses in these elliptical galaxies, assuming the same Eddington fraction;
- 4.
While assuming the same massive black hole occupation cate that the Eddington fraction is different between different morphologies, likely caused by a lack of gas available for accretion in the centres of early-type galaxies.
Regarding the first and last items, we can estimate an upper that we can ignore the contributions of HMXBs, the expected X-ray luminosity from binaries for a galaxy with stellar mass  is Lx,bin. ~ 1037 erg s−1, which is about a factor ten below the upper limits of eRASS:4 (see Fig. 3). Using a bolometric correction factor of about ten (Duras et al. 2020), the upper limit on the luminosity of a massive black hole would be Lbol, max ~ 1039 erg s−1. In galaxies of this mass, we would expect to find MBHs with MBH ~ 105 M⊙ from observational data in early-type galaxies (Erwin & Gadotti 2012; Reines & Volonteri 2015; Capuzzo-Dolcetta & Tosta e Melo 2017; Greene et al. 2020) and MBH ~ 106 5 M⊙ from simulations (e.g. Spinoso et al. 2023). For these MBH masses (105 M⊙, 106 5 M⊙), a Bolometric luminosity as quoted above (Lbol, max ~ 1039 erg s−1) would imply an Eddington fraction of at most 0.01%. This value roughly matches and is one dex higher than he values determined for NGC 2903 and NGC 4639 above, yielding an explanation for why we most likely do not detect these low-luminosity AGN in X-rays, if present. This also sets an upper limit to the hot gas accretion of such systems.
Regarding the other items, current observational data indicate that MBHs in early-type galaxies are more massive than their counterparts in late-types (see the compilation of Greene et al. 2020) but the scaling relations are solely based on measurements in massive galaxies and were extrapolated to the dwarf galaxy regime. The occupation fraction of MBHs appears to be similar, according to recent X-ray and dynamical results (see, again, the compilation of Greene et al. 2020), making the first and last items of the above list most likely.
MBH occupation fraction from X-rays. Assuming that all significantly X-ray detected NSCs host an AGN, we can infer the combined occupation fraction of NSCs and AGN. To gain statistical significance, we add to the eRASS:4 data the sample of Baldassare et al. (2022). For their sample we assume that all galaxies classified as having “diffuse” emission are non-detections.
We show the fraction of detected over the total sample as a function of galaxy and NSC stellar mass in Fig. 9. For comparison, we also add the sample occupation fraction of Seth et al. (2008) for NSCs and the AGN occupation fractions (without information of whether an NSC is present) from Miller et al. (2015a) and Ohlson et al. (2023) from observations and Tremmel et al. (2023) from a simulation. We find that above  the combined AGN & NSC fraction increases and reaches 100% around 1010 M⊙. Our data are slightly elevated compared to the data of Seth et al. (2008) and Ohlson et al. (2023), which could be related different selection effects (Seth et al. 2008 use optical spectroscopy, radio, and X-ray data to find evidences of the presence of an AGN) of the samples or instrument-related response functions. Additionally, because of the big half-energy width of eROSITA’s PSF (half-energy |width of about 30 arcsec; Predehl et al. 2021), off-nuclear star forming region can contaminate the measurements and result in a too-high estimate of the NSC and AGN fraction. Given the uncertainties of the data it remains unclear whether the presence of an NSC can enhance the occupation fraction of active galactic nuclei, not taking into account an enhanced rate of tidal disruption events (Pfister et al. 2020).
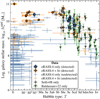 |
Fig. 8 Galaxy stellar mass (log10 |

4.2 Caveats
There exist several caveats in the analysis both related to the measured and expected X-ray luminosities. The spatial resolution of eROSITA results in an uncertainty on both the central position of the emission (roughly 4″) and allows for contamination by off-nuclear sources, thus not guaranteeing that the emission stems from the NSC. Instead, HMXBs or ULXs may mimic the emission of an accreting massive black hole in NSCs. Such contaminating sources may still be present in our sample, despite matching it with the ULX sample of Walton et al. (2022) (Sect. 2.2), thus requiring follow-up observations with higher spatial resolution facilities like Chandra.
In low-mass galaxies, the above argument is not problematic because the circular aperture typically contains the galaxy’s stellar body out to at least one effective radius (cf. middle and right columns in Fig. 1). However, there are several other challenges in this mass range. As noted by Lehmer et al. (2019), the scaling relations to track the contribution by HMXBs and LMXBs contain uncertainty in the low-mass regime because of a poorly sampled X-ray luminosity function. This makes it unclear how to interpret measured X-ray emission in dwarf galaxies in future eROSITA data releases in case dwarf galaxies (or stacks of dwarf galaxies) become X-ray detected. Additionally, the scaling relations of Lehmer et al. (2019) apply for the expected X-ray luminosity of the whole galaxy. However, in most cases, the aperture used to extract the X-ray photometry only covers part of the galaxy (see Sect. 2.2), thus overestimating the contamination from binaries.
Additionally, the influence of globular clusters to the X-ray binary contamination remains unclear. It is well-known that globular clusters efficiently produce LMXBs (e.g. Clark 1975; Sivakoff et al. 2007; Cheng et al. 2018) and that they can heavily influence the X-ray properties of elliptical galaxies (e.g. Irwin 2005; Lehmer et al. 2014, 2020) and, to some degree, late-types as well (Pfahl et al. 2003; Peacock et al. 2009; Hunt & Reffert 2023). This effect is especially important in the dwarf galaxy regime where the importance of globular clusters towards the total mass budget of the galaxy increases, as probed by the specific globular cluster frequency6 (e.g. Miller & Lotz 2007; Liu et al. 2019; Carlsten et al. 2022). There also exists some scatter in the specific frequency of dwarf galaxies (see e.g. the environmental dependence discussed in Carlsten et al. 2022) requiring a detailed investigation of the X-ray luminosity from globular clusters in dwarf galaxies.
Furthermore, what is not taken into account here is the X-ray contribution from binaries within the NSC itself. This contribution may be similar to globular clusters, especially in dwarf galaxies where the properties of both systems become similar (e.g. Fahrion et al. 2022; Hoyer et al. 2023), but it remains somewhat unclear in higher mass NSCs. Several works have found that denser globular clusters have a higher probability of hosting X-ray binaries (e.g. Kundu et al. 2002; Jordán et al. 2007; Sivakoff et al. 2007; Riccio et al. 2022; Hunt & Reffert 2023) and this probability should increase further for NSCs, which are the densest stellar systems known (Neumayer et al. 2020), especially in massive galaxies (Pechetti et al. 2020). The expected LMXB contribution to the X-ray budget of NSCs is currently unknown and distinguishing them from low-luminosity AGN requires future work.
In summary, there exist several caveats related to both the measured X-ray luminosity and the expected value from X-ray binaries. Further studies disentangling the contributions from binaries are required for the targets with significant detections, which are high-mass galaxies at present. The sample size may increase and extend towards the dwarf galaxy regime if future eROSITA or Athena (Nandra et al. 2013) data are added.
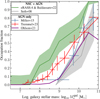 |
Fig. 9 Occupation fraction of nuclear star clusters and active galactic nuclei versus host galaxy stellar mass (log10 |

5 Conclusions
We combined a compilation of galaxies containing a nuclear star cluster (NSC) with eROSITA eRASS:4 data to probe X-ray signatures of an accreting massive black hole (MBH) within them. Using a sample of more than 200 nucleated galaxies with overlapping eRASS:4 data within the footprint of the German eROSITA Consortium, we find 18 significant detections of which one is related to the presence of an off-nuclear ultra-luminous X-ray source. However, compared to the expected X-ray contamination from both low- and high-mass X-ray binaries, only three galaxies (NGC 2903, 4212, and 4639) have measured luminosities indicative of the presence of an MBH. Another six galaxies (NGC 2903, 3384, 4321, 4365, 4639, and 4701) have significantly different X-ray luminosities compared to previous archival measurements, which we interpret as indicative of a variable X-ray AGN. For NGC 4701, we find variability within the eRASS:4 data set, which could be related to an intrinsic variability or changes in obscuration. To confirm the nature of these objects, follow-up observations are necessary.
The MBH to NSC stellar mass fraction versus host galaxy stellar mass of the newly identified AGN compares well to other known systems. By adding X-ray-based black hole mass estimates, we can significantly expand this parameter space towards lower galaxy stellar masses, apparently confirming a drop in the mass ratio around galaxy stellar masses of 1010 M⊙.
Assuming that all X-ray detected NSCs above the expected luminosity from X-ray binaries host AGN, we construct an NSC + AGN occupation fraction by adding data from Baldassare et al. (2022) to gain statistical significance. The resulting curve has higher occupation fraction than the one of Seth et al. (2008) and the AGN only fractions of Miller et al. (2015a); Tremmel et al. (2023) and Ohlson et al. (2023). The differences may be related to instrument-related response functions and the different half-energy widths of the instruments used.
Large-scale surveys, as those carried out by eROSITA or by Athena in the future, offer a unique view on X-ray emission in dwarf galaxies, covering low-mass early-type galaxies as well, whose X-ray properties had not been investigated previously, with respect to the presence of NSCs.
Acknowledgements
The authors thank the editor and anonymous referee for their constructive feedback. N.H. is a fellow of the International Max Planck Research School for Astronomy and Cosmic Physics at the University of Heidelberg (IMPRS-HD). N.H. received financial support from the European Union’s HORIZON-MSCA-2021-SE-01 Research and Innovation programme under the Marie Sklodowska-Curie grant agreement number 101086388 – Project acronym: LACEGAL. R.A. received support for this work by NASA through the NASA Einstein Fellowship grant no. HF2-51499 awarded by the Space Telescope Science Institute, which is operated by the Association of Universities for Research in Astronomy, Inc., for NASA, under contract NAS5-26555. This work is based on data from eROSITA, the soft X-ray instrument aboard SRG, a joint Russian-German science mission supported by the Russian Space Agency (Roskosmos), in the interests of the Russian Academy of Sciences represented by its Space Research Institute (IKI), and the Deutsches Zentrum für Luft- und Raumfahrt (DLR). The SRG spacecraft was built by Lavochkin Association (NPOL) and its subcontractors, and is operated by NPOL with support from the Max Planck Institute for Extraterrestrial Physics (MPE). The development and construction of the eROSITA X-ray instrument was led by MPE, with contributions from the Dr. Karl Remeis Observatory Bamberg & ECAP (FAU Erlangen-Nuernberg), the University of Hamburg Observatory, the Leibniz Institute for Astrophysics Potsdam (AIP), and the Institute for Astronomy and Astrophysics of the University of Tuebingen, with the support of DLR and the Max Planck Society. The Argelander Institute for Astronomy of the University of Bonn and the Ludwig Maximilians Universitaet Munich also participated in the science preparation for eROSITA. The eROSITA data shown here were processed using the eSASS software system developed by the German eROSITA consortium. This work is based in part on observations made with the Spitɀer Space Telescope, which is operated by the Jet Propulsion Laboratory, California Institute of Technology under a contract with NASA. This work acknowledges funding from the European Research Council (ERC) under the European Union’s Horizon 2020 research and innovation programme (grant agreement No. 865637). This work used the following software: Astropy (Astropy Collaboration 2013, 2018), dustmaps (Green 2018), Matplotlib (Hunter 2007), NumPy (Harris et al. 2020), Pandas (McKinney 2010), eSASS (Brunner et al. 2022), and BXA (Buchner et al. 2014), PyXspec (Arnaud et al. 1996, and Craig Gordon and Keith Arnaud). The data underlying this article are available in the article and in its online supplementary material.
References
- Abuter, R., Accardo, M., Amorim, A., et al. 2017, A&A, 602, A94 [NASA ADS] [CrossRef] [EDP Sciences] [Google Scholar]
- Abuter, R., Amorim, A., Bauböck, M., et al. 2021, A&A, 647, A59 [NASA ADS] [CrossRef] [EDP Sciences] [Google Scholar]
- Ahn, C. P., Seth, A. C., den Brok, M., et al. 2017, ApJ, 839, 72 [Google Scholar]
- Antonini, F., Barausse, E., & Silk, J. 2015, ApJ, 812, 72 [Google Scholar]
- Arca-Sedda, M., & Capuzzo-Dolcetta, R. 2017, MNRAS, 471, 478 [CrossRef] [Google Scholar]
- Arcodia, R., Merloni, A., Comparat, J., et al. 2024, A&A, 681, A97 [NASA ADS] [CrossRef] [EDP Sciences] [Google Scholar]
- Arnaud, K., Borkowski, K. J., & Harrington, J. P. 1996, ApJ, 462, L75 [NASA ADS] [Google Scholar]
- Ashok, A., Seth, A., Erwin, P., et al. 2023, ApJ, 958, 100 [NASA ADS] [CrossRef] [Google Scholar]
- Astropy Collaboration (Robitaille, T. P., et al.) 2013, A&A, 558, A33 [NASA ADS] [CrossRef] [EDP Sciences] [Google Scholar]
- Astropy Collaboration (Price-Whelan, A. M., et al.) 2018, ApJ, 156, 123 [CrossRef] [Google Scholar]
- Atkinson, J. W., Collett, J. L., Marconi, A., et al. 2005, MNRAS, 359, 504 [NASA ADS] [CrossRef] [Google Scholar]
- Bacon, R., Emsellem, E., Monnet, G., & Nieto, J. L. 1994, A&A, 281, 691 [NASA ADS] [Google Scholar]
- Bacon, R., Copin, Y., Monnet, G., et al. 2001a, MNRAS, 326, 23 [Google Scholar]
- Bacon, R., Emsellem, E., Combes, F., et al. 2001b, A&A, 371, 409 [NASA ADS] [CrossRef] [EDP Sciences] [Google Scholar]
- Baldassare, V. F., Gallo, E., Miller, B. P., et al. 2014, ApJ, 791, 133 [NASA ADS] [CrossRef] [Google Scholar]
- Baldassare, V. F., geha, M., & Greene, J. 2018, ApJ, 868, 152 [NASA ADS] [CrossRef] [Google Scholar]
- Baldassare, V. F., Stone, N. C., Foord, A., Gallo, E., & Ostriker, J. P. 2022, ApJ, 929, 84 [NASA ADS] [CrossRef] [Google Scholar]
- Baumgardt, H., & Hilker, M. 2018, MNRAS, 478, 1520 [Google Scholar]
- Beckmann, R. S., Dubois, Y., Volonteri, M., et al. 2023, MNRAS, 16 [Google Scholar]
- Bell, E. F., Mcintosh, D. H., Katz, N., & Weinberg, M. D. 2003, ApJS, 149, 289 [NASA ADS] [CrossRef] [Google Scholar]
- Bellazzini, M., Annibali, F., Tosi, M., et al. 2020, A&A, 634, A124 [NASA ADS] [CrossRef] [EDP Sciences] [Google Scholar]
- Bellovary, J., Volonteri, M., Governato, F., et al. 2011, ApJ, 742, 13 [Google Scholar]
- Bender, R., Kormendy, J., & Dehnen, W. 1996, ApJ, 464, L123 [NASA ADS] [CrossRef] [Google Scholar]
- Bender, R., Kormendy, J., Bower, G., et al. 2005, ApJ, 631, 280 [NASA ADS] [CrossRef] [Google Scholar]
- Bertola, F., Cinzano, P., Corsini, E. M., et al. 1996, ApJ, 458, L67 [NASA ADS] [CrossRef] [Google Scholar]
- Birchall, K. L., Watson, M. G., & Aird, J. 2020, MNRAS, 492, 2268 [NASA ADS] [CrossRef] [Google Scholar]
- Brunner, H., Liu, T., Lamer, G., et al. 2022, A&A, 661, A1 [NASA ADS] [CrossRef] [EDP Sciences] [Google Scholar]
- Buchner, J. 2019, PASP, 131, 108005 [Google Scholar]
- Buchner, J. 2021, J. Open Source Softw., 6, 3001 [CrossRef] [Google Scholar]
- Buchner, J., Georgakakis, A., Nandra, K., et al. 2014, A&A, 564, A125 [NASA ADS] [CrossRef] [EDP Sciences] [Google Scholar]
- Bustamente-Rosell, M. J., Noyola, E., Gebhardt, K., et al. 2021, ApJ, 921, 107 [NASA ADS] [CrossRef] [Google Scholar]
- Calzetti, D., Johnson, K. E., Adamo, A., et al. 2015, ApJ, 811, 75 [CrossRef] [Google Scholar]
- Cameron, E. 2011, PASA, 28, 128 [Google Scholar]
- Cann, J. M., Weaver, K. A., Pfeifle, R. W., et al. 2023, arXiv e-prints [arXiv:2310.02999] [Google Scholar]
- Cappellari, M. 2020, MNRAS, 494, 4819 [NASA ADS] [CrossRef] [Google Scholar]
- Cappellari, M., & Emsellem, E. 2004, PASP, 116, 138 [Google Scholar]
- Capuzzo-Dolcetta, R. & Tosta e Melo, i. 2017, MNRAS, 472, 4013 [CrossRef] [Google Scholar]
- Carlsten, S. G., Greco, J. P., Beaton, R. L., & Greene, J. E. 2020, ApJ, 891, 144 [NASA ADS] [CrossRef] [Google Scholar]
- Carlsten, S. G., Greene, J. E., Beaton, R. L., & Greco, J. P. 2022, ApJ, 927, 44 [NASA ADS] [CrossRef] [Google Scholar]
- Carson, D. J., Barth, A. J., Seth, A. C., et al. 2015, AJ, 149, 149 [Google Scholar]
- Cheng, Z., Li, Z., Xu, X., & Li, X. 2018, ApJ, 858, 33 [NASA ADS] [CrossRef] [Google Scholar]
- Clark, G. W. 1975, ApJ, 199, L143 [NASA ADS] [CrossRef] [Google Scholar]
- Colbert, E. J. M., Heckman, T. M., Ptak, A. F., Strickland, D. K., & Weaver, K. A. 2004, ApJ, 602, 231 [NASA ADS] [CrossRef] [Google Scholar]
- Comparat, J., Truong, N., Merloni, A., et al. 2022, A&A, 666, A156 [NASA ADS] [CrossRef] [EDP Sciences] [Google Scholar]
- Comparat, J., Luo, W., Merloni, A., et al. 2023, A&A, 673, A122 [NASA ADS] [CrossRef] [EDP Sciences] [Google Scholar]
- Crnojević, D., Sand, D. J., Zaritsky, D., et al. 2016, ApJ, 824, L14 [CrossRef] [Google Scholar]
- Cutri, R. M., Wright, E. L., Conrow, T., et al. 2013, Explanatory Supplement to the AllWiSE Data Release Products [Google Scholar]
- den Brok, M., Peletier, R. F., Seth, A. C., et al. 2014, MNRAS, 445, 2385 [NASA ADS] [CrossRef] [Google Scholar]
- Devereux, N., Ford, H., Tsvetanov, Z., & Jacoby, G. 2003, AJ, 125, 1226 [NASA ADS] [CrossRef] [Google Scholar]
- Du, W., Cheng, C., Zheng, Z., & Wu, H. 2020, AJ, 159, 138 [CrossRef] [Google Scholar]
- Duras, F., Bongiorno, A., Ricci, F., et al. 2020, A&A, 636, A73 [NASA ADS] [CrossRef] [EDP Sciences] [Google Scholar]
- Erwin, P., & Gadotti, D. A. 2012, Adv. Astron., 2012, 946368 [Google Scholar]
- Esquej, P., Saxton, R. D., Komossa, S., et al. 2008, A&A, 489, 543 [NASA ADS] [CrossRef] [EDP Sciences] [Google Scholar]
- Evans, I. N., Primini, F. A., Glotfelty, K. J., et al. 2010, ApJS, 189, 37 [NASA ADS] [CrossRef] [Google Scholar]
- Fahrion, K., Lyubenova, M., van de Ven, G., et al. 2019, A&A, 628, A92 [NASA ADS] [CrossRef] [EDP Sciences] [Google Scholar]
- Fahrion, K., Bulichi, T.-E., Hilker, M., et al. 2022, A&A, 667, A101 [NASA ADS] [CrossRef] [EDP Sciences] [Google Scholar]
- Ferrarese, L., Côté, P., MacArthur, L. A., et al. 2020, ApJ, 890, 128 [Google Scholar]
- Filippenko, A. V., & Ho, L. C. 2003, ApJ, 588, L13 [NASA ADS] [CrossRef] [Google Scholar]
- Fitzpatrick, E. L. 1999, PASP, 111, 63 [Google Scholar]
- Gebhardt, K., Richstone, D., Tremaine, S., et al. 2003, ApJ, 583, 92 [Google Scholar]
- Genzel, R., Pichon, C., Eckart, A., Gerhard, O. E., & Ott, T. 2000, MNRAS, 317, 348 [Google Scholar]
- Genzel, R., Eisenhauer, F., & Gillessen, S. 2010, Rev. Mod. Phys., 82, 3121 [Google Scholar]
- Georgiev, I. Y., & Böker, T. 2014, MNRAS, 441, 3570 [Google Scholar]
- Georgiev, I. Y., Hilker, M., Puzia, T. H., Goudfrooij, P., & Baumgardt, H. 2009, MNRAS, 396, 1075 [NASA ADS] [CrossRef] [Google Scholar]
- Georgiev, I. Y., Böker, T., Leigh, N., Lutzgendorf, N., & Neumayer, N. 2016, MNRAS, 457, 2122 [NASA ADS] [CrossRef] [Google Scholar]
- Ghez, A. M., Klein, B. L., Morris, M., & Becklin, E. E. 1998, ApJ, 509, 678 [NASA ADS] [CrossRef] [Google Scholar]
- Gilfanov, M. 2004, MNRAS, 349, 146 [NASA ADS] [CrossRef] [Google Scholar]
- Gillessen, S., Eisenhauer, F., Tripper, S., et al. 2009, ApJ, 692, 1075 [NASA ADS] [CrossRef] [Google Scholar]
- Graham, A. W., & Spitler, L. R. 2009, MNRAS, 397, 2148 [NASA ADS] [CrossRef] [Google Scholar]
- Graham, A. W., & Soria, R. 2019, MNRAS, 484, 794 [Google Scholar]
- Green, G. M. 2018, J. Open Source Softw., 3, 695 [Google Scholar]
- Grimm, H.-J., Gilfanov, M., & Sunyaev, R. 2003, MNRAS, 339, 793 [NASA ADS] [CrossRef] [Google Scholar]
- Greene, J. E., Strader, J., & Ho, L. C. 2020, A&ARv, 58, 257 [CrossRef] [Google Scholar]
- Gültekin, K., Richstone, D. O., Gebhardt, K., et al. 2009, ApJ, 695, 1577 [CrossRef] [Google Scholar]
- Habas, R., Marleau, F. R., Duc, P.-A., et al. 2020, MNRAS, 491, 1901 [NASA ADS] [Google Scholar]
- Habouzit, M., Volonteri, M., & Dubois, Y. 2017, MNRAS, 468, 3935 [NASA ADS] [CrossRef] [Google Scholar]
- Haidar, H., Habouzit, M., Volonteri, M., et al. 2022, MNRAS, 514, 4912 [NASA ADS] [CrossRef] [Google Scholar]
- Hao, C.-N., Kennicutt, R. C., Johnson, B. D., et al. 2011, ApJ, 741, 124 [Google Scholar]
- Harris, C. R., Millman, K. J., van der Walt, S. J., et al. 2020, Nature, 585, 357 [NASA ADS] [CrossRef] [Google Scholar]
- HI4PI Collaboration (Ben Bekhti, N., et al.) 2016, A&A, 594, A116 [NASA ADS] [CrossRef] [EDP Sciences] [Google Scholar]
- Hoyer, N., Neumayer, N., Georgiev, I. Y., Seth, A. C., & Greene, J. E. 2021, MNRAS, 507, 3246 [NASA ADS] [CrossRef] [Google Scholar]
- Hoyer, N., Neumayer, N., Seth, A. C., Georgiev, I. Y., & Greene, J. E. 2023, MNRAS, 520, 4664 [CrossRef] [Google Scholar]
- Hunt, E. L., & Reffert, S. 2023, A&A, 673, A114 [NASA ADS] [CrossRef] [EDP Sciences] [Google Scholar]
- Hunter, J. D. 2007, Comput. Sci. Eng., 9, 90 [NASA ADS] [CrossRef] [Google Scholar]
- Into, T., & Portinari, L. 2013, MNRAS, 430, 2715 [Google Scholar]
- Irwin, J. A. 2005, ApJ, 631, 511 [NASA ADS] [CrossRef] [Google Scholar]
- Iwasawa, K., Sanders, D. B., Evans, A. S., et al. 2009, ApJ, 695, L103 [NASA ADS] [CrossRef] [Google Scholar]
- Jordán, A., Sivakoff, G. R., McLaughlin, D. E., et al. 2007, ApJ, 671, L117 [CrossRef] [Google Scholar]
- Kauffmann, G., Heckman, T. M., Tremonti, C., et al. 2003, MNRAS, 346, 1055 [Google Scholar]
- Kennicutt, R. C., & Evans, N. J. 2012, A&ARv, 50, 531 [CrossRef] [Google Scholar]
- Komossa, S., & Bade, N. 1999, A&A, 343, 775 [NASA ADS] [Google Scholar]
- Kormendy, J., & Richstone, D. 1995, A&ARv, 33, 581 [CrossRef] [Google Scholar]
- Kormendy, J., & Ho, L. C. 2013, A&ARv, 51, 511 [CrossRef] [Google Scholar]
- Kormendy, J., Bender, R., Magorrian, J., et al. 1997, ApJ, 482, L139 [NASA ADS] [CrossRef] [Google Scholar]
- Kundu, A., Maccarone, T. J., & Zepf, S. E. 2002, ApJ, 574, L5 [NASA ADS] [CrossRef] [Google Scholar]
- Kuo, C. Y., Braatz, J. A., Condon, J. J., et al. 2011, ApJ, 727, 20 [NASA ADS] [CrossRef] [Google Scholar]
- Lauer, T. R., Faber, S. M., Groth, E. J., et al. 1993, AJ, 106, 1436 [Google Scholar]
- Leaman, R., & van de Ven, G. 2022, MNRAS, 516, 4691 [Google Scholar]
- Lehmer, B. D., Alexander, D. M., Bauer, F. E., et al. 2010, ApJ, 724, 559 [Google Scholar]
- Lehmer, B. D., Berkeley, M., Zezas, A., et al. 2014, ApJ, 789, 52 [NASA ADS] [CrossRef] [Google Scholar]
- Lehmer, B. D., Eufrasio, R. T., Tzanavaris, P., et al. 2019, ApJS, 243, 3 [NASA ADS] [CrossRef] [Google Scholar]
- Lehmer, B. D., Ferrell, A. P., Doore, K., et al. 2020, ApJS, 248, 31 [NASA ADS] [CrossRef] [Google Scholar]
- Liu, Y., Peng, E. W., Jordán, A., et al. 2019, ApJ, 875, 156 [NASA ADS] [CrossRef] [Google Scholar]
- Maggorian, J., Tremaine, S., Richstone, D., et al. 1998, AJ, 115, 2285 [NASA ADS] [CrossRef] [Google Scholar]
- Makarov, D., Prugniel, P., Terekhova, N., Courtois, H., & Vauglin, I. 2014, A&A, 570, A13 [NASA ADS] [CrossRef] [EDP Sciences] [Google Scholar]
- Maksym, W. P., Ulmer, M. P., & Eracleous, M. 2010, ApJ, 772, 1035 [NASA ADS] [CrossRef] [Google Scholar]
- Marconi, A., Capetti, A., Axon, D. J., et al. 2001, ApJ, 549, 915 [NASA ADS] [CrossRef] [Google Scholar]
- McGaugh, S. S., & Schombert, J. M. 2014, AJ, 148, 77 [Google Scholar]
- McKinney, W. 2010, in Proceedings of the 9th Python in Science Conference, eds. S. van der Walt, & J. Millman, (SciPy), 56 [Google Scholar]
- Merrell, K. A., Vasiliev, E., Bentz, M. C., Valluri, M., & Onken, C. A. 2023, ApJ, 949, 13 [NASA ADS] [CrossRef] [Google Scholar]
- Mezcua, M., & Domínguez Sánchez, H. 2020, ApJ, 898, L30 [Google Scholar]
- Mezcua, M., Siudek, M., Suh, H., et al. 2023, ApJ, 943, L5 [NASA ADS] [CrossRef] [Google Scholar]
- Miller, B. W., & Lotz, J. M. 2007, ApJ, 670, 1074 [NASA ADS] [CrossRef] [Google Scholar]
- Miller, B. P., Gallo, E., Greene, J. E., et al. 2015a, ApJ, 799, 98 [NASA ADS] [CrossRef] [Google Scholar]
- Miller, J. M., Kaastra, J. S., Miller, M. C., et al. 2015b, Nature, 526, 542 [NASA ADS] [CrossRef] [Google Scholar]
- Mockler, B., Guillochon, J., & Ramirez-Ruiz, E. 2019, ApJ, 872, 151 [Google Scholar]
- Mockler, B., Melchor, D., Naoz, S., & Ramirez-Ruiz, E. 2023, ApJ, 18 [Google Scholar]
- Morrissey, P., Conrow, T., Barlow, T. A., et al. 2007, ApJS, 173, 682 [Google Scholar]
- Muñoz, R. P., Eigenthaler, P., Puzia, T. H., et al. 2015, ApJ, 813, L15 [Google Scholar]
- Nandra, K., Barret, D., Barcons, X., et al. 2013, arXiv e-prints [arXiv:1386.2387] [Google Scholar]
- Neumayer, N., Seth, A. C., & Böker, T. 2020, A&ARv, 28, 75 [CrossRef] [Google Scholar]
- Nguyen, D. D., Seth, A. C., den Brok, M., et al. 2017, ApJ, 836, 237 [NASA ADS] [CrossRef] [Google Scholar]
- Nguyen, D. D., Seth, A. C., Neumayer, N., et al. 2018, ApJ, 858, 118 [NASA ADS] [CrossRef] [Google Scholar]
- Nguyen, D. D., Seth, A. C., Neumayer, N., et al. 2019, ApJ, 872, 104 [Google Scholar]
- Nguyen, D. D., Bureau, M., Thater, S., et al. 2022, MNRAS, 509, 2920 [Google Scholar]
- Nowak, N., Saglia, R. P., Thomas, J., et al. 2008, MNRAS, 391, 1629 [NASA ADS] [CrossRef] [Google Scholar]
- Ohlson, D., Seth, A. C., Gallo, E., Baldassare, V. F., & Greene, J. E. 2023, AJ, 23 [Google Scholar]
- Peacock, M. B., Maccarone, T. J., Waters, C. Z., et al. 2009, MNRAS, 392, L55 [NASA ADS] [Google Scholar]
- Pechetti, R., Seth, A. C., Neumayer, N., et al. 2020, ApJ, 900, 32 [NASA ADS] [CrossRef] [Google Scholar]
- Pechetti, R., Seth, A., Kamann, S., et al. 2022, ApJ, 924, 48 [NASA ADS] [CrossRef] [Google Scholar]
- Pfahl, E., Rappaport, S., & Podsiadlowski, P. 2003, ApJ, 597, 1036 [NASA ADS] [CrossRef] [Google Scholar]
- Pfeffer, J., Hilker, M., Baumgardt, H., & Griffen, B. F. 2016, MNRAS, 458, 2492 [NASA ADS] [CrossRef] [Google Scholar]
- Pfister, H., Volonteri, M., Dai, J. L., & Colpi, M. 2020, MNRAS, 497, 2276 [NASA ADS] [CrossRef] [Google Scholar]
- Portinari, L., Sommer-Larsen, J., & Tantalo, R. 2004, MNRAS, 347, 691 [NASA ADS] [CrossRef] [Google Scholar]
- Poulain, M., Marleau, F. R., Habas, R., et al. 2021, MNRAS, 506, 5494 [NASA ADS] [CrossRef] [Google Scholar]
- Predehl, P., Andritschke, R., Arefiev, V., et al. 2021, A&A, 647, A1 [EDP Sciences] [Google Scholar]
- Rees, M. J. 1988, Nature, 333, 523 [Google Scholar]
- Regan, J. A., Pacucci, F., & Bustamente-Rosell, M. J. 2023, MNRAS, 518, 5997 [Google Scholar]
- Reines, A. E., & Volonteri, M. 2015, ApJ, 813, 82 [NASA ADS] [CrossRef] [Google Scholar]
- Riccio, G., Paolillo, M., Cantiello, M., et al. 2022, A&A, 664, A41 [NASA ADS] [CrossRef] [EDP Sciences] [Google Scholar]
- Riccio, G., Yang, G., Malek, K., et al. 2023, A&A, 678, A164 [NASA ADS] [CrossRef] [EDP Sciences] [Google Scholar]
- Rieke, G. H., Young, E. T., Engelbracht, C. W., et al. 2004, ApJS, 154, 25 [Google Scholar]
- Roediger, J. C., & Courteau, S. 2015, MNRAS, 452, 3209 [NASA ADS] [CrossRef] [Google Scholar]
- Rusli, S. P., Thomas, J., Erwin, P., et al. 2011, MNRAS, 410, 1223 [NASA ADS] [CrossRef] [Google Scholar]
- Saglia, R. P., Opitsch, M., Erwin, P., et al. 2016, ApJ, 818, 47 [Google Scholar]
- Sánchez-Janssen, R., Côté, P., Ferrarese, L., et al. 2019, ApJ, 878, 18 [CrossRef] [Google Scholar]
- Saulder, C., van Kampen, E., Chilingarian, I. V., Mieske, S., & Zeilinger, W. W. 2016, A&A, 596, A14 [NASA ADS] [CrossRef] [EDP Sciences] [Google Scholar]
- Schlafly, E. F., & Finkbeiner, D. P. 2011, ApJ, 737, 103 [Google Scholar]
- Schlegel, D. J., Finkbeiner, D. P., & Davis, M. 1998, ApJ, 500, 525 [Google Scholar]
- Schödel, R., Feldmeier, A., Kunneriath, D., et al. 2014, A&A, 566, A47 [Google Scholar]
- Seth, A. C., Dalcanton, J. J., Hodge, P. W., & Debattista, V. P. 2006, The AJ, 132, 2539 [NASA ADS] [CrossRef] [Google Scholar]
- Seth, A., Agüeros, M., Lee, D., & Basu-Zych, A. 2008, ApJ, 678, 116 [NASA ADS] [CrossRef] [Google Scholar]
- Seth, A. C., van den Bosch, R., Mieske, S., et al. 2014, Nature, 513, 398 [CrossRef] [Google Scholar]
- Sharma, R. S., Brooks, A. M., Tremmel, M., et al. 2022, ApJ, 936, 82 [NASA ADS] [CrossRef] [Google Scholar]
- She, R., Ho, L. C., & Feng, H. 2017, ApJ, 835, 223 [NASA ADS] [CrossRef] [Google Scholar]
- Sivakoff, G. R., Jordán, A., Sarazin, C. L., et al. 2007, ApJ, 660, 1246 [NASA ADS] [CrossRef] [Google Scholar]
- Spinoso, D., Bonoli, S., Valiante, R., Schneider, R., & Izquierdo-Villalba, D. 2023, MNRAS, 518, 4672 [Google Scholar]
- Su, A. H., Salo, H., Janz, J., et al. 2021, A&A, 647, A100 [EDP Sciences] [Google Scholar]
- Su, A. H., Salo, H., Janz, J., Venhola, A., & Peletier, R. F. 2022, A&A, 664, A167 [NASA ADS] [CrossRef] [EDP Sciences] [Google Scholar]
- Sunyaev, R., Arefiev, V., Babyshkin, V., et al. 2021, A&A, 656, A132 [NASA ADS] [CrossRef] [EDP Sciences] [Google Scholar]
- Symeonidis, M., Georgakakis, A., Seymour, N., et al. 2011, MNRAS, 417, 2239 [NASA ADS] [CrossRef] [Google Scholar]
- Thater, S., Krajnović, D., Cappellari, M., et al. 2019, A&A, 625, A62 [NASA ADS] [CrossRef] [EDP Sciences] [Google Scholar]
- Thater, S., Jethwa, P., Tahmasebzadeh, B., et al. 2022a, A&A, 667, A51 [NASA ADS] [CrossRef] [EDP Sciences] [Google Scholar]
- Thater, S., Krajnović, D., Weilbacher, P. M., et al. 2022b, MNRAS, 509, 5416 [Google Scholar]
- Thater, S., Lyubenova, M., Fahrion, K., et al. 2023, A&A 675, A18 [NASA ADS] [CrossRef] [EDP Sciences] [Google Scholar]
- Tonry, J. L. 1984, ApJ, 283, L27 [NASA ADS] [CrossRef] [Google Scholar]
- Tremaine, S., Gebhardt, K., Bender, R., et al. 2002, ApJ, 574, 740 [NASA ADS] [CrossRef] [Google Scholar]
- Tremmel, M., Ricarte, A., Natarajan, P., et al. 2023, Open J. Astrophys., 16 [Google Scholar]
- Trump, J. R., Sun, M., Zeimann, G. R., et al. 2015, ApJ, 811, 26 [NASA ADS] [CrossRef] [Google Scholar]
- van den Bosch, R. C. E., & de Zeeuw, P. T. 2010, MNRAS, 401, 1770 [NASA ADS] [CrossRef] [Google Scholar]
- Venhola, A., Peletier, R., Laurikainen, E., et al. 2018, A&A, 620, A165 [NASA ADS] [CrossRef] [EDP Sciences] [Google Scholar]
- Verbunt, F., & van den Heuvel, E. P. J. 1995, in X-ray Binaries, 457 [Google Scholar]
- Volonteri, M., Madau, P., & Haardt, F. 2003, ApJ, 593, 661 [Google Scholar]
- Walsh, J. L., Barth, A. J., & Sarzi, M. 2010, ApJ, 721, 762 [NASA ADS] [CrossRef] [Google Scholar]
- Walsh, J. L., van den Bosch, R. C. E., Barth, A. J., & Sarzi, M. 2012, ApJ, 753, 79 [NASA ADS] [CrossRef] [Google Scholar]
- Walton, D. J., Mackenzie, A. D. A., Gully, H., et al. 2022, MNRAS, 509, 1587 [Google Scholar]
- Willmer, C. N. A. 2018, ApJS, 236, 47 [Google Scholar]
- Wright, E. L., Eisenhardt, P. R. M., Mainzer, A. K., et al. 2010, AJ, 140, 1868 [Google Scholar]
- Zanatta, E., Sánchez-Janssen, R., Chies-Santos, A. L., de Souza, R. S., & Blakeslee, J. P. 2021, MNRAS, 508, 986 [NASA ADS] [CrossRef] [Google Scholar]
- Zibetti, S., Charlot, S., & Rix, H.-W. 2009, MNRAS, 400, 1181 [NASA ADS] [CrossRef] [Google Scholar]
See Bustamente-Rosell et al. (2021) and Regan et al. (2023) for a discussion on a 106 M⊙ MBH in the nearby Leo I  dwarf galaxy.
The documentation for PyXspec can be found here.
The specific globular cluster frequency is often calculated as the total number of globular clusters divided by the galaxy’s stellar mass,  .
.
All Tables
Literature and eROSITA eRASS:4 data for our sample of nucleated galaxies. The complete data table is available at the CDS.
All Figures
|
Fig. 1 Cutouts of eROSITA eRASS:4 images (top panels) and of the DESI Legacy Imaging Surveys (bottom panels) Data Release 10 [Legacy Surveys/D. Lang (Perimeter Institute)] of three galaxies in our sample: NGC 4651, IC 3602 and LEDA 40679. Both images are centered at the input optical coordinates of the NSC (white cross), with the 30″ aperture circle used for X-ray photometry highlighted in white. In case of an X-ray detection (left column) X-ray contours are also overlayed to the optical image (red). |
| In the text | |
|
Fig. 2 Expected X-ray luminosity from the combined high- and low-mass binary population in the 2-10keV range |
| In the text | |
|
Fig. 3 Measured X-ray luminosity in the 2–10 keV range |
| In the text | |
|
Fig. 4 Nuclear star cluster |
| In the text | |
|
Fig. 5 Nuclear star cluster effective radius (reff) versus stellar mass |
| In the text | |
|
Fig. 6 Comparison of literature Chandra, XMM-Newton, or ROSAT X-ray luminosity versus eRASS:4 values. Full colour-coded symbols show X-ray detections in eRASS:4. The dashed line gives the one-to-one values. We compare to Seth et al. (2008), She et al. (2017) and Baldassare et al. (2022) using the 2 to 10 ke V band. Ohlson et al. (2023) give Chandra X-ray data in the 0.5 to 7 keV band. Galaxies, which likely show some X-ray variability, are specifically named. |
| In the text | |
|
Fig. 7 Mass ratio of the SMBH and NSC stellar mass (log10 |
| In the text | |
|
Fig. 8 Galaxy stellar mass (log10 |
| In the text | |
|
Fig. 9 Occupation fraction of nuclear star clusters and active galactic nuclei versus host galaxy stellar mass (log10 |
| In the text | |
Current usage metrics show cumulative count of Article Views (full-text article views including HTML views, PDF and ePub downloads, according to the available data) and Abstracts Views on Vision4Press platform.
Data correspond to usage on the plateform after 2015. The current usage metrics is available 48-96 hours after online publication and is updated daily on week days.
Initial download of the metrics may take a while.