Fig. 2

Download original image
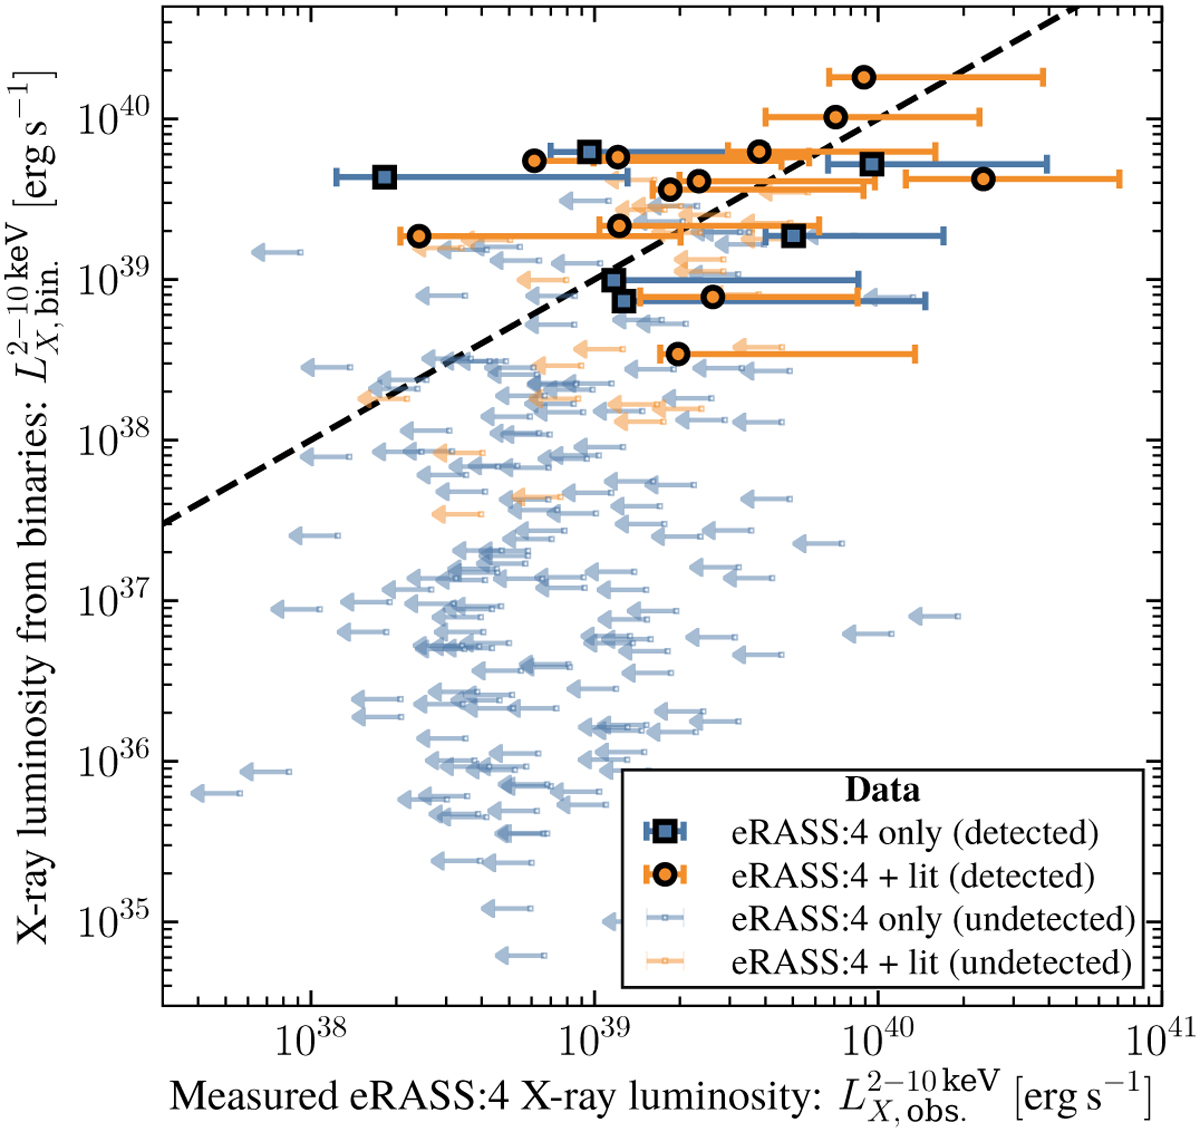
Expected X-ray luminosity from the combined high- and low-mass binary population in the 2-10keV range ![]() versus the measurements
versus the measurements ![]() . We show the detected galaxies (Pbinom ≤3× 10⁻⁴ in the eRASS:4 footprint with blue squares. For non-detections, we plot upper limits using the 99th percentile of the X-ray luminosity (blue arrows). Additionally, we highlight the eRASS:4 luminosities of galaxies with available literature X-ray data (see Sect. 2.4; orange circles). These include data from Seth et al. (2008); She et al. (2017); Baldassare et al. (2022); Ohlson et al. (2023). Some of the galaxies are not detected in the eRASS:4 data but have secure measurements from other instruments available in the literature (orange arrows). A more detailed comparison between the eRASS:4 and literature data is presented in Sect. 3.4.
. We show the detected galaxies (Pbinom ≤3× 10⁻⁴ in the eRASS:4 footprint with blue squares. For non-detections, we plot upper limits using the 99th percentile of the X-ray luminosity (blue arrows). Additionally, we highlight the eRASS:4 luminosities of galaxies with available literature X-ray data (see Sect. 2.4; orange circles). These include data from Seth et al. (2008); She et al. (2017); Baldassare et al. (2022); Ohlson et al. (2023). Some of the galaxies are not detected in the eRASS:4 data but have secure measurements from other instruments available in the literature (orange arrows). A more detailed comparison between the eRASS:4 and literature data is presented in Sect. 3.4.
Current usage metrics show cumulative count of Article Views (full-text article views including HTML views, PDF and ePub downloads, according to the available data) and Abstracts Views on Vision4Press platform.
Data correspond to usage on the plateform after 2015. The current usage metrics is available 48-96 hours after online publication and is updated daily on week days.
Initial download of the metrics may take a while.


