Fig. 4
Download original image
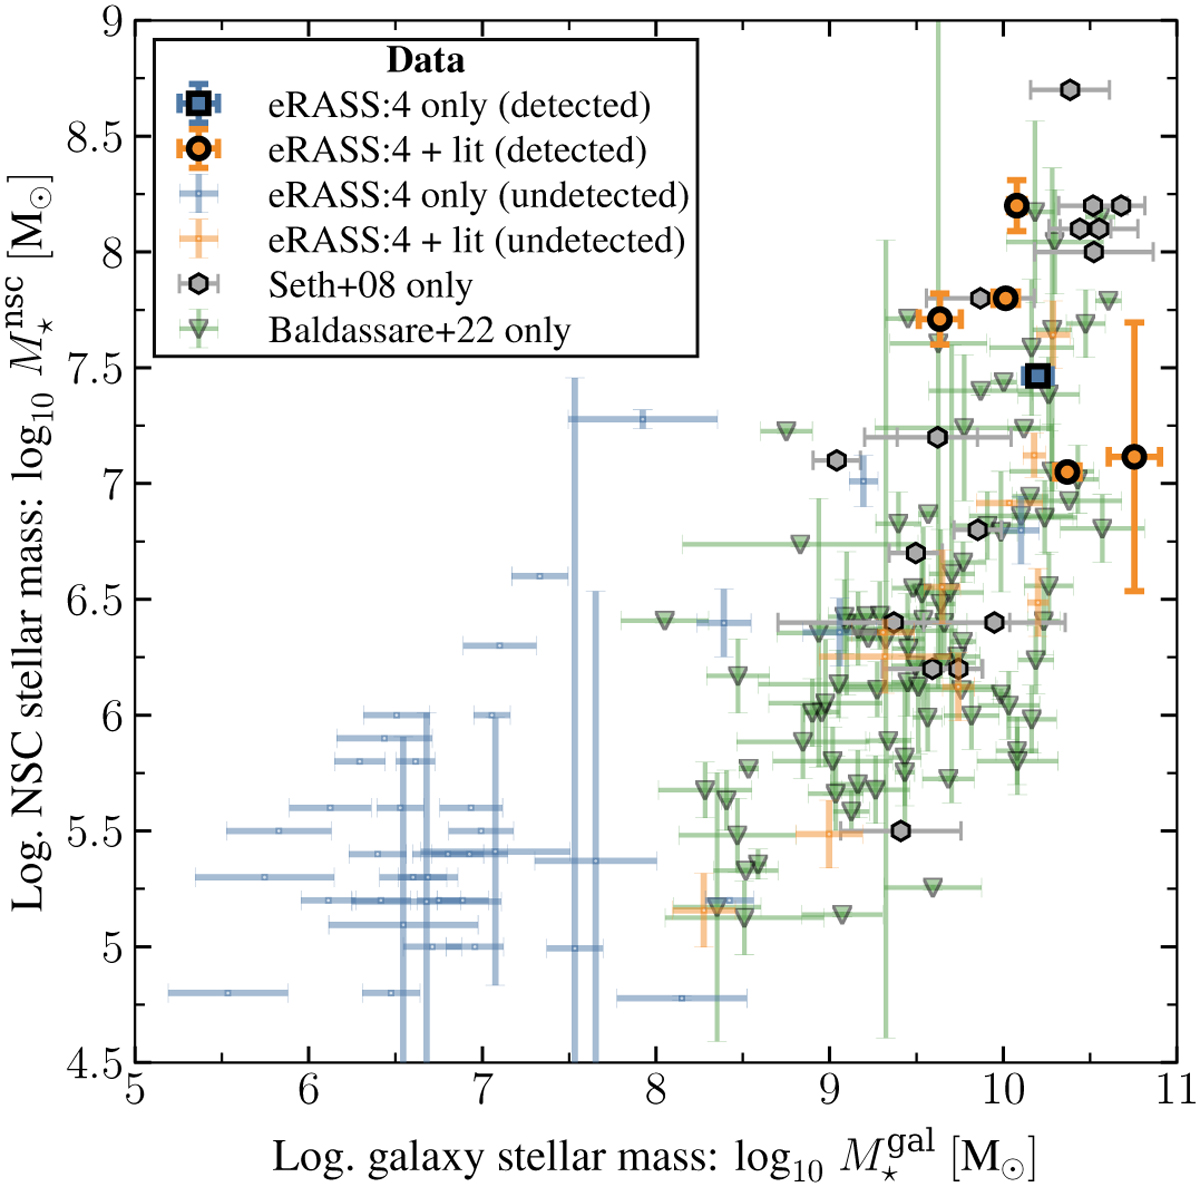
Nuclear star cluster ![]() versus host galaxy stellar mass
versus host galaxy stellar mass ![]() . We show X-ray detected NSCs with full colour, distinguishing between sources only detected with eROSITA (blue) and sources also detected with other instruments (orange). A fainter shade is used for non-detection in the eRASS:4 data. In addition, we show NSCs analysed by Seth et al. (2008, grey hexagons) and Baldassare et al. (2022; green triangles) for NSCs with X-ray emission outside the eRASS:4 footprint (or with significant contamination). A lack of literature data for NSC properties limits the included data set.
. We show X-ray detected NSCs with full colour, distinguishing between sources only detected with eROSITA (blue) and sources also detected with other instruments (orange). A fainter shade is used for non-detection in the eRASS:4 data. In addition, we show NSCs analysed by Seth et al. (2008, grey hexagons) and Baldassare et al. (2022; green triangles) for NSCs with X-ray emission outside the eRASS:4 footprint (or with significant contamination). A lack of literature data for NSC properties limits the included data set.
Current usage metrics show cumulative count of Article Views (full-text article views including HTML views, PDF and ePub downloads, according to the available data) and Abstracts Views on Vision4Press platform.
Data correspond to usage on the plateform after 2015. The current usage metrics is available 48-96 hours after online publication and is updated daily on week days.
Initial download of the metrics may take a while.