| Issue |
A&A
Volume 672, April 2023
|
|
|---|---|---|
| Article Number | A177 | |
| Number of page(s) | 7 | |
| Section | Planets and planetary systems | |
| DOI | https://doi.org/10.1051/0004-6361/202244884 | |
| Published online | 19 April 2023 | |
Photochemical escape of atomic C and N on Mars during the X8.2 solar flare on 10 September 2017
1
Planetary Environmental and Astrobiological Research Laboratory (PEARL), School of Atmospheric Sciences, Sun Yat-sen University,
Zhuhai, Guangdong,
PR China
2
Center for Excellence in Comparative Planetology, Chinese Academy of Sciences,
Hefei, Anhui,
PR China
e-mail: wuxsh23@mail.sysu.edu.cn
Received:
5
September
2022
Accepted:
13
December
2022
Context. Characterizing the response of the upper Martian atmosphere to solar flares could provide important clues as to the climate evolution of the red planet in the early Solar System, when the extreme ultraviolet and soft X-ray radiation was substantially higher than the present-day level and when these events occurred more frequently. A critical process herein is the Martian atmospheric escape in the form of atomic C and N, as mainly driven by CO2/CO and N2 dissociation.
Aims. This study is devoted to evaluating how these escape rates varied on the dayside of Mars during the X8.2 solar flare on 10 September 2017.
Methods. The background Martian atmospheric structures, before, during, and after the flare, are constructed from the Neutral Gas and Ion Mass Spectrometer measurements made on board the Mars Atmosphere and Volatile Evolution spacecraft, from which the hot C and N production rate profiles via different photon and photoelectron impact channels and on different flare stages are obtained. They are combined with the respective escape probability profiles computed using a test particle Monte Carlo approach to derive the atomic C and N escape rates on the dayside of Mars.
Results. Our calculations indicate that the pre-flare C and N escape rates are (1.3−1.4) × 1024 s−1 over the dayside of Mars. During the event, we find a modest decrease in the C escape rate of 8% about 1 h after the flare peak, followed by a recovery to the pre-flare level several hours later. However, an opposite trend is found for the N escape rate during the same period, which shows an increase of 20% followed by a recovery to the pre-flare level.
Conclusions. The distinction between C and N in terms of the variation in the escape rate during the solar flare reflects the competition between two flare-induced effects: enhanced hot atom production via dissociation and enhanced collisional hindrance due to atmospheric expansion.
Key words: planets and satellites: atmospheres / planets and satellites: individual: Mars / planets and satellites: terrestrial planets
© The Authors 2023
 Open Access article, published by EDP Sciences, under the terms of the Creative Commons Attribution License (https://creativecommons.org/licenses/by/4.0), which permits unrestricted use, distribution, and reproduction in any medium, provided the original work is properly cited.
This article is published in open access under the Subscribe to Open model. Subscribe to A&A to support open access publication.
1 Introduction
Many aspects of the upper Martian atmosphere are strongly influenced by solar extreme ultraviolet (EUV) and soft X-ray (SXR) radiation. Firstly, the atmospheric thermal structure is known to vary systematically with the incident solar irradiance, in terms of both the absolute temperature (Forbes et al. 2008; Jain et al. 2015) and heating efficiency (Gu et al. 2020b). Secondly, the ionized portion of the upper atmosphere, normally referred to as the ionosphere, is predominantly solar-driven, manifesting as an enhanced peak electron or ion density at high solar activities (Morgan et al. 2008; Huang et al. 2020). Thirdly, the atmospheric neutral escape rate also responds quite sensitively to solar radiation, owing to an enhanced dissociative recombination (DR) of  (for O escape) or enhanced CO and N2 dissociation (for C and N escape) at high solar activities (Lillis et al. 2017; Cui et al. 2019).
Along with the 11-yr solar cycle and 25-day solar rotation period, the solar EUV and SXR irradiance can be elevated by a large factor over the short duration of solar flares, from tens of minutes to hours. The response of the upper Martian atmosphere to these events is particularly interesting because it may provide important clues as to the climate evolution of Mars in the early Solar System when the EUV and SXR radiation was much higher than the present-day level and when the flare events occurred more frequently. Because of this, many efforts have been devoted to various aspects of such a response, either numerically or observationally.
The response of the upper Martian atmosphere to solar flares was investigated by Thiemann et al. (2015) and Elrod et al. (2018), who revealed significant heating during flares and concomitant density enhancement driven by thermal expansion. Enhanced  ultraviolet doublet and CO cameron band emission has also been observed during flares, especially at relatively low altitudes, where SXR photons deposit most of the energy (Jain et al. 2018). Meanwhile, the response also occurs when the relative O and CO2 abundances vary, likely owing to flare-induced variations in CO2 dissociation and concomitant O production (Thiemann et al. 2018; Cramer et al. 2020). Finally, the Martian ionospheric structure is known to vary substantially during flares, manifesting as an enhancement in both photoelectron intensity and cold plasma content (Mendillo et al. 2006; Xu et al. 2018).
Solar-driven atmospheric escape has long been known to modulate the long-term evolution of the Martian climate. Mayyasi et al. (2018) show that the H thermal escape rate increased by a factor of 5 during the X8.2 solar flare on 10 September 2017, mainly through an increase in upper atmospheric temperature. For O photochemical escape via  DR, Lee et al. (2018) estimate that the O escape rate increased modestly by 20% during the same flare in response to the increase in solar EUV. The much larger change in solar SXR is less important as the SXR photons affect the
  content below the ionospheric peak, where hot O atoms are less likely to escape due to frequent collisions with the ambient neutrals. Such a conclusion was later confirmed by Thiemann et al. (2018).
Photochemical processes also contribute to substantial C and N escape on Mars due to CO and N2 photolysis (Fox 1993; Fox & Bakalian 2001; Bakalian & Hartle 2006; Bakalian 2006; Cui et al. 2019). The more recent investigation by Lo et al. (2021), however, proposed CO2 photolysis as a more important contributor to C escape based on the new cross section data of Lu et al. (2014). All the above processes clearly depend on the incident solar EUV and SXR irradiance, thus indicating a potential response of atomic C and N escape on Mars to solar flares. This study is devoted to the first evaluation of such a response. We describe our approach in Sect. 2 and the main results in Sect. 3. We then present a discussion and concluding remarks in Sect. 4.
2 Model description
We focus on the well-studied X8.2 solar flare event that occurred on 10 September 2017, during which several aspects of the Martian upper atmospheric response have been thoroughly investigated, including the thermal structure, neutral and ionic composition, airglow emission, and atomic H and O escape (Elrod et al. 2018; Mayyasi et al. 2018; Thiemann et al. 2018; Jain et al. 2018; Lee et al. 2018; Cramer et al. 2020), with the aid of a multiinstrument data set on board the Mars Atmosphere and Volatile Evolution (MAVEN) spacecraft (Jakosky et al. 2015). This event has also been modeled in detail by Fang et al. (2019), revealing both ionospheric perturbations occurring mainly below 110 km driven by enhanced SXR radiation and neutral atmospheric perturbations occurring above 150 km driven by enhanced EUV radiation.
The solar flare peaked at 16:24 hr UT. We display in Fig. 1 (top row), from left to right, the pre-, during-, and post-flare incident solar spectra at the top of the Martian atmosphere over the wavelength range 0.5–189.5 nm, as adapted from Thiemann et al. (2018). In particular, the pre-flare spectrum reflects the average state over a time duration of 3–12 h before the flare peak (including MAVEN orbits #5915, #5916, and #5917), the post-flare spectrum reflects the average state over a time duration of 5–10 h after the flare peak (including MAVEN orbits #5919 and #5920), and the during-flare spectrum is from orbit #5918, with periapsis occurring about 1 h after the flare peak. Compared to the pre-flare level, the during-flare solar flux is enhanced by a factor of 4.6 in SXR (integrated over 1–10 nm) and reduced by a factor of 1.9 in EUV (integrated over 10–100 nm), whereas the post-flare solar flux is comparable over most of the displayed wavelength range. The change in solar flux at longer wavelengths is negligible, and the solar zenith angle during these orbits remains nearly constant at 70°.
In our calculations, the background atmospheric structures, from pre- to post-flare, are adapted from the Neutral Gas and Ion Mass Spectrometer (NGIMS) measurements made during the same MAVEN orbits (Mahaffy et al. 2015). We considered CO2, O, N2, and CO for the purpose of this study. Here we used the NGIMS O densities directly rather than manually adjusting them by imposing a multiplicative factor of ~1.5, as proposed by Fox et al. (2021). Also, as a normal procedure, outbound measurements were excluded to avoid possible contamination by physical adsorption/desorption or heterogeneous chemistry on the instrument antechamber walls. The full density profiles used in our calculations cover the altitude range 100–500 km and were constructed with the procedure described in Wu et al. (2020). Specifically, the NGIMS CO2 and N2 densities were used to establish the temperature profile and eddy diffusion coefficient profile based on the empirical formulism of Krasnopolsky (2002), which allows the density profiles of all species to be readily derived with the aid of the hydrostatic or diffusion equation.
All density profiles adopted in our background atmosphere are displayed in Fig. 1 up to 400 km (middle row). Detailed comparisons between the pre- and during-flare conditions indicate that the exobase temperature increases significantly, from 170 K to 220 K, as a result of flare-induced heating, and the atmospheric densities also increase substantially as a result of flare-induced thermal expansion, by a factor of 2.8 for CO2, 1.9 for O, 2.2 for N2, and 1.9 for CO, all referred to a common altitude of 200 km. In addition, a clear change in the atmospheric composition is witnessed, in the form of an increased O/CO2 ratio from 4.9 (pre-flare) to 9.4 (during-flare) as a result of flare-induced dissociation; these refer to a constant total density level of 107 cm−3. These features are fully compatible with the established scenario of the Martian upper atmospheric response to solar flares (e.g., Elrod et al. 2018; Thiemann et al. 2018; Cramer et al. 2020).
Lo et al. (2021) report a contribution of 15% from photoelectron impact dissociation to hot C production in the upper Martian atmosphere, motivating us to include similar processes in our calculations. For such a purpose, information on the photoelectron energy spectrum was required, which is luckily provided by the MAVEN Solar Wind Electron Analyzer (SWEA) measurements (Mitchell et al. 2016). However, due to the incomplete coverage of available SWEA data (near the flare peak), here we constructed a two-stream, quasi-steady-state kinetic model to derive the photoelectron energy spectra from 3 eV to 5 keV for all three stages. We simultaneously solved the upward and downward photoelectron fluxes as a function of the energy and altitude, ignoring the effects of the magnetic field for simplicity. A large number of electron-neutral collision channels, both elastic and inelastic, were included to accurately model the electron energy degradation process. Coulomb collisions, which only affect the low energy portion of the model photoelectron spectra and are irrelevant for impact dissociation, were ignored. In our calculations, we assumed a local energy degradation at the lower boundary, whereas we assumed a zero downward flux and a constant upward flux gradient at the upper boundary. The model results indicate, as expected, comparable pre- and post-flare photoelectron spectra intensities but considerably enhanced during-flare photoelectron intensities at all altitudes and all energies. Examples are provided in Fig. 1 (bottom row), which compares the model photoelectron energy spectra in both the upward and downward directions at two representative altitudes, 150 km and 200 km, for all three stages. The enhancement in photoelectron flux is clearly visible, which is more evident at the high energy end.
We were thus able to compute the hot C and N production rate profiles via both photon and photoelectron impact processes. To derive the escape rates, these production rate profiles should be combined with the respective escape probability profiles, which are numerically obtained by implementing a test-particle Monte Carlo model. For each hot atom, the escape probability is a function of the release altitude, as well as the magnitude and direction of the initial velocity. Our model is analogous to existing models of photochemical escape on Mars (e.g., Bakalian & Hartle 2006; Bakalian 2006; Fox & Hac 2009, 2014, 2018) and has been extensively used in our previous investigations of nonthermal escape on various Solar System objects (e.g., Gu et al. 2020a, 2021). Specifically, a spherically asymmetric atmosphere was adopted in all our calculations. The collisions between hot atoms and background neutrals were assumed to vary with the relative energy between the two colliding partners, with the relevant cross sections taken from Fox & Hac (2018) and the scattering angle distribution taken from Gacesa et al. (2020). All inelastic processes, such as collisional excitation, were ignored in our calculations. For each model run, a total number of 100000 particles were released at any given altitude, with the distribution of the initial velocity direction assumed to be isotropic and the distribution of the initial energy obtained from the respective differential dissociation rate. In our calculations, dissociation cross sections for CO2, CO, and N2 were adapted from Heays et al. (2017) and Gacesa et al. (2020) for photon impact processes and from Cui et al. (2011) and Lo et al. (2021) for photoelectron impact processes.
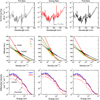 |
Fig. 1 Top: From left to right, the pre-, during-, and post-flare solar EUV and SXR spectra adapted from Thiemann et al. (2018) over the wavelength range 0.5–189.5 nm. The pre-flare spectrum (gray) is superimposed on the during-flare spectrum (red) for comparison. Middle: From left to right, the pre-, during-, and post-flare Martian upper atmospheric structure in terms of the CO2 (black), O (red), CO (orange), and N2 (green) density profiles, all constructed with the aid of the MAVEN NGIMS measurements. Bottom: From left to right, the pre-, during-, and post-flare photoelectron energy spectra modeled with a two-stream kinetic approach at 150 km (blue) and 200 km (red), respectively, in both the upward (solid) and downward (dashed) directions. Note that the photoelectron spectra in the two directions are nearly indistinguishable at 150 km. |
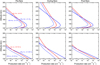 |
Fig. 2 Hot C (blue) and N (red) production rate profiles in the upper Martian atmosphere for the pre-, during-, and post-flare stages, from left to right. The situations for photon and photoelectron impact processes are presented separately in the top and bottom rows. For hot C, we show the results for both CO2 (solid) and CO (dashed) dissociation. |
3 Model results
The hot atom production rate profiles are depicted in Fig. 2 for the pre-, during-, and post-flare stages, from left to right. The situations for photon and photoelectron impact processes are shown separately in the top and bottom rows, respectively. In the top row, different production channels are shown: CO and CO2 photolysis, the two most important hot C production channels, and N2 photolysis, the dominant hot N production channel. The roles of these channels have been well identified in previous studies (e.g., Fox 1993; Fox & Bakalian 2001; Bakalian & Hartle 2006; Bakalian 2006; Cui et al. 2019; Lo et al. 2021). In particular, CO2 photolysis always produces more hot C atoms than CO photolysis near and below the exobase, whereas CO becomes more important at higher altitudes, in agreement with the recent finding of Lo et al. (2021). Over the displayed altitude range, the effects of photoelectron impact processes are found to be non-negligible, contributing to 30% of hot C production and 25% of hot N production for the pre- and post-flare stages, and contributing 40% of hot C production and 35% of hot N production for the during-flare stage. The results for C agree roughly with those of Lo et al. (2021). For CO dissociation, we separately evaluated two photolytic channels that produce ground state and excited state C atoms but did not distinguish between them for photoelectron impact dissociation due to the lack of relevant cross section data. It is also noteworthy that photoelectron impact dissociation tends to be more effective at low altitudes, in response to a more significant enhancement in solar SXR than in solar EUV.
Interesting features can be seen by comparing different flare stages. Referring to a fixed altitude of 200 km and combining all channels, the hot C production rate increases from 0.7 cm−3 s−1 (pre-flare) to 2.5 cm−3 s−1 (during-flare) and then decreases back to 0.7 cm−3 s−1 (post-flare), where we have included the contributions from both CO and CO2 dissociation. Similarly, the hot N production rate increases from 0.7 cm−3 s−1 (pre-flare) to 2.0 cm−3 s−1 (during-flare) and then decreases back to 0.6 cm−3 s−1 (post-flare). Figure 2 also clearly reveals that the flare-induced enhanced production of hot C and N becomes more prominent with increasing altitude. To be more quantitative, the flare-induced variation in hot N production above 200 km is characterized by a scale height change from 15 km (pre-flare) to 26 km (during-flare) and then back to 16 km (post-flare), whereas for hot C production, the same scale height changes from 13 km (pre-flare) to 20 km (during-flare) and then back to 14 km (post-flare). These features are obviously driven by the flare-induced enhancement in both dissociation and heating, along with the concomitant thermal expansion of the whole upper atmosphere (e.g., Thiemann et al. 2015; Elrod et al. 2018; Cramer et al. 2020).
In Fig. 3, we show the escape probability profiles for various photochemical channels. For each case, the escape probability rapidly increases with increasing altitude over a narrow altitude range more or less centered around 200 km, from essentially zero to a constant level at sufficiently high altitudes. Such a trend is in agreement with numerous previous results (e.g., Lee et al. 2018). Of particular interest is the high altitude asymptotic probability, which is greater than 50% under certain circumstances as a result of the backward scattering of escaping atoms (Fox & Hac 2009, 2014), a feature that is not predicted by the idealized exobase approximation and can only be properly modeled with the Monte Carlo approach. The escape probability profiles for several channels (CO photolysis producing excited state atoms and CO2 photolysis) are exceptionally low compared to the other two. This is because a significant portion of the released hot C atoms from these two channels have nascent energies below the local escape energy owing to their large dissociation thresholds. When compared to both the pre- and post-flare stages, all escape probability profiles near the flare peak appear to be shifted upward by several kilometers, implying that hot atoms tend to be more seriously hindered by collisions with ambient neutrals as a consequence of the thermal expansion of the whole upper atmosphere.
Combing the numerical results from the hot atom production rate and escape probability (denoted as Pj and ϵj for channel j), we were able to easily compute the respective escape rate (denoted as Lj) via
 (1)
(1)
where RM is the solid body radius of Mars and z is the altitude. The computed escape rates over the dayside of Mars are listed in Table 1 for reference. Under all circumstances, the contribution from photoelectron impact dissociation to escape is much smaller than the respective contribution to hot atom production (25–40%), because hot atoms released from such a process are preferentially located at low altitudes (see above) and hence less likely to escape due to more frequent collisions with ambient neutrals. This accounts for the fact that the total C and N escape rates are mostly driven by direct photolysis. For C escape, the contribution from CO2 photolysis is significantly reduced near the flare peak, whereas the contribution from CO photolysis is instead enhanced (see below). Because the former is a more important channel driving C escape, we reached the conclusion that the effect of the solar flare is to reduce the total C escape rate by 8%. For N escape, however, an opposite trend is predicted by our calculations, with the total N escape rate enhanced by a factor of nearly 20% near the flare peak. As expected, the escape rates for both species fall back to their initial levels during the post-flare stage when the solar EUV and SXR irradiance recovers to the pre-flare level.
Obviously, the response of the Martian photochemical escape to solar flares is the combined result of two competing effects. On the one hand, enhanced solar EUV and SXR irradiance causes enhanced photon and photoelectron impact dissociation, which naturally produces more candidate escaping atoms. On the other hand, enhanced solar irradiance also significantly heats the upper atmosphere and causes its expansion, implying more frequent collisions with ambient neutrals that hinder escape. For hot C, the latter effect is more important than the former, thus leading to an overall weaker flare-induced C escape. For hot N, it appears that the latter becomes less important, that is to say, the effect of enhanced collisional hindrance is insufficient to offset the effect of enhanced hot N production.
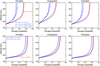 |
Fig. 3 C (blue) and N (red) escape probability profiles in the upper Martian atmosphere for the pre-, during-, and post-flare stages, from left to right. The situations for photon and photoelectron impact processes are presented in the top and bottom rows, respectively. In the top row, we show the results for CO photolysis producing both ground (dashed) and excited (dash-dotted) state atoms, whereas in the bottom row, we do not distinguish between the two channels due to the lack of relevant cross section data. |
Dayside atomic C and N escape rates on Mars in units of s−1 for the pre-, during-, and post-flare stages and for various photochemical channels.
4 Discussion and concluding remarks
In this study we examine the variation in atomic C and N escape on Mars during the X8.2 solar flare on 10 September 2017. A modest decrease in the C escape rate of 8% is observed about 1 h after the flare peak, which is followed by a recovery to the pre-flare level several hours later. An opposite trend is observed for the N escape rate, which shows a fairly significant increase of 20% followed by a recovery to the pre-flare level. This distinction reflects the competition between two flare-induced effects: enhanced hot atom production via photolysis (along with concomitant photoelectron impact dissociation) and enhanced collisional hindrance due to atmospheric expansion. The results reported here can be favorably compared to several existing investigations, which we discuss in turn below.
Firstly, during the entire course of the flare event, our derived C escape rate remained at the level of 1024 s−1, in good agreement with the recent result of Lo et al. (2021) and within the range reported earlier in Gröller et al. (2014) despite the fact that the latter included neither CO2 photolysis nor any photoelectron impact dissociation process in their calculations. The atomic N escape rate derived here is also at the level of 1024 s−1, consistent with the high solar activity value of Bakalian & Hartle (2006).
Secondly, the variations in the C and N escape rates with solar irradiance were recently investigated by Cui et al. (2019), which we find to be fully compatible with the flare-induced variations reported here. Both studies suggest that the N escape rate increases when the solar irradiance is elevated. A comparison of the C escape rate deserves some caution. At face value, Cui et al. (2019) reported a positive correlation for C escape with solar irradiance, whereas in this study, an opposite correlation is inferred. However, this does not necessarily indicate any conflict because Cui et al. (2019) considered CO dissociation only, and in our calculations we included both CO2 and CO dissociation. In fact, Table 1 does suggest that the portion of the C escape rate driven by CO2 dissociation is reduced during the flare, whereas the portion driven by CO dissociation is enhanced instead. We also note that photoelectron impact dissociation is not included in the calculations of Cui et al. (2019), which contributes to a non-negligible fraction of total C and N escape.
Thirdly, a comparison with atomic O escape provides some interesting insights into the response of the upper Martian atmosphere to solar flares. Such a response has been modeled in detail by Lee et al. (2018), who reported an enhancement of 20% in the O escape rate right at the flare peak followed by a rapid reduction of 13% about 2.5 h later. It thus appears that O escape responds quite instantaneously during the flare event, which could be understood in terms of a nearly instantaneous ionospheric response to the change in solar irradiance. Clearly, the flare-induced variations in atomic C and N escape should be different because they are driven by the delayed neutral atmospheric response. Due to the scarcity of available data, numerical calculations are required to distinguish between the flare-induced variations of different escape processes, which we defer to a follow-up investigation.
Acknowledgments
The authors acknowledge supports from the B-type Strategic Priority Program No. XDB41000000 funded by the Chinese Academy of Sciences and the pre-research project on Civil Aerospace Technologies No. D020105 funded by China’s National Space Administration. This work is also supported by the National Natural Science Foundation of China through grants 42030201 to J.C., 41904154 to X.S.W., and 42105120 to H.G. The in-situ measurements used in this study are publicly available at the MAVEN Science Data Center (https://pds-ppi.igpp.ucla.edu).
References
- Bakalian, F. 2006, Icarus, 183, 69 [NASA ADS] [CrossRef] [Google Scholar]
- Bakalian, F., & Hartle, R. E. 2006, Icarus, 183, 55 [NASA ADS] [CrossRef] [Google Scholar]
- Cramer, A. G., Withers, P., Elrod, M. K., et al. 2020, J. Geophys. Res. (Space Phys.), 125, e28518 [NASA ADS] [Google Scholar]
- Cui, J., Galand, M., Coates, A. J., et al. 2011, J. Geophys. Res. (Space Phys.), 116, A04321 [Google Scholar]
- Cui, J., Wu, X.-S., Gu, H., et al. 2019, A&A, 621, A23 [NASA ADS] [CrossRef] [EDP Sciences] [Google Scholar]
- Elrod, M. K., Curry, S. M., Thiemann, E. M. B., et al. 2018, Geophys. Res. Lett., 45, 8803 [NASA ADS] [CrossRef] [Google Scholar]
- Fang, X., Pawlowski, D., Ma, Y., et al. 2019, Geophys. Res. Lett., 46, 9334 [NASA ADS] [CrossRef] [Google Scholar]
- Forbes, J. M., Lemoine, F. G., Bruinsma, S. L., et al. 2008, Geophys. Res. Lett., 35, L01201 [NASA ADS] [Google Scholar]
- Fox, J. L. 1993, J. Geophys. Res., 98, 3297 [Google Scholar]
- Fox, J. L., & Bakalian, F. M. 2001, J. Geophys. Res., 106, 28785 [NASA ADS] [CrossRef] [Google Scholar]
- Fox, J. L., & Hac, A. B. 2009, Icarus, 204, 527 [NASA ADS] [CrossRef] [Google Scholar]
- Fox, J. L., & Hac, A. B. 2014, Icarus, 228, 375 [NASA ADS] [CrossRef] [Google Scholar]
- Fox, J. L., & Hac, A. B. 2018, Icarus, 300, 411 [NASA ADS] [CrossRef] [Google Scholar]
- Fox, J. L., Benna, M., McFadden, J. P., et al. 2021, Icarus, 358, 114186 [NASA ADS] [CrossRef] [Google Scholar]
- Gacesa, M., Lillis, R. J., & Zahnle, K. J. 2020, MNRAS, 491, 5650 [NASA ADS] [CrossRef] [Google Scholar]
- Gröller, H., Lichtenegger, H., Lammer, H., et al. 2014, Planet. Space Sci., 98, 93 [CrossRef] [Google Scholar]
- Gu, H., Cui, J., Lavvas, P. P., et al. 2020a, A&A, 633, A8 [NASA ADS] [CrossRef] [EDP Sciences] [Google Scholar]
- Gu, H., Cui, J., Niu, D.-D., et al. 2020b, AJ, 159, 39 [NASA ADS] [CrossRef] [Google Scholar]
- Gu, H., Cui, J., Niu, D.-D., et al. 2021, A&A, 650, A130 [NASA ADS] [CrossRef] [EDP Sciences] [Google Scholar]
- Heays, A. N., Bosman, A. D., & van Dishoeck, E. F. 2017, A&A, 602, A105 [NASA ADS] [CrossRef] [EDP Sciences] [Google Scholar]
- Huang, J.-P., Cui, J., Hao, Y.-Q., et al. 2020, J. Geophys. Res. (Space Phys.), 125, e28254 [NASA ADS] [Google Scholar]
- Jain, S. K., Stewart, A. I. F., Schneider, N. M., et al. 2015, Geophys. Res. Lett., 42, 9023 [NASA ADS] [CrossRef] [Google Scholar]
- Jain, S. K., Deighan, J., Schneider, N. M., et al. 2018, Geophys. Res. Lett., 45, 7312 [NASA ADS] [CrossRef] [Google Scholar]
- Jakosky, B. M., Lin, R. P., Grebowsky, J. M., et al. 2015, Space Sci. Rev., 195, 3 [CrossRef] [Google Scholar]
- Krasnopolsky, V. A. 2002, J. Geophys. Res. (Planets), 107, 5128 [Google Scholar]
- Lee, Y., Dong, C., Pawlowski, D., et al. 2018, Geophys. Res. Lett., 45, 6814 [NASA ADS] [CrossRef] [Google Scholar]
- Lillis, R. J., Deighan, J., Fox, J. L., et al. 2017, J. Geophys. Res. (Space Phys.), 122, 3815 [NASA ADS] [CrossRef] [Google Scholar]
- Lo, D. Y., Yelle, R. V., Lillis, R. J., et al. 2021, Icarus, 360, 114371 [NASA ADS] [CrossRef] [Google Scholar]
- Lu, Z., Chang, Y. C., Yin, Q.-Z., et al. 2014, Science, 346, 61 [NASA ADS] [CrossRef] [Google Scholar]
- Mahaffy, P. R., Benna, M., King, T., et al. 2015, Space Sci. Rev., 195, 49 [NASA ADS] [CrossRef] [Google Scholar]
- Mayyasi, M., Bhattacharyya, D., Clarke, J., et al. 2018, Geophys. Res. Lett., 45, 8844 [NASA ADS] [CrossRef] [Google Scholar]
- Mendillo, M., Withers, P., Hinson, D., et al. 2006, Science, 311, 1135 [NASA ADS] [CrossRef] [Google Scholar]
- Mitchell, D. L., Mazelle, C., Sauvaud, J.-A., et al. 2016, Space Sci. Rev., 200, 495 [NASA ADS] [CrossRef] [Google Scholar]
- Morgan, D. D., Gurnett, D. A., Kirchner, D. L., et al. 2008, J. Geophys. Res. (Space Phys.), 113, A09303 [Google Scholar]
- Thiemann, E. M. B., Eparvier, F. G., Andersson, L. A., et al. 2015, Geophys. Res. Lett., 42, 8986 [NASA ADS] [CrossRef] [Google Scholar]
- Thiemann, E. M. B., Andersson, L., Lillis, R., et al. 2018, Geophys. Res. Lett., 45, 8005 [NASA ADS] [CrossRef] [Google Scholar]
- Wu, X.-S., Cui, J., Yelle, R. V., et al. 2020, J. Geophys. Res. (Planets), 125, e06441 [NASA ADS] [Google Scholar]
- Wu, S.-Q., Wu, X.-S., Cui, J., et al. 2022, MNRAS, 513, 1293 [NASA ADS] [CrossRef] [Google Scholar]
- Xu, S., Thiemann, E., Mitchell, D., et al. 2018, Geophys. Res. Lett., 45, 7382 [NASA ADS] [CrossRef] [Google Scholar]
All Tables
Dayside atomic C and N escape rates on Mars in units of s−1 for the pre-, during-, and post-flare stages and for various photochemical channels.
All Figures
|
Fig. 1 Top: From left to right, the pre-, during-, and post-flare solar EUV and SXR spectra adapted from Thiemann et al. (2018) over the wavelength range 0.5–189.5 nm. The pre-flare spectrum (gray) is superimposed on the during-flare spectrum (red) for comparison. Middle: From left to right, the pre-, during-, and post-flare Martian upper atmospheric structure in terms of the CO2 (black), O (red), CO (orange), and N2 (green) density profiles, all constructed with the aid of the MAVEN NGIMS measurements. Bottom: From left to right, the pre-, during-, and post-flare photoelectron energy spectra modeled with a two-stream kinetic approach at 150 km (blue) and 200 km (red), respectively, in both the upward (solid) and downward (dashed) directions. Note that the photoelectron spectra in the two directions are nearly indistinguishable at 150 km. |
| In the text | |
|
Fig. 2 Hot C (blue) and N (red) production rate profiles in the upper Martian atmosphere for the pre-, during-, and post-flare stages, from left to right. The situations for photon and photoelectron impact processes are presented separately in the top and bottom rows. For hot C, we show the results for both CO2 (solid) and CO (dashed) dissociation. |
| In the text | |
|
Fig. 3 C (blue) and N (red) escape probability profiles in the upper Martian atmosphere for the pre-, during-, and post-flare stages, from left to right. The situations for photon and photoelectron impact processes are presented in the top and bottom rows, respectively. In the top row, we show the results for CO photolysis producing both ground (dashed) and excited (dash-dotted) state atoms, whereas in the bottom row, we do not distinguish between the two channels due to the lack of relevant cross section data. |
| In the text | |
Current usage metrics show cumulative count of Article Views (full-text article views including HTML views, PDF and ePub downloads, according to the available data) and Abstracts Views on Vision4Press platform.
Data correspond to usage on the plateform after 2015. The current usage metrics is available 48-96 hours after online publication and is updated daily on week days.
Initial download of the metrics may take a while.