Fig. 1
Download original image
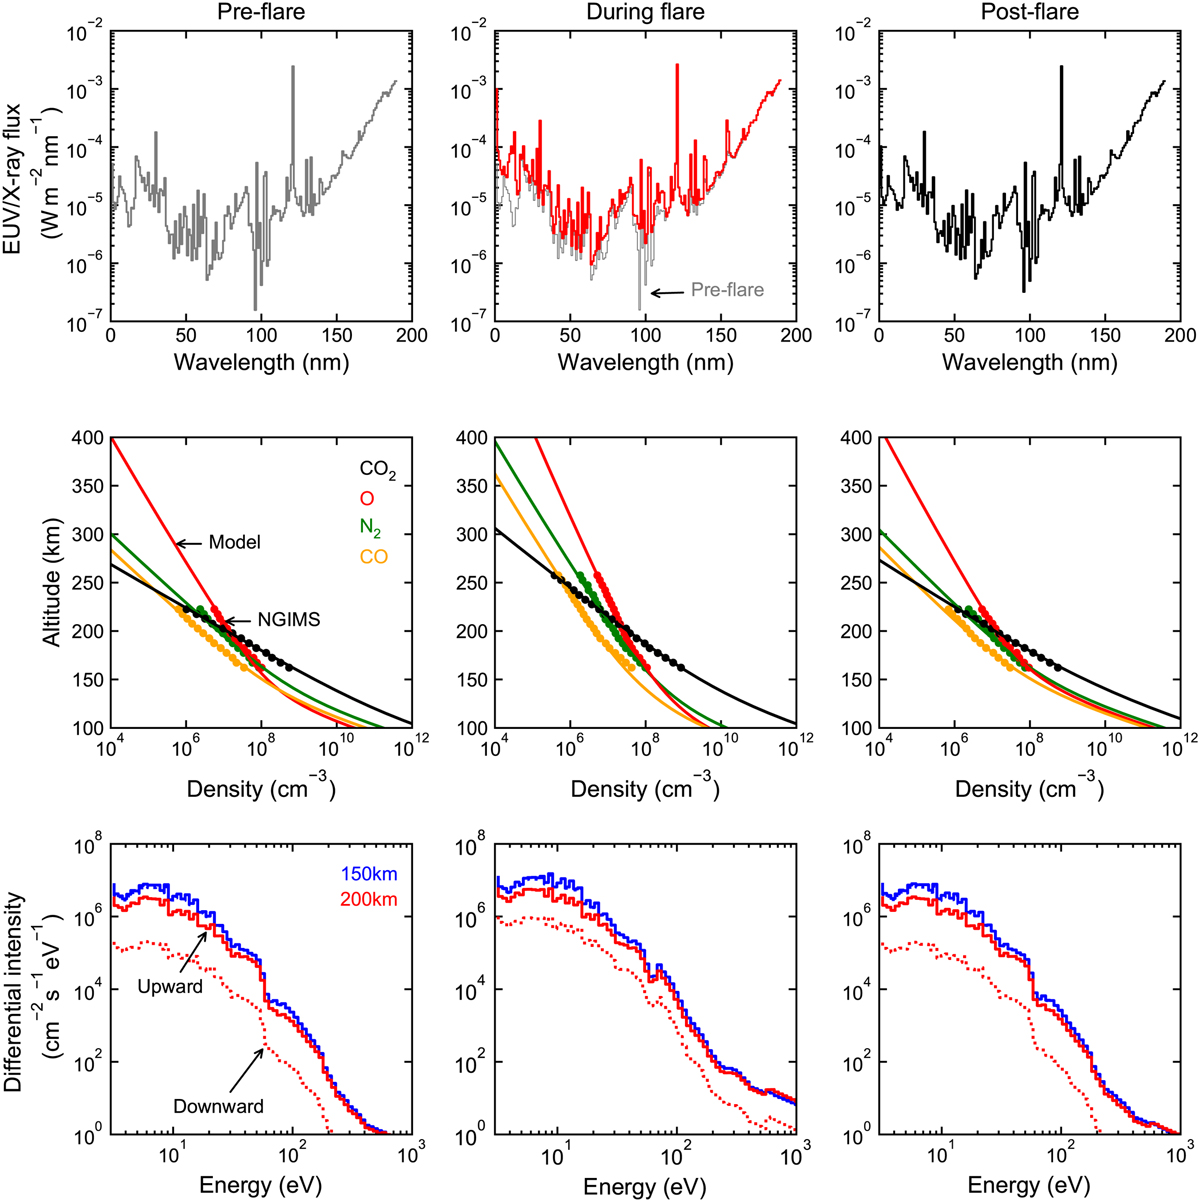
Top: From left to right, the pre-, during-, and post-flare solar EUV and SXR spectra adapted from Thiemann et al. (2018) over the wavelength range 0.5–189.5 nm. The pre-flare spectrum (gray) is superimposed on the during-flare spectrum (red) for comparison. Middle: From left to right, the pre-, during-, and post-flare Martian upper atmospheric structure in terms of the CO2 (black), O (red), CO (orange), and N2 (green) density profiles, all constructed with the aid of the MAVEN NGIMS measurements. Bottom: From left to right, the pre-, during-, and post-flare photoelectron energy spectra modeled with a two-stream kinetic approach at 150 km (blue) and 200 km (red), respectively, in both the upward (solid) and downward (dashed) directions. Note that the photoelectron spectra in the two directions are nearly indistinguishable at 150 km.
Current usage metrics show cumulative count of Article Views (full-text article views including HTML views, PDF and ePub downloads, according to the available data) and Abstracts Views on Vision4Press platform.
Data correspond to usage on the plateform after 2015. The current usage metrics is available 48-96 hours after online publication and is updated daily on week days.
Initial download of the metrics may take a while.