| Issue |
A&A
Volume 671, March 2023
|
|
|---|---|---|
| Article Number | A169 | |
| Number of page(s) | 13 | |
| Section | Planets and planetary systems | |
| DOI | https://doi.org/10.1051/0004-6361/202244685 | |
| Published online | 24 March 2023 | |
The effect of thermal non-equilibrium on kinetic nucleation
1
Institute of Astronomy, KU Leuven,
Celestijnenlaan 200D,
3001
Leuven,
Belgium
e-mail: This email address is being protected from spambots. You need JavaScript enabled to view it.
2
Centre for Exoplanet Science, University of St Andrews,
North Haugh, St Andrews,
KY169SS,
UK
3
Space Research Institute, Austrian Academy of Sciences,
Schmiedlstrasse 6,
8042
Graz,
Austria
4
TU Graz, Fakultät für Mathematik, Physik und Geodäsie,
Petersgasse 16,
8010
Graz,
Austria
5
Department of Chemistry & Molecular Biology, University of Gothenburg,
40530
Göteborg,
Sweden
Received:
5
August
2022
Accepted:
13
February
2023
Abstract
Context. Nucleation is considered to be the first step in dust and cloud formation in the atmospheres of asymptotic giant branch (AGB) stars, exoplanets, and brown dwarfs. In these environments dust and cloud particles grow to macroscopic sizes when gas phase species condense onto cloud condensation nuclei (CCNs). Understanding the formation processes of CCNs and dust in AGB stars is important because the species that formed in their outflows enrich the interstellar medium. Although widely used, the validity of chemical and thermal equilibrium conditions is debatable in some of these highly dynamical astrophysical environments.
Aims. We aim to derive a kinetic nucleation model that includes the effects of thermal non-equilibrium by adopting different temperatures for nucleating species, and to quantify the impact of thermal non-equilibrium on kinetic nucleation.
Methods. Forward and backward rate coefficients are derived as part of a collisional kinetic nucleation theory ansatz. The endother-mic backward rates are derived from the law of mass action in thermal non-equilibrium. We consider elastic collisions as thermal equilibrium drivers.
Results. For homogeneous TiO2 nucleation and a gas temperature of 1250 K, we find that differences in the kinetic cluster temperatures as small as 20 K increase the formation of larger TiO2 clusters by over an order of magnitude. Conversely, an increase in cluster temperature of around 20 K at gas temperatures of 1000 K can reduce the formation of a larger TiO2 cluster by over an order of magnitude.
Conclusions. Our results confirm and quantify the prediction of previous thermal non-equilibrium studies. Small thermal non-equilibria can cause a significant change in the synthesis of larger clusters. Therefore, it is important to use kinetic nucleation models that include thermal non-equilibrium to describe the formation of clusters in environments where even small thermal non-equilibria can be present.
Key words: astrochemistry / methods: analytical / planets and satellites: atmospheres / stars: AGB and post-AGB
© The Authors 2023
 Open Access article, published by EDP Sciences, under the terms of the Creative Commons Attribution License (https://creativecommons.org/licenses/by/4.0), which permits unrestricted use, distribution, and reproduction in any medium, provided the original work is properly cited.
This article is published in open access under the Subscribe to Open model. This email address is being protected from spambots. You need JavaScript enabled to view it. to support open access publication.
1 Introduction
Signatures of active dust formation are present in many astro-physical environments. For example, asymptotic giant branch (AGB) and Wolf- –Rayet (WR) stars have been studied as dust-producing environments (Williams et al. 1987; Winters et al. 1994, 1995; Woitke et al. 2000; Ferrarotti & Gail 2006; Höfner 2009; Gail 2010; Karovicova et al. 2013; Gobrecht et al. 2016; Gupta & Sahijpal 2020). Dust produced within these environments is ejected into the interstellar medium (ISM) by radiation pressure on dust particles and thus plays an important role in the chemical enrichment of the ISM (Matsuura et al. 2009; Ventura et al. 2020). In exoplanets, observations of mass-losing atmospheres (e.g. Lieshout et al. 2014) and exoplanet atmospheres (e.g. Kreidberg et al. 2014) have shown evidence of dust and clouds, respectively. Various models have been developed to describe the formation of cloud particles or their effects on exoplanet and brown dwarf atmospheres (e.g. Tsuji et al. 1996; Tsuji 2002, 2005; Allard et al. 2001, 2003; Ackerman & Marley 2001; Woitke & Helling 2003; Helling et al. 2008). Because of the large cloud opacities in the optical wavelength regime, transmission spectra obtained from cloudy planets are typically featureless at those wavelengths (Pont et al. 2008, 2013; Bean et al. 2010; Crossfield et al. 2013; Knutson et al. 2014; Sing et al. 2015, 2016).
Nucleation describes the clustering of gas-phase species to cloud condensation nuclei (CCNs). One way of describing CCN formation is classical nucleation theory (CNT). This theory assumes chemical and thermal equilibrium of the gas phase, and that the Gibbs free energy of formation of the nucleating species can be approximated by macroscopic properties (see e.g. Helling & Fomins 2013). Modified classical nucleation theory (MCNT) extends CNT by connecting the surface tension with the Gibbs free energy of the nucleating cluster species (Draine & Salpeter 1977; Gail et al. 1984; Lee et al. 2018).
Recently, Tielens (2022) pointed out the importance of kinetics for dust formation in astrophysical environments. In order to study nucleation in chemical non-equilibrium, kinetic reaction networks including nucleation theory can be used (e.g. Girshick & Chiu 1990; Kalikmanov & van Dongen 1993; Patzer et al. 1998; Boulangier et al. 2019; Gobrecht et al. 2022). Starting from the smallest entities of a substance corresponding to one stoichiometric formula unit (a monomer; e.g. TiO2), these particles react to form larger (sub-)nanometre-sized structures (e.g. TiO2 + (TiO2)8 → (TiO2)9). These larger particles are subsequently referred to as clusters or N-mers. For small clusters the nucleation is likely to proceed as termolecular reactions involving a third body. Conversely, larger clusters can dissociate into smaller clusters or monomers at sufficiently high temperatures (e.g. (TiO2)9 → TiO2 + (TiO2)8). In many cases, the dissociations are induced by collisions.
The Becker-Döring equations (Becker & Döring 1935; Burton 1977; Penrose & Lebowitz 1979) describe kinetic nucleation if cluster growth and dissociation happens solely via monomers and the same chemical species. Their framework was later extended to polymer nucleation (Ball & Carr 1990; Carr 1992; Carr & da Costa 1994). We note that the nucleation can also proceed via cluster stoichiometries that are different from the crystalline bulk (i.e. the mineral).
Constructing comprehensive chemical kinetic networks for modelling dust nucleation and growth in stellar outflows is a complex task (Gail & Sedlmayr 1998, 1999; Plane 2013; Gobrecht et al. 2016; Bromley et al. 2016; Gobrecht et al. 2022). In addition to the challenges in modelling chemical non-equilibrium, the assumption of thermal equilibrium has been criticised (Donn & Nuth 1985; Goeres 1996; Sedlmayr & Krüger 1997; Ferrarotti & Gail 2002). Recent observations of AGB stars (Fonfría et al. 2008, 2017, 2021) confirmed the presence of thermal non-equilibrium.
Plane & Robertson (2022) analysed the effect of vibrational non-equilibria on the dissociation rate of silicate clusters, OSi(OH)2, in stellar outflows. They found that the corresponding dissociation rate of OSi(OH)2 is reduced by several orders of magnitude in vibrational non-equilibrium. Reactions of Ca, Fe, and Mg with OSi(OH)2 might represent promising pathways to create metal silicon oxide clusters (e.g. CaSiO3, FeSiO3, and MgSiO3). Combining the thermal non-equilibrium dissociation rate of OSi(OH)2 with the chemical network of Plane (2013) showed that the reduced dissociation rate of OSi(OH)2 increased the abundance of Ca-, Fe-, and Mg-bearing silicate clusters. This chemical network also includes TiO2 which can form Ca, Fe, and Mg titanates via OTi(OH)2. The impact of thermal non-equilibrium on Ti-and Si-bearing nucleating species is considered to be important for dust formation (e.g. Waters et al. 1996; Gail & Sedlmayr 1999; Goumans & Bromley 2013; Lee et al. 2015; Gobrecht et al. 2016; Bromley et al. 2016; Boulangier et al. 2019; Sindel et al. 2022).
Thermal non-equilibrium is not only important for small molecular dust precursors but also for larger clusters (Nuth et al. 1985). Nuth & Ferguson (2006) analysed the impact of vibrational non-equilibrium on the nucleation of SiO. They used the vibrational temperature of a single SiO molecule to approximate the vibrational temperatures of larger (SiO)N clusters (Nuth & Donn 1981). Using this approximation, they analysed the applicability of CNT in circumstellar environments and found that the presence of vibrational disequilibrium enables SiO dust formation at higher kinetic temperatures. Although the authors conclude that CNT cannot be made to work in expanding circumstellar shells, CNT is used owing to the lack of a suitable alternative. Even though the importance of thermal non-equilibrium on titania and silica dust precursors has been shown, only a few modelling attempts have been made to include thermal non-equilibrium in kinetic nucleation models (Patzer et al. 1998; Lazzati 2008; Köhn et al. 2021; Plane & Robertson 2022). These models start from thermal equilibrium conditions and include two different temperatures, one for the gas phase species and one for the clusters or dust.
In this study, we test and quantify the predicted importance of thermal non-equilibrium on kinetic nucleation. We prescribe different temperatures for each considered cluster size and we study the effect of different kinetic (translational) temperatures. We aim to address internal (vibrational and rotational) thermal non-equilibrium in more detail in a future study.
This paper is organized as follows. We derive a kinetic nucleation framework from first principles including thermal and chemical non-equilibrium (Sect. 2). In Sect. 3, relaxation timescales for collisional and radiative cooling and heating processes are analysed in order to determine the importance of thermal non-equilibrium. We then use our model and recently published thermodynamic data to quantify the effects of thermal non-equilibrium on nucleation in Sect. 4. Lastly, we present our conclusions in Sect. 5.
2 Kinetic nucleation model
In this section, we describe the kinetic nucleation model. In Sect. 2.1, the approach of Boulangier et al. (2019) is used to show how the chemical reaction network formalism can be used to describe polymer nucleation. In Sect. 2.2, the derivation of the Maxwell-Boltzmann relative speed distribution in thermal non-equilibrium is made and in Sects. 2.3, 2.4, and 2.5 the forward and backward reaction rates are derived.
2.1 Kinetic reactions
Each cluster consists of N basic building blocks (e.g. TiO2) that are linked by chemical bonds (e.g. (TiO2)N). The change in cluster number densities nN (cm−3) can be described by the following coupled ordinary differential equations (ODEs) (Eq. (1) of Boulangier et al. 2019):
 (1)
(1)
where FN is the set of forward reactions  and 𝒟N is the set of backward reactions
  . In the following, Rj is defined as either
  or
or  and each variable specific to reaction Rj has a j subscript. Similarly, kj is either
  or
or  . The variable nr (cm−3) denotes the number densities of the cluster involved in reaction Rj and kj (cm3(J−1) s−1) is the reaction rate for the reaction Rj, where J is the number of reactants in reaction Rj. For small cluster sizes and low densities, three-body association reactions are the dominant cluster nucleation process (see e.g. Bromley et al. 2016). The reaction rates for termolecular associations and their reverse collisional dissociation are discussed in Sect. 2.4. For larger clusters, two-body association reactions (J=2) are assumed to be the dominant forward reaction for which the reaction rate
  is the following (based on Peters 2017):
 (2)
(2)
where αj(νr) is the sticking coefficient, σj(νr) (cm2) the reaction cross section, νr (cms−1) the relative velocity of the colliding particles, and f(νr) the Maxwell-Boltzmann velocity distribution (see Sect. 2.2). Due to the lack of data on sticking coefficients for nucleating species, we set αj(νr) = 1 for the rest of this paper. Therefore, all reaction rates are upper limits. This is a frequently used approximation for the sticking coefficient (e.g. Lazzati 2008; Bromley et al. 2016; Boulangier et al. 2019).
The cross section is a measure of the probability that a cluster reacts with other clusters1. In the most general case, it can depend on the relative velocity νr. For small clusters, longrange interactions from electrostatic forces need to be taken into account2 (Bromley & Zwijnenburg 2016; Köhn et al. 2021). We describe the cross section by a collision of two hard spheres:
 (3)
(3)
where r1 and r2 (cm) are the interaction radii of the collision partners. We provide interaction radii for (TiO2)N clusters (Table A.1), which are used in our reference nucleation case.
The goal of the present study is to assess the impact of thermal non-equilibrium on the kinetic formation of clusters. The gas is assumed to be in thermal equilibrium, but the clusters might not be. Clusters of a given size N are described by a kinetic cluster temperature  and an internal cluster temperature
  which can differ from each other and from the gas phase temperature Tgas. The internal temperature includes vibrational and rotational contributions which are not differentiated further in the present study.
An N-mer is composed of Nx1 atoms, where x1 is the number of atoms in a monomer unit. Therefore an N-mer has 3Nx1 degrees of freedom of which three describe translational movement and  describe internal degrees of freedom (including three rotations and 3Nx1 – 6 vibrations). Using the equipartition theorem, we can define
 (4)
(4)
where k = 1.381 × 10⁻¹⁶ ergK−1 is the Boltzmann constant. In our model, each cluster size can be at a different kinetic temperature  and at a different internal temperature
  .
.
2.2 Two-particle speed distribution
To derive the relative speed distribution for two particle ensembles (P1 and P2) with different masses (m1 and m2) and temperatures (T1 and T2), we follow the derivation of Kusakabe et al. (2019). We use an adapted version of their centre of mass transformation, which we call the temperature-weighted centre of mass (TCM). We perform the TCM transformation as follows:
 (5)
(5)
 (6)
(6)
 (7)
(7)
 (8)
(8)
 (9)
(9)
where m1, m2 (g) are the masses of the particles within P1 and P2, respectively. Furthermore,  ,
,  (K) are their kinetic temperatures and ν1 ν2 (cm s−1) their velocity. In addition, MT (g T−1) is the temperature-weighted total mass, µ (g) the reduced mass, µT (g T−1) the temperature-weighted reduced mass, νr (cm s−1) the relative velocity, and υT (cm s−1) the TCM velocity. Using these definitions, we can find the following relation:
 (10)
(10)
From here, we assume that the velocity distribution of the clusters follows the Maxwell-Boltzmann velocity distribution for a particle of mass m (g):
 (11)
(11)
The relative velocity distribution fr(υr)can be found using an equivalent derivation3 as in Eqs. (9) and (10) of Kusakabe et al. (2019):
 (12)
(12)
 (13)
(13)
 (14)
(14)
Assuming spherical symmetry  , this leads to the following relative speed distribution:
 (15)
(15)
which is similar to a Maxwell-Boltzmann distribution of the centre of mass frame, but the temperature-weighted reduced mass µT replaces the reduced mass. This distribution can be used to describe the relative velocity of two particle ensembles (e.g. a cluster of different sizes) at different temperatures.
For large temperature differences (e.g.  ) or large mass differences (e.g. m1 ≪ m2), µT becomes
 (16)
(16)
which recovers the Maxwell-Boltzmann distribution for the particle ensemble P1 . If the collision partners have the same kinetic temperature  , we find
 (17)
(17)
which recovers the result for thermal equilibrium, defined as  (Boulangier et al. 2019).
2.3 Forward reaction rate
Combining Eqs. (2), (3), and (15), we find a general expression for the forward reaction rate  of a two-body collision between particles from P1 (with m1 and T1) and particles from P2 (with m1 and T1) for a sticking coefficient of α = 1:
 (18)
(18)
 (19)
(19)
where  is the average relative speed.
2.4 Association and dissociation of small clusters
For small cluster sizes (e.g. N ≤ 4 for TiO2) and gas densities ngas = 1012–1014 cm−3 considered in this study, termolecular associations (A + B + M → AB + M) are the dominant cluster growth reactions, and they are favoured over bimolecular radiative associations (A + B → AB + hv) (see e.g. Bromley et al. 2016). For the reverse collisional dissociation reactions (AB + M → A + B + M), we use accurate CCSD(T)/6-311+G(2d,2p) single point energies to calculate the dissociation energy EAB (erg mol−1 ). The dissociation rate is calculated as
 (20)
(20)
The dissociation rates are adjusted for thermal non-equilibrium conditions by accounting for the different relative velocities of the gas particles M and the clusters:
 (21)
(21)
We note that, in addition to the relative velocities, the clusters could have significantly cooler internal (vibrational) temperatures than the gas particles, which is not taken into account in the present study.
The corresponding three-body forward association reaction rates for TiO2 are calculated using detailed balance as described in Sect. 2.5 with cluster partition functions derived in Sindel et al. (2022). For the pre-exponential rate constant A (cm3 s−1), a value of 1.4 × 10⁻⁹ cm3 s−1 is used. This approximated value is based on an upper limit of 2 × 10⁻⁹ cm3 s−1 that is still considered to be physical (see e.g. Gobrecht et al. 2022), and it is similar to the pre-exponential factors for collisional dissociations of aluminium oxide clusters (Catoire et al. 2003). The dissociation rate coefficients for TiO2 are shown in Table A.2 and example values for the association reaction rate coefficients are shown in Table A.3. The detailed balance and equilibrium constant computations are approximated in kinetic-to-internal thermal equilibrium  .
.
2.5 Backward reaction rate
Backward reactions are considered as spontaneous processes that cause larger clusters to fragment into smaller clusters. For kinetic nucleation, a general relation can be written as A + B ⇆ C. To determine the rate coefficients  of this process, we make use of the principle of detailed balance (Milne relation; Chap. 12.2.2 of Gail & Sedlmayr 2013) which assumes that, in detailed balance (e.g. chemical equilibrium), the ratio between the forward and backward rate of each reaction is the same. Therefore, in chemical equilibrium (marked with ˚ ), the species flux of each forward reaction is equivalent to the flux of the corresponding backward reaction:
 (22)
(22)
where  ,
,  , and
, and  (cm−3) are the number densities in chemical equilibrium. Eq. (22) can be rewritten as
 (23)
(23)
To find the number densities in chemical equilibrium, the total Gibbs free energy (including translational, rotational, and vibrational contributions) in thermal non-equilibrium Gnon−eq (erg) is minimized. The setup considered here can be described by nucleating clusters immersed in an ambient gas. We assume a single non-clustering gas species and a single clustering species to simplify notation, but the derivation also holds for multiple non-clustering and clustering species. Furthermore, we assume that all clusters other than the monomer can be in thermal non-equilibrium (in the special case of thermal equilibrium, both temperatures are equal to the gas temperature:  ) and each i-mer has a kinetic temperature
  and an internal temperature of
  .
.
The Gibbs free energy of cluster4 where the internal cluster temperature  differs from the kinetic temperature
  can be written as follows:
 (24)
(24)
where  is the i-mer’s Gibbs free energy in kinetic-to-internal thermal non-equilibrium (defined as
  ), pi (dyn cm−2) is the partial pressure of the ¡-mer and Ni the number of i-mers. Furthermore,
  (erg) is the difference in Gibbs free energy of a single i-mer in thermal equilibrium to the Gibbs free energy of a cluster in kinetic-to-internal thermal non-equilibrium. Because changes in the internal temperature do not affect the i-mer’s partial pressure pi, volume, or number densities of the gas, ωi only depends on kinetic and internal temperature. Summing Eq. (24) for all clusters and gas species, the total Gibbs free energy can be written as follows:
 (25)
(25)
 (26)
(26)
where the subscript 0 describes the gas ( and Ngas = N0), the subscript i ≥ 1 represents the cluster sizes, and r denotes the largest cluster considered. Next, we need to convert the partial pressures pi to the total pressure
  (dyncm−2):
 (27)
(27)
 (28)
(28)
 (29)
(29)
where  is the total number of particles (gas and clusters). Combining Eqs. (26) and (29) as well as the definition of the chemical potential µ (G = Nµ) leads to the Gibbs free energy of the mixture of gas and clusters:
 (30)
(30)
where  (erg) is the chemical potential of the clusters and µgas(Tgas, p) (erg) the chemical potential of the gas species5. This equation describes the Gibbs free energy of a mixture of gas and clusters in thermal non-equilibrium.
To minimize the Gibbs free energy, the Lagrangian function can be used6. As an additional constraint, we assume that the number of basic building blocks (e.g. TiO2) is conserved:
 (31)
(31)
Using Eqs. (30) and (31), the Lagrangian function can be defined as
 (32)
(32)
The number of clusters Ni are realistically much smaller than the total number of gas particles, such that
 (33)
(33)
Furthermore, we assume that the differences in temperature are small enough so as to not influence this approximation:
 (34)
(34)
Taking the partial derivatives of the Lagrangian with respect to N1, Nj (for j ≥ 2) and λ and using the above approximations, we arrive at the following system of equations:
 (35)
(35)
 (36)
(36)
 (37)
(37)
 (38)
(38)
where j = {2,3,4,…, r}. Minimizing the Lagrangian function with regard to Nj is equivalent to setting Eq. (38) to 0 and this represents the state of chemical equilibrium. Setting Eq. (38) to zero leads to
 (39)
(39)
Using Eq. (39) for clusters of size A, B, and A+B allows us to write the following:
![Mathematical equation: $\matrix{ {{{\mathop {{N_{\rm{A}}}}\limits^ \circ \mathop {{N_{\rm{B}}}}\limits^ \circ } \over {{{\mathop N\limits^ \circ }_{{\rm{A + B}}}}}} = {N_{{\rm{gas}}}}\exp \left( {\sum\limits_{i \in \zeta } {{{\delta \left( i \right)} \over {kT_i^{{\rm{kin}}}}}{\mu _i}\left( {T_i^{{\rm{kin}}},p} \right)} } \right)} \hfill \cr {\,\,\,\,\,\,\,\exp \left( {\sum\limits_{i \in \zeta } {{{\delta \left( i \right)} \over {kT_i^{{\rm{kin}}}}}} \left[ {k\left( {T_i^{{\rm{kin}}} - {T_{{\rm{gas}}}}} \right) + {\omega _i}\left( {T_i^{{\rm{kin}}},T_i^{{\rm{int}}} + \lambda i} \right)} \right]} \right),} \hfill \cr } $](/articles/aa/full_html/2023/03/aa44685-22/aa44685-22-eq77.png) (40)
(40)
where ζ = {A, B, (A + υB)} defines the set of all involved cluster sizes and δ(i) is equal to 1 for products (here A + B) and −1 for the reactants (here A and B). To find the Lagrangian multiplier, we use Eq. (36) and find
 (41)
(41)
Furthermore, it is convenient to express Eq. (41) in terms of the chemical potential (µ⊖(Tgas) = µi(Tgas, p⊖)) at standard pressure (p⊖ = 106 dyncm−2). Doing this and using Eqs. (22), (40), and (41) leads to the following backward reaction rate:
![Mathematical equation: $\matrix{ {{k^ - } = {{{k^ + }{p^{{\rm{\rlap{--} O}}}}} \over {k{T_{{\rm{gas}}}}}}\exp \left( {\sum\limits_{i \in \zeta } {{{\delta \left( i \right)} \over {kT_i^{{\rm{kin}}}}}\left[ {\mu _i^{{\rm{\rlap{--} O}}}\left( {T_i^{{\rm{kin}}}} \right) - i\mu _i^{{\rm{\rlap{--} O}}}\left( {{T_{{\rm{gas}}}}} \right) + k\left( {T_i^{{\rm{kin}}} - {T_{{\rm{gas}}}}} \right)} \right.} } \right.} \cr {\left. {\left. { + {\omega _i}\left( {T_i^{{\rm{kin}}},T_i^{{\rm{kin}}}} \right)} \right]} \right){{\left( {{{k{T_{{\rm{gas}}}}{{\mathop n\limits^ \circ }_1}} \over {{p^{{\rm{\rlap{--} O}}}}}}} \right)}^{ - \sum\nolimits_{i \in \zeta } {\delta \left( i \right)i{T_{gas}}/T_i^{{\rm{kin}}}} }}.} \cr } $](/articles/aa/full_html/2023/03/aa44685-22/aa44685-22-eq79.png) (42)
(42)
3 Cooling and heating processes
Collisional and radiative heating and cooling processes impact the cluster temperature. We first look at the collisional relaxation timescale of kinetic temperature  to the gas temperature Tgas in Sect. 3.1. Afterwards, we investigate the timescale of changes in internal temperature
  via collisions in Sect. 3.2.1 and via radiative processes in Sect. 3.2.2.
3.1 Kinetic temperature
To derive the collision-induced change in cluster kinetic temperature  , we follow the derivation of Gail & Sedlmayr (2013). We assume that the energy redistribution happens through elastic and isotropic collisions between gas particles and the clusters. Considering an elastic and isotropic collision of two particles P1 (with mass m1) and P2 (with mass m2), the average ratio between the energy before and after the collision is the following (Eq. (6.6) of Gail & Sedlmayr 2013):
 (43)
(43)
Every collision decreases the energy difference by that amount. The relaxation timescale is defined as the number of collisions Kcol needed to reduce the kinetic energy of particles 1 with respect to particles 2 to 1/e of its initial value. Therefore, Kcol is (Eq. (6.9) of Gail & Sedlmayr 2013)
 (44)
(44)
where the approximation is the first term of a Taylor expansion and holds in the case of m1 ≫ m2. This approximation holds for H2 (m = 2.02 u) gas, including TiO2 clusters (m = 79.87 u). To find the kinetic cooling timescale  of elastic collisions, we multiply the number of collisions with 〈tgc〉 being the average time for a cluster (e.g. TiO2) to collide with a gas particle (e.g. H2):
 (45)
(45)
 (46)
(46)
 (47)
(47)
where the approximation is justified for mgas ≪ mN. Looking at the reference case of (TiO2)2 clusters in a gas as described in Table 1, we find a collisional cooling timescale for the (TiO2)2 kinetic temperature of  . We note that
  is inversely proportional to the gas number density ngas. Therefore, clusters residing in low-density regions (where collisions are not efficient enough to maintain thermal equilibrium) might not be in kinetic-to-gas thermal equilibrium (defined as
  ).
).
3.2 Internal temperature
3.2.1 Collisional
Internal cooling or heating of clusters via elastic collisions with gas depends on the size ratio between cluster species and gasphase molecules which is typically expressed with the Knudsen number (Woitke & Helling 2003):
 (48)
(48)
where  (cm) is the mean free path of the gas and 2rN is the diameter of the cluster (see also Table A.1).
Case 1: Kn ≫ 1
In the high Knudsen number limit, the theory of Burke & Hollenbach (1983) is used. Here, the cooling rate per unit volume ΛN (erg s−1 cm−3) of a cluster can be used to calculate the energy change for each particle per time (in the approximation mgas ≪ mN):

where  is the average accommodation coefficient. The exact value of
  depends on the colliding species, the gas composition, and the temperature, but typically it is within 0.1 to 0.9 (Burke & Hollenbach 1983). To assess the timescales in orders of magnitude, we approximate the average accommodation coefficient as
  .
.
To calculate the collisional internal cooling timescale  towards the gas temperature, we need to relate the energy change of the cooling rate with the internal temperature change of the clusters. Using Eq. (4), we find the following:
 (49)
(49)
where  is given by
 (50)
(50)
Assuming a constant gas temperature Tgas(t) = Tgas, this system can be solved and leads to the following temperature evolution for a cluster after collision:
 (51)
(51)
where  (K) is the initial internal cluster temperature. Looking at our reference case of (TiO2)2 clusters in a gas as described in Table 1, we find a collisional cooling timescale for the (TiO2)2 internal temperature of
  . The kinetic cooling timescale is within an order of magnitude of the internal cooling timescale. This is not surprising, as Eqs. (47) and (50) have the same ngas, rN, and 〈vr〉 dependencies and only differ in their prefactor. This relation stems from the nature of collisional energy transfer. Kinetic energy is exchanged via elastic collisions of particles. The more often collisions occur and the more energy can be exchanged within one collision, the faster the kinetic temperature adjusts to the equilibrium temperature. Similarly, internal energy exchange can be described via collisions of gas particles with an internal ‘spring’ (vibration mode) of the cluster (see Burke & Hollenbach 1983). Here, the timescale for thermal adjustment also depends on the collision rate and the energy amount exchange per collision.
Case 2: Kn ≪ 1
For larger clusters, the Knudsen number becomes increasingly small. In this case, we use the definition of the isobaric-specific heat and of the heat flow (Eqs. (15.19) and (17.1) of Tipler & Mosca 2015):
 (52)
(52)
 (53)
(53)
where cp (erg g−1 K−1) is the specific heat capacity for constant pressure, kc (W cm−1 K−1) is the thermal conductivity, and AN (cm2) is the cluster surface area. We assume that the energy exchange between the cluster and the gas happens over the mean free path of the gas  . The thermal conductivity kc of an ideal gas is as follows (Eqs. (10)–(25) of Sears & Salinger 1975):
 (54)
(54)
where cV (ergg−1 K−1) is the isochoric-specific heat capacity. Using Eqs. (52), (53), and (54) leads to the following solution for the internal temperature:
 (55)
(55)
 (56)
(56)
 (57)
(57)
 (58)
(58)
Summary of the quantities used for the (TiO2)2 cooling timescale examples.
3.2.2 Radiative
Radiative cooling is especially important for a cluster with large dipole moments in regions where the gas density is low and collisional cooling processes become inefficient (Woitke et al. 1996; Plane & Robertson 2022). Because of their intermediate size, small clusters are not well described as black bodies, but rather they radiate via discrete de-excitation (i.e. relaxation) of rotationally, vibrationally, and electronically excited states (Woitke et al. 2009; Coppola et al. 2011; Ferrari et al. 2019). Each cluster size i has discrete energy levels  (erg) with a ≥ 1 and the ground state is denoted with G
  . The energy levels have a number density of
  (cm−3) which follow the Boltzmann distribution at the specific temperature
  ,
,
 (59)
(59)
 (60)
(60)
where  is the total number density of the i-mer and gi, a is the degeneracy of state a of an i-mer. A relaxation from an upper level a to a lower level b of an N-mer changes the internal cluster energy
  by
by
 (61)
(61)
where Ai, ab (s−1) is the Einstein coefficient. The internal temperature change is then given as the sum over all changes in energy levels:
 (62)
(62)
The investigation of spontaneous and stimulated radiative emissions of clusters, that is to say their Einstein coefficients, is challenging. Previous studies used strong assumptions to approximate the thermal non-equilibrium caused by radiative processes (Nuth & Donn 1981; Nuth & Ferguson 2006). Recently, a more detailed investigation was done by Plane & Robertson (2022). They calculated the Einstein coefficients of the potentially dust-forming silicate OSi(OH)2 at the B3LYP/6-311+g(2d,p) level of theory assuming that harmonic vibrations and Einstein coefficients remain constant in each of the vibration modes. They found that for gas densities below 1012 cm−3 at Tgas = 1583 K, the vibrational (internal) non-equilibrium can reach as large as  . The corresponding dissociation rate is reduced by several orders of magnitude. We note, however, that clusters can show significant anharmonic vibrations and temperature dependencies which further complicate the exact descriptions of radiative emissions (Guiu et al. 2021). Owing to these complications we do not explicitly derive master equations in internal non-equilibirum, but account for its effect by adopting different internal cluster temperatures.
4 Kinetic nucleation in thermal non-equilibrium
To test our equations in thermal equilibrium, a comparison to the work of Lee et al. (2015) and Boulangier et al. (2019) is presented in Sect. 4.1. In Sect. 4.2, different temperature non-equilibria and their impact on kinetic cluster nucleation are analysed. In Sect. 4.3, we compare the effect of thermal non-equilibrium with thermal equilibrium on the cluster number densities.
4.1 Kinetic nucleation in thermal equilibrium
First we compare our model to that of Boulangier et al. (2019). Similar to their analysis, we use (TiO2)N clusters up to a size of N = 10 and evolve the chemical network for a period of t = 1 yr. Instead of number densities, they used mass densities of the total gas, which is related to the gas number densities by the mean molecular weight. Furthermore, they assumed in their closed nucleation model that all Ti is bound in TiO2. To reproduce their results, we calculated the initial TiO2 number density using the molecular weight of Ti (mTI = 47 867u ≈ 8 × 10⁻²³ g) and the Ti mass fraction (χTI = 2.84 × 10⁻⁶). We assume thermal equilibrium between the gas and all clusters ( for all cluster sizes i). Using this conversion7, we calculated the relative (TiO2)10 abundance, defined as
 (63)
(63)
after 105 seconds for a temperature range of 500 K to 3000 K and a number density range of roughly 5.08 × 103 cm−3 to 5.08 × 107 cm−3 (values taken from Boulangier et al. (2019)). Our result can be seen in the top panel of Fig. 1. Overall, our (TiO2)10 abundances match the results from Boulangier et al. (2019) which was expected because both use the same underlying assumptions and the same setup for the nucleation network.
Next, we compare our network to the nucleation model of Lee et al. (2015). In their study, the nucleation rate is calculated for homo-molecular monomer nucleation. They consider clusters of sizes up to (TiO2)10. Since our work also uses polymer nucleation, we calculate the nucleation rate by instantly dissociating8 all (TiO2)10 clusters into ten monomers (10×TiO2). This leads to a constant nucleation flux. Our results are shown in the bottom of Fig. 1. Above 600 K, our nucleation network (Eq. (1)) produces comparable nucleation rates as the non-classical nucleation rate of Lee et al. (2015). Below 600 K, they found a steep decrease in the nucleation rate which is not reproduced by our model showing a constant rate of roughly J = 1 × 10⁶ s−1 cm−1 . Comparing the results of Lee et al. (2015) with Boulangier et al. (2019) shows that both predict a lack of (TiO2)10 for homo-molecular monomer nucleation. Polymer nucleation, on the other hand (as implemented in our network and the one from Boulangier et al. 2019), showed non-negligible (TiO2)10 abundances below 1000K.
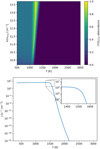 |
Fig. 1 Comparison to previous studies. Top: (TiO2)10 abundance after 1 yr with respect to the total number density of all clusters. |


4.2 Effect of thermal non-equilibrium
Thermal non-equilibrium affects the kinetic nucleation network in two ways: firstly, via the relative velocity distribution fr(vr). If the velocity distribution of the colliding cluster is a Maxwell-Boltzmann distribution, the temperature dependence is given within the TCM-reduced mass µT. In the general case, the velocity distribution can depend on the type of non-equilibrium present. For this section, we assume the velocity distribution of all clusters to be a Maxwell-Boltzmann distribution. Secondly, the backward rates (Eq. (42)) depend on the kinetic and internal temperatures of the clusters. The dependencies can be divided as follows:
 (64)
(64)
![Mathematical equation: $A = \exp \left( {\sum\limits_{i \in \zeta } {{{\delta \left( i \right)} \over {kT_i^{{\rm{kin}}}}}\left[ {\mu _i^{{\rm{\rlap{--} O}}}\left( {{T_{{\rm{gas}}}}} \right) - i\mu _1^{{\rm{\rlap{--} O}}}\left( {T_i^{{\rm{kin}}}} \right) + k\left( {T_i^{{\rm{kin}}}{ - _{{\rm{gas}}}}} \right)} \right]} } \right),$](/articles/aa/full_html/2023/03/aa44685-22/aa44685-22-eq131.png) (65)
(65)
 (66)
(66)
 (67)
(67)
where A is the correction term due to kinetic-to-gas thermal non-equilibrium, B the correction term due to kinetic-to-internal thermal non-equilibrium, and C the correction due to the Lagrangian multiplier.
The correction term C depends on the equilibrium number density of the monomer  , which in turn depends on the reaction rates. To decouple this dependency, we start by assuming C = 1. Afterwards, we calculate the maximum offset to check if this assumption holds. The correction term A only depends on the difference between kinetic temperature and gas temperature. If the clusters are in kinetic-to-gas thermal equilibrium
  , A becomes the exponent of the backward reaction rate for thermal equilibrium (as in e.g. Boulangier et al. 2019). The correction term B does not depend on the temperature of the gas phase, but rather on the thermal difference between internal and kinetic temperature. As long as N-mers are in kinetic-to-internal thermal equilibrium
  , the correction term B is equal to 1.
In this section we assume kinetic-to-internal thermal equilibrium for all clusters to study thermal non-equilibrium between gas phase and dust. This assumption is similar to the thermal non-equilibrium considered in the model of Patzer et al. 1998, Helling & Woitke (2006), and Köhn et al. 2021. Our TiO2 reference case therefore allows for the importance of thermal non-equilibrium for their models to be estimated. Studying the effect kinetic-to-internal non-equilibrium, similar to Plane & Robertson (2022), would also be interesting. Unfortunately, this requires evaluating the Gibbs free energy of clusters in kinetic-to-internal non-equilibrium which is outside of the scope of this paper and will be dealt with in a separate study.
To investigate the effect of the correction terms A, we use four different simulations. We assume kinetic-to-internal thermal equilibrium  and use two temperature structures each:
 (68)
(68)
 (69)
(69)
where ∆T is a free parameter quantifying the kinetic thermal non-equilibrium between the monomer (n = 1) and the decamer (n = 10). The definitions were chosen so that  holds in all cases. Both offsets are toy models to show the effect of different offsets on the resulting number densities.
The simulations use TiO2 as nucleating species with an initial monomer density  in a H2 gas with a density of ngas = 1012 cm−3 at Tgas = 1000 K. Clusters of size N ≤ 4 are considered to associate and disassociate via an additional collision partner M. We used temperature offsets in the range of 0 K ≤ ∆T ≤ 35 K for the exponential offset (top-left panel of Fig. 2) and 0 K ≤ ∆T ≤ 80 K for the linear offset (top-right panel of Fig. 2). The simulations show a decrease in (TiO2)10 number density with increased temperature offsets. This decrease is stronger for the exponential offset than for the linear offset. Therefore, not only does the general temperature increase, but the type of non-equilibrium also affects the resulting number densities. For Tgas = 1000 K, (TiO2)10 does not represent the most abundant cluster in all cases. As such, (TiO2)8 becomes the most abundant cluster size for exponential offsets of ∆T = 21 K and for linear offsets of ∆T = 80 K. The peaks and declines in (TiO2)10 number density for increased thermal offsets are caused by the initially efficient growth reactions due to the high abundance of small cluster and the enhanced dissociation rate, respectively. A similar overshoot can be seen in Köhn et al. 2021 who analysed different evaporation efficiencies for TiO2 nucleation.
We also considered the reverse temperature offset for both simulations. For this, we repeated the simulation with Tgas = 1250 K where, in thermal equilibrium, the (TiO2)10 number density is significantly lower than at Tgas = 1000 K. The results for exponential offsets can be seen in the bottom-left panel of Fig. 2. The results for linear offsets can be seen in the bottom-right panel of Fig. 2. In both simulations, the (TiO2)10 number density increases with decreased kinetic temperatures. Overall, we find that for TiO2 around 1000 to 1250 K lower kinetic temperatures favour nucleation and higher kinetic temperatures hamper nucleation.
To evaluate the assumption that C ≈ 1, we compare C to the uncertainty factors Fk of the reaction rates (Baulch et al. 1992; Dobrijevic & Parisot 1998). The upper and lower limit for C throughout all simulations are 0.962 < C ≤ 1.0, which corresponds to a correction factor of FC = 1.04. Typical uncertainty factors of hydrocarbon reactions at Tgas < 300 K exceed 1.5. (Dobrijevic & Parisot 1998; Dobrijevic et al. 2003; Hébrard et al. 2006). Hébrard et al. (2015) extrapolate the uncertainty factor to temperatures up to 1000 K and estimate that the uncertainty factors exceed 1.26 for bi-molecular reactions. Therefore, the assumption of C ≈ 1 is justified.
In all simulations, thermal non-equilibrium can change the (TiO2)10 number density by several orders of magnitude. The exact change in the abundance of the largest cluster depends on the gas temperature Tgas, the clustering species, the cluster number densities nN, and the type of thermal non-equilibrium present.
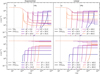 |
Fig. 2 (TiO2)N cluster number densities as a function of time under kinetic-to-gas thermal offsets |


4.3 Thermal equilibrium versus non-equilibrium
In Sect. 4.2, we have shown that positive cluster temperature offsets can lead to lower (TiO2)10 number densities and negative cluster temperature offsets can lead to higher (TiO2)10 number densities. Since this behaviour is also expected for thermal equilibrium, we compare the change in (TiO2)10 number density for thermal equilibrium to thermal non-equilibrium. We choose an H2 gas with a density of ngas = 1012 cm−3, an initial TiO2 monomer density  , and assume exponential temperature offsets (see Eq. (68)).
The first simulation is done in thermal non-equilibrium using a gas temperature of Tgas = 1000 K and a temperature offset9 of ∆T = 35 K for the clusters (see Sect. 4.2). The second simulation is done assuming thermal equilibrium (∆T = 0 K) at  = 1035 K. The results can be seen in Fig. 3.
Even though the (TiO2)10 clusters are at the same temperature, the (TiO2)10 number densities are 4 orders of magnitude smaller if thermal non-equilibrium is present. We tested additional gas temperatures assuming thermal equilibrium and found that to reach a similar (TiO2)10 number density as in the thermal non-equilibrium case, the gas temperature has to be around 
5 Conclusion
We developed a kinetic nucleation model describing cluster formation and destruction in thermal non-equilibrium using non-identical temperatures for the clusters and the gas. This model does not rely on assumptions made by previous studies of thermal non-equilibrium nucleation frameworks. Our model includes realistic termolecular association and collisional dissociations for the smallest cluster sizes. To derive a dissociation rate in thermal non-equilibrium, we make use of the law of mass action, the principle of detailed balance, and the minimization of the Gibbs free energy in a general form accounting for non-equilibrium effects. All particles, which are not part of the nucleation process, are assumed to be in thermal equilibrium at the temperature Tgas . Clusters are described by a kinetic (transitional) temperature  and an internal temperature
  . All temperatures can differ from each other.
Thermal non-equilibrium can affect the synthesis of larger TiO2 clusters. Lower cluster temperatures lead to an increased abundance of larger clusters. This relation was already predicted by previous studies and our simulations confirm and quantify the impact of thermal non-equilibrium on cluster formation. For TiO2 at  in a H2 gas at
  and Tgas = 1000 K, we found that the number density of (TiO2)10 can decrease over an order of magnitude for kinetic-to-gas temperature offsets with
  . For a higher gas temperature of Tgas = 1250 K, we found over an order of magnitude increase in the (TiO2)10 number density for kinetic-to-gas temperature offsets of
  .
.
In environments where thermal non-equilibrium is already observed or suspected, such as the outflows of AGB stars, it is crucial to consider the effect of thermal non-equilibrium on kinetic nucleation. Already small temperature offsets within clustering species can cause significant changes in the abundance of larger clusters. The model derived in this work can be used to add thermal non-equilibrium considerations to chemical (kinetic) networks.
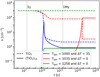 |
Fig. 3 Comparison of TiO2 and (TiO2)10 number densities under thermal equilibrium (∆T = 0 K) and kinetic-to-gas thermal non-equilibrium (∆T ≠ 0 K) conditions. |
Acknowledgements
The authors thank Julian Lang for his contribution and help to this work. S.K., L.D and C.H. acknowledge funding from the European Union H2020-MSCA-ITN-2019 under grant agreement no. 860470 (CHAMELEON). L.D. and D.G. acknowledge support from the ERC consolidator grant 646758 AEROSOL. D.G. acknowledges support from the project grant “The Origin and Fate of Dust in the Universe” from the Knut and Alice Wallenberg foundation.
Appendix A Cluster data
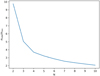 |
Fig. A.1 Ratio of the Van der Waals (VdW) and the geometrical (Geo) cross section for different cluster sizes. |
In this section we present the TiO2 data used throughout the paper.
Cluster radius
The radius of small TiO2 clusters cannot be calculated in a straightforward manner, owing to the diverse and non-identical cluster shapes (i.e. geometries). However, a cluster volume can be derived by using either the coordinates of the atomic cores (i.e. purely geometrical), or by including Van der Waals volumes accounting for the presence of electrons. Assuming sphericity, a cluster radius can be deduced. Both sets of values are shown in Table A.1. The difference between these two on the resulting cross section can be seen in Fig. A.1. For the calculations in Section 3 and 4, we used the radius calculated using Van der Waals forces. Readers can also refer to Köhn et al. 2021 for an additional discussion on cluster radii.
Gibbs free energy
The Gibbs free energies of formation of the TiO2 clusters were taken from Sindel et al. (2022).
Reaction energy
The reaction energy Ereac of the TiO2 dimerisation (i.e. TiO2+TiO2 → (TiO2)2) was calculated with density functional theory using the software package Gaussian16 (Frisch et al. 2016). The calculations were performed at the B3LYP/cc-pVTZ level of theory (Becke 1993) including the vibrational zero-point correction:
 (A.1)
(A.1)
Dissociation reactions
All collisional dissociation reactions for TiO2 considered in Section 4.2 are listed in Table A.2. The termoelcular association rates are calculated using the dissociation rate and detailed balance as described in Section 2.4. The thermal non-equilibrium correction factor qi is defined as follows:
 (A.2)
(A.2)
Example values for the reaction rate coefficients of three-body association reactions of TiO2 are shown in Table A.3.
Cluster data for (TiO2)N clusters, including: geometrical (Geo) radius, Van-der-Waals (VdW) radius, and mass.
Collisional dissociation reactions of TiO2 for cluster sizes N ≤ 4 including thermal non-equilibrium effects.
References
- Ackerman, A.S., & Marley, M.S. 2001, ApJ, 556, 872 [NASA ADS] [CrossRef] [Google Scholar]
- Allard, F., Hauschildt, P.H., Alexander, D.R., Tamanai, A., & Schweitzer, A. 2001, ApJ, 556, 357 [NASA ADS] [CrossRef] [Google Scholar]
- Allard, F., Guillot, T., Ludwig, H.-G., et al. 2003, Proc. IAUS, 211, 325 [NASA ADS] [Google Scholar]
- Ball, J.M., & Carr, J. 1990, J. Stat. Phys., 61, 203 [CrossRef] [Google Scholar]
- Baulch, D.L., Cobos, C.J., Cox, R.A., et al. 1992, JPCRD, 21, 411 [NASA ADS] [Google Scholar]
- Bean, J.L., Miller-Ricci Kempton, E., & Homeier, D. 2010, Nature, 468, 669 [NASA ADS] [CrossRef] [Google Scholar]
- Becke, A.D. 1993, J. Chem. Phys., 98, 5648 [NASA ADS] [CrossRef] [Google Scholar]
- Becker, R., & Döring, W. 1935, Ann. Physik, 416, 719 [NASA ADS] [CrossRef] [Google Scholar]
- Boulangier, J., Gobrecht, D., Decin, L., de Koter, A., & Yates, J. 2019, MNRAS, 489, 4890 [CrossRef] [Google Scholar]
- Bromley, S.T., Martín, J.C.G., & C. Plane, 2016, PCCP, 18, 26913 [NASA ADS] [CrossRef] [Google Scholar]
- Bromley, S.T., & Zwijnenburg, M.A. 2016, Computational Modeling of Inorganic Nanomaterials (CRC Press) [CrossRef] [Google Scholar]
- Burke, J.R., & Hollenbach, D.J. 1983, ApJ, 265, 223 [NASA ADS] [CrossRef] [Google Scholar]
- Burton, J.J. 1977, in Nucleation Theory, eds. B.J. Berne, Statistical Mechanics. Modern Theoretical Chemistry, 5 (Boston: Springer) [Google Scholar]
- Carr, J. 1992, Proc. Roy. Soc. Edinb. A: Math., 121, 231 [CrossRef] [Google Scholar]
- Carr, J., & da Costa, F.P. 1994, J. Stat. Phys., 77, 89 [NASA ADS] [CrossRef] [Google Scholar]
- Catoire, L., Legendre, J.-F., & Giraud, M. 2003, J. Propuls. Power, 19, 196 [CrossRef] [Google Scholar]
- Coppola, C.M., Lodi, L., & Tennyson, J. 2011, MNRAS, 415, 487 [NASA ADS] [CrossRef] [Google Scholar]
- Crossfield, I.J.M., Barman, T., Hansen, B.M.S., & Howard, A.W. 2013, A&A, 559, A33 [NASA ADS] [CrossRef] [EDP Sciences] [Google Scholar]
- Dobrijevic, M., & Parisot, J.P. 1998, P&SS, 46, 491 [NASA ADS] [CrossRef] [Google Scholar]
- Dobrijevic, M., Ollivier, J.L., Billebaud, F., Brillet, J., & Parisot, J.P. 2003, A&A, 398, 335 [NASA ADS] [CrossRef] [EDP Sciences] [Google Scholar]
- Donn, B., & Nuth, J.A. 1985, ApJ, 288, 187 [NASA ADS] [CrossRef] [Google Scholar]
- Doye, J.P.K., & Wales, D.J. 1996, J. Chem. Phys., 105, 8428 [NASA ADS] [CrossRef] [Google Scholar]
- Draine, B.T., & Salpeter, E.E. 1977, J. Chem. Phys., 67, 2230 [NASA ADS] [CrossRef] [Google Scholar]
- Ferrari, P., Janssens, E., Lievens, P., & Hansen, K. 2019, Int. Rev. Phys. Chem., 38, 405 [Google Scholar]
- Ferrarotti, A.S., & Gail, H.-P. 2002, A&A, 382, 256 [NASA ADS] [CrossRef] [EDP Sciences] [Google Scholar]
- Ferrarotti, A.S., & Gail, H.-P. 2006, A&A, 447, 553 [CrossRef] [EDP Sciences] [Google Scholar]
- Fonfría, J.P., Cernicharo, J., Richter, M.J., & Lacy, J.H. 2008, ApJ, 673, 445 [CrossRef] [Google Scholar]
- Fonfría, J.P., Hinkle, K.H., Cernicharo, J., et al. 2017, ApJ, 835, 196 [CrossRef] [Google Scholar]
- Fonfría, J.P., Montiel, E.J., Cernicharo, J., et al. 2021, A&A, 651, A8 [NASA ADS] [CrossRef] [EDP Sciences] [Google Scholar]
- Frisch, M.J., Trucks, G.W., Schlegel, H.B., et al. 2016, Gaussian~16 Revision C.01 [Google Scholar]
- Gail, H.-P. 2010, in Astromineralogy, ed. T. Henning, Lecture Notes in Physics (Berlin, Heidelberg: Springer), 61 [NASA ADS] [CrossRef] [Google Scholar]
- Gail, H.-P., & Sedlmayr, E. 1998, Faraday Discuss., 109, 303 [NASA ADS] [CrossRef] [Google Scholar]
- Gail, H.-P., & Sedlmayr, E. 1999, A&A, 347, 594 [Google Scholar]
- Gail, H.-P., & Sedlmayr, E. 2013, Physics and Chemistry of Circumstellar Dust Shells [CrossRef] [Google Scholar]
- Gail, H.-P., Keller, R., & Sedlmayr, E. 1984, A&A, 133, 320 [NASA ADS] [Google Scholar]
- Girshick, S.L., & Chiu, C. 1990, J. Chem. Phys., 93, 1273 [NASA ADS] [CrossRef] [Google Scholar]
- Gobrecht, D., Cherchneff, I., Sarangi, A., Plane, J.M.C., & Bromley, S.T. 2016, A&A, 585, A6 [NASA ADS] [CrossRef] [EDP Sciences] [Google Scholar]
- Gobrecht, D., Plane, J.M.C., Bromley, S.T., et al. 2022, A&A, 658, A167 [NASA ADS] [CrossRef] [EDP Sciences] [Google Scholar]
- Goeres, A. 1996, Proceedings of the ASP Conference Series, Hydrogen Deficient Stars, eds. C.S. Jeffery, & U. Heber, 96, 69 [NASA ADS] [Google Scholar]
- Goumans, T.P.M., & Bromley, S.T. 2013, Phil. Trans. R. Soc. A, 371, 20110580 [CrossRef] [Google Scholar]
- Guiu, J.M., Escatllar, A.M., & Bromley, S.T. 2021, ACS Earth Space Chem., 5, 812 [NASA ADS] [CrossRef] [Google Scholar]
- Gupta, A., & Sahijpal, S. 2020, MNRAS, 492, 2058 [NASA ADS] [CrossRef] [Google Scholar]
- Hébrard, E., Dobrijevic, M., Bénilan, Y., & Raulin, F. 2006, J. Photochem. Photobiol, 7, 211 [CrossRef] [Google Scholar]
- Hébrard, E., Tomlin, A.S., Bounaceur, R., & Battin-Leclerc, F. 2015, Proc. Combust. Inst., 35, 607 [CrossRef] [Google Scholar]
- Helling, C., & Fomins, A. 2013, Phil. Trans. R. Soc. A, 371, 20110581 [CrossRef] [Google Scholar]
- Helling, C., & Woitke, P. 2006, A&A, 455, 325 [NASA ADS] [CrossRef] [EDP Sciences] [Google Scholar]
- Helling, C., Woitke, P., & Thi, W.-F. 2008, A&A, 485, 547 [NASA ADS] [CrossRef] [EDP Sciences] [Google Scholar]
- Höfner, S. 2009, Proceedings of the ASP Conference Series, Cosmic Dust - Near and Far, eds Th. Henning, E. Gruen, & J. Steinacker, 414, 3 [Google Scholar]
- Kalikmanov, V.I., & van Dongen, M.E.H. 1993, Phys. Rev. E, 47, 3532 [NASA ADS] [CrossRef] [Google Scholar]
- Karovicova, I., Wittkowski, M., Ohnaka, K., et al. 2013, A&A, 560, A75 [NASA ADS] [CrossRef] [EDP Sciences] [Google Scholar]
- Köhn, C., Helling, C., Enghoff, M.B., et al. 2021, A&A, 654, A120 [NASA ADS] [CrossRef] [EDP Sciences] [Google Scholar]
- Knutson, H.A., Dragomir, D., Kreidberg, L., et al. 2014, ApJ, 794, 155 [NASA ADS] [CrossRef] [Google Scholar]
- Kreidberg, L., Bean, J.L., Désert, J.-M., et al. 2014, Nature, 505, 69 [NASA ADS] [CrossRef] [Google Scholar]
- Kusakabe, M., Kajino, T., Mathews, G.J., & Luo, Y. 2019, Phys. Rev. D, 99, 043505 [NASA ADS] [CrossRef] [Google Scholar]
- Lazzati, D. 2008, MNRAS, 384, 165 [NASA ADS] [CrossRef] [Google Scholar]
- Lee, E.K.H., Helling, C., Giles, H., & Bromley, S.T. 2015, A&A, 575, A11 [NASA ADS] [CrossRef] [EDP Sciences] [Google Scholar]
- Lee, E.K.H., Blecic, J., & Helling, C. 2018, A&A, 614, A126 [NASA ADS] [CrossRef] [EDP Sciences] [Google Scholar]
- Lieshout, R.V., Min, M., & Dominik, C. 2014, A&A, 572, A76 [NASA ADS] [CrossRef] [EDP Sciences] [Google Scholar]
- Matsuura, M., Barlow, M.J., Zijlstra, A.A., et al. 2009, MNRAS, 396, 918 [NASA ADS] [CrossRef] [Google Scholar]
- Nuth, J.A., & Donn, B. 1981, ApJ, 247, 925 [NASA ADS] [CrossRef] [Google Scholar]
- Nuth, J.A., & Ferguson, F.T. 2006, ApJ, 649, 1178 [NASA ADS] [CrossRef] [Google Scholar]
- Nuth, J.A., Allen, J.E., Jr., & Wiant, M. 1985, ApJ, 293, 463 [NASA ADS] [CrossRef] [Google Scholar]
- Patzer, A.B.C., Gauger, A., & Sedlmayr, E. 1998, A&A, 337, 847 [NASA ADS] [Google Scholar]
- Penrose, O. & Lebowitz, J.L. 1979, in Fluctuation Phenomena, ed. E.W. Montroll & J.L. Lebowitz (Elsevier), 293 [CrossRef] [Google Scholar]
- Peters, B. 2017, in Reaction Rate Theory and Rare Events Simulations, ed. B. Peters (Amsterdam: Elsevier), 147 [CrossRef] [Google Scholar]
- Plane, J.M.C. 2013, Philos. Trans. Roy. Soc. A , 371, 20120335 [CrossRef] [Google Scholar]
- Plane, J.M.C., & Robertson, S. 2022, Faraday Discuss., 238, 461 [NASA ADS] [CrossRef] [Google Scholar]
- Pont, F., Knutson, H., Gilliland, R.L., Moutou, C., & Charbonneau, D. 2008, MNRAS, 385, 109 [CrossRef] [Google Scholar]
- Pont, F., Sing, D.K., Gibson, N.P., et al. 2013, MNRAS, 432, 2917 [NASA ADS] [CrossRef] [Google Scholar]
- Sears, F.W., & Salinger, G.L. 1975, Thermodynamics, Kinetic Theory, and Statistical Thermodynamics, 3rd edn [Google Scholar]
- Sedlmayr, E., & Krüger, D. 1997, AIP Conf. Proc., 402, 425 [NASA ADS] [Google Scholar]
- Sindel, J.P., Gobrecht, D., Helling, C., & Decin, L. 2022, A&A, 668, A35 [NASA ADS] [CrossRef] [EDP Sciences] [Google Scholar]
- Sing, D.K., Wakeford, H.R., Showman, A.P., et al. 2015, MNRAS, 446, 2428 [NASA ADS] [CrossRef] [Google Scholar]
- Sing, D.K., Fortney, J.J., Nikolov, N., et al. 2016, Nature, 529, 59 [NASA ADS] [CrossRef] [Google Scholar]
- Tielens, A. 2022, Front. Astron. Space Sci., 9 [Google Scholar]
- Tipler, P.A., & Mosca, G. 2015, Physik für Wissenschaftler und Ingenieure, 7. Auflage, eds. P.A. Tipler, & G. Mosca [CrossRef] [Google Scholar]
- Tsuji, T. 2002, ApJ, 575, 264 [NASA ADS] [CrossRef] [Google Scholar]
- Tsuji, T. 2005, Apj, 621, 1033 [NASA ADS] [CrossRef] [Google Scholar]
- Tsuji, T., Ohnaka, K., Aoki, W., & Nakajima, T. 1996, A&A, 308, L29 [NASA ADS] [Google Scholar]
- Ventura, P., Dell’Agli, F., Lugaro, M., et al. 2020, A&A, 641, A103 [NASA ADS] [CrossRef] [EDP Sciences] [Google Scholar]
- Waters, L.B.F.M., Molster, F.J., de Jong, T., et al. 1996, A&A, 315, L361 [NASA ADS] [Google Scholar]
- Williams, P.M., van der Hucht, K.A., & The, P.S. 1987, A&A, 182, 91 [NASA ADS] [Google Scholar]
- Winters, J.M., Fleischer, A.J., Gauger, A., & Sedlmayr, E. 1994, A&A, 290, 623 [NASA ADS] [Google Scholar]
- Winters, J.M., Fleischer, A.J., Gauger, A., & Sedlmayr, E. 1995, A&A, 302, 483 [NASA ADS] [Google Scholar]
- Woitke, P., & Helling, C. 2003, A&A, 399, 297 [NASA ADS] [CrossRef] [EDP Sciences] [Google Scholar]
- Woitke, P., Goeres, A., & Sedlmayr, E. 1996, A&A, 313, 217 [NASA ADS] [Google Scholar]
- Woitke, P., Sedlmayr, E., & Lopez, B. 2000, A&A, 358, 665 [NASA ADS] [Google Scholar]
- Woitke, P., Kamp, I., & Thi, W.-F. 2009, A&A, 501, 383 [NASA ADS] [CrossRef] [EDP Sciences] [Google Scholar]
In the case of kinetic chemistry, the cross section is a statistical property. Therefore, for non-spherical particles, the cross section σ has to be found by averaging the angle-dependent cross section σ(ϕ, θ) over the azimuthal angles ϕ and polar angles θ.
A comparison of van der Waals radii to geometric radii for TiO2 can be found in Appendix A or in Köhn et al. 2021.
The relative speed distribution can be found by convolution of the velocity distributions of the collision partners: fr(νr) = ∫dν1 ∫dν2f(ν1)f(ν2) δ(|νr| − |ν1 − ν2|), where δ is the Dirac delta function.
We assume that each metastable cluster structure quickly relaxes to their global minimum after formation. Therefore, we can use the Gibbs free energies of the global minimum. For a detailed analysis of relaxation timescales of the potential energy surface, the reader is referred to Doye& Wales (1996).
In the literature usually the molar Gibbs free energy Gmol is given, which is related to the chemical potential µ through the Avogadro constant NA, such that NAµ = Gmol.
The Lagrangian function is a tool for mathematical optimization problems in which equality constrains can be expressed using the Lagrangian multiplier λ.
The conversion is given by  .
.
This process is also known as a Maxwell-Demon.
∆T = 35 K was chosen because it showed a clear impact on the (TiO2 )10 number density.
All Tables
Cluster data for (TiO2)N clusters, including: geometrical (Geo) radius, Van-der-Waals (VdW) radius, and mass.
Collisional dissociation reactions of TiO2 for cluster sizes N ≤ 4 including thermal non-equilibrium effects.
All Figures
|
Fig. 1 Comparison to previous studies. Top: (TiO2)10 abundance after 1 yr with respect to the total number density of all clusters. |
| In the text | |
|
Fig. 2 (TiO2)N cluster number densities as a function of time under kinetic-to-gas thermal offsets |
| In the text | |
|
Fig. 3 Comparison of TiO2 and (TiO2)10 number densities under thermal equilibrium (∆T = 0 K) and kinetic-to-gas thermal non-equilibrium (∆T ≠ 0 K) conditions. |
| In the text | |
|
Fig. A.1 Ratio of the Van der Waals (VdW) and the geometrical (Geo) cross section for different cluster sizes. |
| In the text | |
Current usage metrics show cumulative count of Article Views (full-text article views including HTML views, PDF and ePub downloads, according to the available data) and Abstracts Views on Vision4Press platform.
Data correspond to usage on the plateform after 2015. The current usage metrics is available 48-96 hours after online publication and is updated daily on week days.
Initial download of the metrics may take a while.