Fig. 1
Download original image
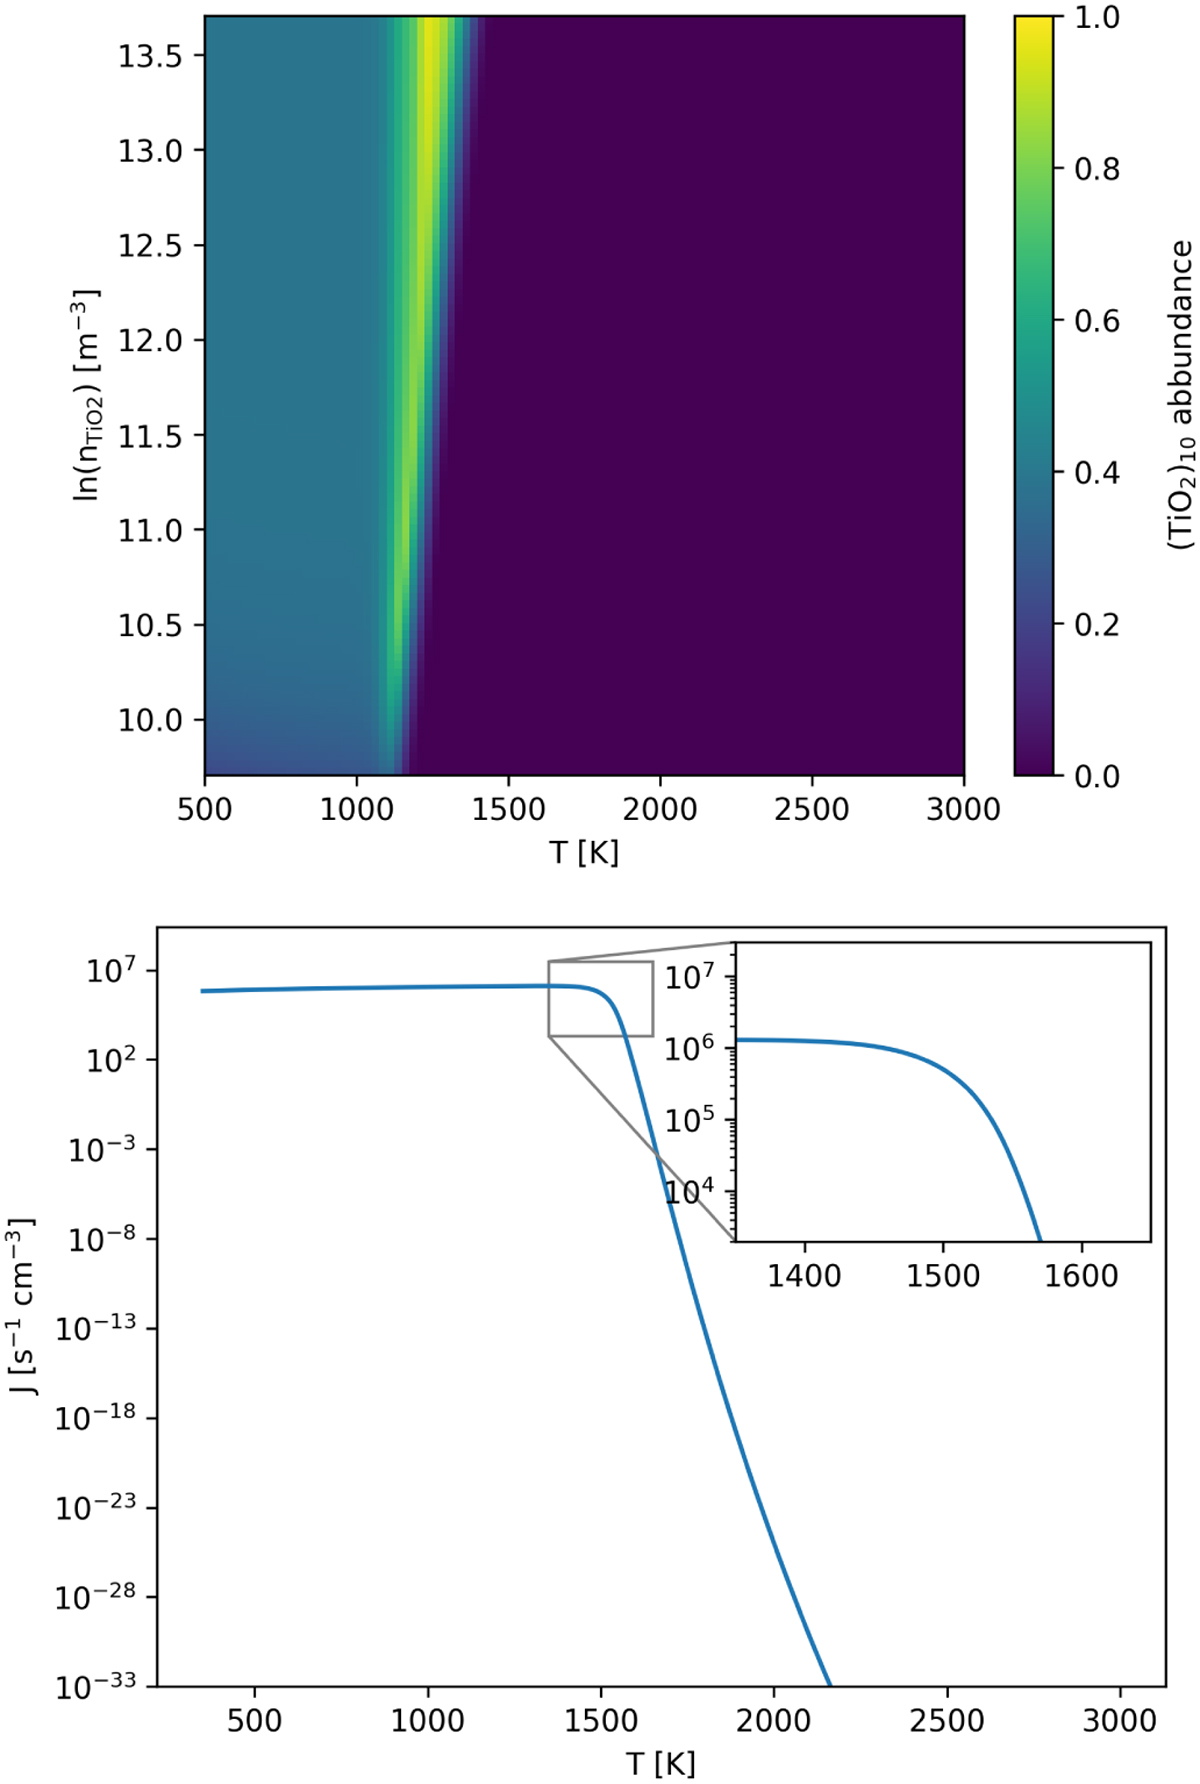
Comparison to previous studies. Top: (TiO2)10 abundance after 1 yr with respect to the total number density of all clusters. ![]() . This graph was made to be compared with the results of Boulangier et al. (2019). Bottom: nucleation rate of TiO2. The simulation was conducted for an initial uniform cluster number density of
. This graph was made to be compared with the results of Boulangier et al. (2019). Bottom: nucleation rate of TiO2. The simulation was conducted for an initial uniform cluster number density of ![]() = 109 cm-3 and evaluated after t = 105 s. This graph was made to be compared with the results of Lee et al. (2015).
= 109 cm-3 and evaluated after t = 105 s. This graph was made to be compared with the results of Lee et al. (2015).
Current usage metrics show cumulative count of Article Views (full-text article views including HTML views, PDF and ePub downloads, according to the available data) and Abstracts Views on Vision4Press platform.
Data correspond to usage on the plateform after 2015. The current usage metrics is available 48-96 hours after online publication and is updated daily on week days.
Initial download of the metrics may take a while.