| Issue |
A&A
Volume 658, February 2022
|
|
|---|---|---|
| Article Number | A159 | |
| Number of page(s) | 11 | |
| Section | Cosmology (including clusters of galaxies) | |
| DOI | https://doi.org/10.1051/0004-6361/202142213 | |
| Published online | 16 February 2022 | |
Accretion processes in the galaxy cluster Hydra A/Abell 780⋆
1
Dipartimento di Fisica dell’Università degli Studi di Trieste – Sezione di Astronomia, Via Tiepolo 11, 34143 Trieste, Italy
2
INAF – Osservatorio Astronomico di Trieste, Via Tiepolo 11, 34143 Trieste, Italy
e-mail: marisa.girardi@inaf.it
3
Fundación Galileo Galilei – INAF (Telescopio Nazionale Galileo), Rambla José Ana Fernández Perez 7, 38712 Breña Baja (La Palma), Canary Islands, Spain
4
Instituto de Astrofísica de Canarias, C/Vía Láctea s/n, 38205 La Laguna (Tenerife), Canary Islands, Spain
5
Departamento de Astrofísica, Univ. de La Laguna, Av. del Astrofísico Francisco Sánchez s/n, 38205 La Laguna, Tenerife, Spain
6
INAF – Osservatorio Astronomico di Brera, Via E. Bianchi 46, 23807 Merate, Italy
Received:
13
September
2021
Accepted:
8
December
2021
Context. Clusters of galaxies evolve and accrete mass, mostly from small galaxy systems.
Aims. Our aim is to study the velocity field of the galaxy cluster Abell 780, which is known for the powerful radio source Hydra A at its center and where a spectacular X-ray tail associated with the galaxy LEDA 87445 has been discovered.
Methods. Our analysis is based on the new spectroscopic data for hundreds of galaxies obtained with the Italian Telescopio Nazionale Galileo and the Very Large Telescope. We have constructed a redshift catalog of 623 galaxies and selected a sample of 126 cluster members. We analyzed the internal structure of the cluster using a number of techniques.
Results. We estimate the mean redshift z = 0.0545, the line-of-sight velocity dispersion σV ∼ 800 km s−1, and the dynamical mass M200 ∼ 5.4 × 10¹⁴ M⊙. The global properties of Abell 780 are typical of relaxed clusters. On a smaller scale, we can detect the presence of a galaxy group associated with LEDA 87445 in projected phase space. The mean velocity and position of the center of the group agree well with the velocity and position of LEDA 87445. We estimate the following parameters of the collision. The group is characterized by a higher velocity relative to the main system. It is infalling at a rest frame velocity of Vrf ∼ +870 km s−1 and lies at a projected distance of D ∼ 1.1 Mpc to the south, slightly southeast of the cluster center. The mass ratio of the group to the cluster is ∼1:5. We also find evidence of an asymmetry in the velocity distribution of galaxies in the inner cluster region, which might be related to a small low-velocity group detected as a substructure at Vrf ∼ −750 km s−1.
Conclusions. We conclude that A780, although dynamically relaxed at first sight, contains small substructures that may have some impact on the energetics of the core region.
Key words: galaxies: clusters: individual: Abell 780 / galaxies: clusters: general / galaxies: kinematics and dynamics / galaxies: clusters: individual: Hydra A
Full Table 1 is only available at the CDS via anonymous ftp to cdsarc.u-strasbg.fr (130.79.128.5) or via http://cdsarc.u-strasbg.fr/viz-bin/cat/J/A+A/658/A159
© ESO 2022
1. Introduction
It is well known that galaxy clusters are not simple relaxed systems, but that they evolve and increase in mass through a hierarchical merging process from poor groups to rich clusters. Large mergers involving two galaxy systems of comparable mass are the most energetic events in the Universe since the Big Bang. However, as numerical simulations show, accretion of smaller systems at the galaxy or group scale is the main channel of cluster growth (e.g., Berrier et al. 2009; McGee et al. 2009; Benavides et al. 2020). Observational evidence for cluster accretion in the past comes from the presence of cluster substructures detected in the distributions of member galaxies, gas, and mass as determined by optical, X-ray, and gravitational lensing data (Feretti et al. 2002; Molnar 2015 for reviews). Detecting and studying the accretion of small galaxy systems is more difficult than that of mergers of the same size. This requires the use of several hundred redshifts per cluster and/or the isophotes of X-ray brightness residuals (e.g., Adami et al. 2005 in Coma cluster; Girardi et al. 2015 for the CLASH-VLT survey; Lisker et al. 2018 in Virgo cluster).
The detection of accreted small groups, and in particular their member galaxies, is a fundamental step in understanding the effects of the cluster environment on galaxies. One of the key issues is to understand the dichotomy of galaxy types between the cluster and the field environment, both in terms of the mechanism that stalls star formation in galaxies (e.g., Peng et al. 2015) and whether this is related to the environment of the cluster (e.g., Treu et al. 2003) or to the earlier preprocessing in groups (e.g., Vijayaraghavan & Ricker 2013).
Observations of X-ray bright head-tail downstreams are generally interpreted as direct evidence for the ongoing process of cluster accretion, in which the gaseous component of the infalling galaxies (or galaxy groups) is stripped by the intracluster medium (ICM). The observation of these features is quite rare, probably due to the high quality of the X-ray data required. Concrete examples are M 86 in Virgo (Forman et al. 1979), NGC 1404 in Fornax (Jones et al. 1997), A2142 (Eckert et al. 2014), Hydra A (De Grandi et al. 2016), and Abell 85 (Ichinohe et al. 2015). In practice, these X-ray bright tail streams could serve as reliable signposts for infalling galaxies or groups into the cluster environment.
De Grandi et al. (2016) report the discovery of a structure with a spectacular bright X-ray tail in the outskirts of the Abell 780 cluster (hereafter A780) using deep wide-field observations with XMM-Newton and Suzaku. They suggest that this feature is related to an accreting galaxy group that is clustered around the bright galaxy LEDA 87445, ∼17′ (1.1 Mpc) south of the cluster center, with a wake of stripped gas extending behind the group over a projected scale of 760 kpc. The temperature of the gas along the wake is constant at kTX ∼ 1.3 keV, which is about a factor of two below the temperature of the surrounding ICM.
A780 is a modest cluster, characterized by low richness (Abell richness class R = 0, Abell et al. 1989), X-ray luminosity (LX, bol ∼ 2 × 1044 erg s−1, Zhang et al. 2011), and temperature (kTX ∼ 3 − 3.5 keV, Sato et al. 2012; De Grandi et al. 2016). These X-ray values are typical for small clusters as shown by the relation LX − TX (see Fig. 13 in Osmond & Ponman 2004).
The A780 cluster shows typical properties of a dynamically relaxed galaxy system. Chandra and XMM-Newton observations indicate the presence of a cool core (McNamara et al. 2000; see also Fig. 2 in Simionescu et al. 2008). XMM-Newton observations show that the X-ray morphology of A780 is smooth within 1 Mpc (see, e.g., Fig. 1 in De Grandi et al. 2016). As for the galaxy component, no difference in the luminosity function of galaxies was detected in different regions within 500 kpc (Durret et al. 2009).
Instead, A780 shows many small-scale substructures related to the AGN-ICM interaction in the center of the cluster. In fact, A780 is better known for the powerful radio source, Hydra A (3C 218), emanating from its central brightest galaxy (Matthews et al. 1964). The radio source has a complex morphology that extends nearly ∼8′ (500 kpc) in the north–south direction, slightly NNE-SSW (Lane et al. 2004), while active jets have been detected in the central ∼50 kpc region (Taylor et al. 1990). Chandra X-ray observations have revealed a multicavity system, a large-scale shock, an X-ray bright filament near the cluster center, and a spiral like structure in the ICM (McNamara et al. 2000; Nulsen et al. 2005; Wise et al. 2007; Laganá et al. 2010). According to general consensus, the giant radio lobes triggered by AGN jets interact with the surrounding ICM and regulate the cooling flow in Hydra A.
There are few spectroscopic data in the literature for galaxies in the field of A780. Durret et al. (2009) analyzed the region of 5 deg radius (∼19 Mpc) around the center of the cluster using galaxies with available redshift in the NASA/IPAC Extragalactic Database (NED). No obvious large-scale structure was found within 5 Mpc of the cluster, and the cluster is likely detected as a bound structure of 14 galaxies. To date, the only homogeneous, one-source redshift catalog is that of Smith et al. (2004), who list data for 41 galaxies and one star as part of their wide-field imaging/spectroscopic study of 93 clusters (NOAO Fundamental Plane Survey). We previously analyzed these data and extracted a subset of 33 fiducial member galaxies (De Grandi et al. 2016, see Appendix A). In that work we presented the first evidence of a substructure in the galaxy distribution around LEDA 87445, but more data are needed to determine the kinematic and dynamical properties of the group and the parameters of the collision.
In this context we carried out an intensive observational campaign to obtain new spectroscopic data with both the Italian Telescopio Nazionale Galileo (TNG) and the Very Large Telescope (VLT). This paper is devoted to the presentation of our results on the velocity field of A780. The paper is organized as follows. We describe the optical observations and present our spectroscopic data catalog in Sects. 2 and 3. We select the members of the cluster, estimate the global properties, and analyze the substructure in Sects. 4 and 5. Section 6 is devoted to the interpretation and discussion of our results. In Sect. 7 we give a brief summary and derive our conclusions. In this work we use H0 = 70 km s−1 Mpc−1 in a flat cosmology with Ω0 = 0.3 and ΩΛ = 0.7. In the assumed cosmology, 1′ corresponds to ∼63.5 kpc at the cluster redshift. We recall that the velocities we derive for the galaxies are line-of-sight velocities determined from the redshift, V = cz. Unless otherwise stated, we report errors with a confidence level (c.l.) of 68%.
2. New spectroscopic data
Multi-object spectroscopic observations of A780 were performed at the TNG in February 2016 (program AOT32-TAC25, PI: M. Girardi). We used the instrument DOLoRes in MOS mode with the LR-B Grism1. In total, we observed five MOS masks for a total of 194 slits. The total exposure time was 3600 s for each of the five masks.
Spectral reduction and redshift estimation were performed using standard IRAF2 tasks and the cross-correlation technique (Tonry & Davis 1979). The line-of-sight velocity errors are a result of the cross-correlation technique. In 43 cases the redshift was estimated by measuring the wavelength position of emission lines in the spectra. Our spectroscopic catalog contains 165 galaxies. For five galaxies there are double redshift determinations measured in different masks.
We checked the consistency of redshift measurements in different masks using the following procedure (see, e.g., Barrena et al. 2007; hereafter the FIT-ZZ procedure). For the five galaxies with double redshift determination, we fitted the first measurement against the second by using a straight line and accounting for errors in both coordinates (Press et al. 1992). The fitted line agrees with the one-to-one relation, but the value of the χ2-probability indicates that the errors are too small to explain the observed scatter. Only when the nominal errors of the redshifts are multiplied by a factor of two can the observed scatter be justified. We corrected the error estimates accordingly. For the galaxies with two redshift measurements, we combined the two redshift determinations using weighted averages and errors. Our final spectroscopic TNG catalog lists 160 galaxies brighter than r = 21 mag, most brighter than r = 20 mag. The median value of the cz errors is 98 km s−1.
Multi-object spectroscopic observations of Hydra A were performed at the VLT in January, February, and March 2017 (Program 098.A-0807(A), P.I.: M. Girardi). We used the instrument VIMOS in MOS mode with the LR-blue grism. In total, we observed three MOS mask pointings for a total of 1407 slitlets. The total exposure time was six hours, distributed over three pointings. Spectral reduction and calculation of radial velocities were performed using IRAF as described above. We succeeded in obtaining a reliable determination of the redshift for 478 galaxies. The success rate of 30% was mainly due to the poor weather conditions. We obtained duplicate determinations for 20 galaxies measured in different masks, and we followed the FIT-ZZ procedure described above to verify the consistency of measurements. This analysis shows that the errors are underestimated by a factor of 2.5 and we corrected them accordingly. For the galaxies with two redshift measurements, we combined the duplicate determinations as above. Our final spectroscopic VLT catalog lists 458 galaxies down to r ∼ 24 mag, about three magnitudes fainter than the data from TNG. The median value of the cz errors is 140 km s−1.
3. Spectroscopic catalog
In creating a unique catalog, we also took into account the redshift data provided by Smith et al. (2004, hereafter S04, 41 galaxies), which were analyzed in our previous study (De Grandi et al. 2016). We verified the consistency of the S04 data with our new TNG data by applying the FIT-ZZ procedure to the 13 objects listed in both catalogs. This analysis shows that the S04 errors are underestimated by a factor of two, and we corrected them accordingly. For the galaxies listed in both catalogs, we combined the duplicate redshift determinations as above. We obtained the combined catalog TNG+S04 and compared it with the VLT catalog. We verified their consistency by applying the FIT-ZZ procedure to 23 common objects and combined the data to obtain a unique catalog. The final spectroscopic catalog consists of 623 galaxies, mostly from VLT observations, covering mainly the cluster core and the region around LEDA 87445.
We also used public photometric data from the CFHT archive obtained with the Megaprime/Megacam camera at the Canada-France-Hawaii Telescope. From the CADC Megapipe archive (Gwyn 2009) we retrieved the catalogs for the images in Megacam g and r bands and corrected the magnitudes for Galactic extinction. The total area covered by the images is 1.05 × 1.16 deg2. The estimated limiting magnitudes (at the 5σ c.l.) are g = 25.5 mag and r = 24.5 mag.
Table 1, available at CDS, lists the velocity catalog for the member galaxies, as defined in Sect. 4. Figure 1 shows the cluster region sampled by our redshift catalog, with the XMM-Newton X-ray contours superimposed. Our new spectroscopic observations are mainly focused on the south-southeastern part of A780, allowing us to analyze the cluster galaxies from the cluster center out to LEDA 87445.
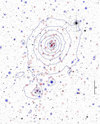 |
Fig. 1. CFHT/Megacam r-band image (north top and east left) of the galaxy cluster A780 with the contour levels of the XMM-Newton X-ray image superimposed (photons in the energy range 0.7−1.2 keV, De Grandi et al. 2016). Cluster members, as defined in Sect. 4, are highlighted by red circles (see Table 1). The numbers denote the galaxies discussed in the text: ID 47 (the BCG where the Hydra A radio source is located) and ID 97 (LEDA 87445). |
Radial velocities of 126 member galaxies of A780.
The cluster galaxy population is dominated by the brightest cluster galaxy (BCG) ID 47, which is located in the center of the X-ray emission. The BCG was described as a cD galaxy with an unresolved binary nucleus (Dewhirst 1959; Matthews et al. 1964). The secondary nucleus was found to be blueshifted with respect to the primary nucleus. A diffraction-limited Ks-band image taken with the MCAO system of Gemini South (Neichel et al. 2014) shows that there is a close companion galaxy to the southeast of the BCG (see also our Fig. 2). In our catalog the companion galaxy is identified as ID 50 and is blueshifted by ∼900 km s−1 with respect to the BCG. Both galaxies lie within the velocity distribution of member galaxies and are separated by a value slightly larger than the velocity dispersion (see below, Sect. 4). This confirms that ID 50 is an independent cluster galaxy projected onto the cluster center, very close to the BCG. Another prominent galaxy is LEDA 87445 (ID 97), the galaxy associated with the bright X-ray tail (De Grandi et al. 2016).
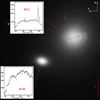 |
Fig. 2. Near-IR diffraction-limited image of the BCG and ID 50 taken with the MCAO system of the Gemini South telescope (adapted from Fig. 5 in Neichel et al. 2014). The insets show the wavelength-calibrated TNG spectra of BCG and its close projected companion. |
4. Member selection and global properties
To select cluster members among the 623 galaxies in our spectroscopic catalog, we used the two-step method known as Peak+Gap (P+G), which was previously applied by Girardi et al. (2015). The first step is the application of the 1D adaptive-kernel DEDICA method (Pisani 1993, 1996; see also Girardi et al. 1996). This method detects A780 as a peak at z ∼ 0.0543 populated by 131 galaxies. All but one of the non-members are background galaxies.
In a second step we combine the spatial and velocity information by applying the “shifting gapper” procedure (Fadda et al. 1996; Girardi et al. 1996). Of the galaxies that lie within an annulus around the center of cluster, this procedure rejects those that are too far away in velocity from the main body of galaxies (i.e., farther away than a fixed velocity gap). The position of the annulus is shifted at increasing distances from the center of the cluster. The procedure is repeated until the number of cluster members converges to a stable value. Following Fadda et al. (1996), we use a gap of 1000 km s−1 in the cluster rest frame, and an annulus size of 0.6 Mpc or larger at least to include 15 galaxies. In fixing the cluster center, we consider the position in right ascension (RA) and declination (Dec) of the BCG [RA =  , Dec =
  (J2000.0)]. This procedure confirms 126 fiducial cluster members in the range 14 401 ≤ V ≤ 18 745 km s−1 (i.e., 0.048036 ≤ z ≤ 0.062527; see Fig. 3).
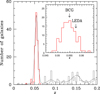 |
Fig. 3. Distribution of galaxy redshifts within z = 0.2. The histogram refers to all galaxies with the spectroscopic redshift in the region of A780. The histogram with the thick, red line refers to the 131 galaxies assigned to the A780 peak by the 1D DEDICA reconstruction method (faint line). The inset shows the 126 member galaxies with the redshifts of the BCG and LEDA 87445 indicated. |
Although A780 is a modest cluster, it is well isolated in projected phase space, as shown in Fig. 4. To highlight the region of cluster members, we also plot the escape velocity curves obtained with the mass estimate calculated below and assuming a Navarro–Frenk–White (NFW, Navarro et al. 1997) mass density profile following the recipe of den Hartog & Katgert (1996).
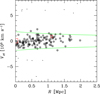 |
Fig. 4. Rest frame velocity Vrf = (V − ⟨V⟩)/(1 + z) vs. projected cluster-centric distance R for galaxies with redshifts in the range ±8000 km s−1 (black dots). Circles indicate the 126 members of the cluster. The large and small red squares refer to the BCG and LEDA 87445, respectively. The green curves contain the region where |Vrf| is smaller than the escape velocity (see text). |
The analysis of the velocity distribution of the 126 cluster members was performed using the biweight estimators for location and scale included in ROSTAT (statistical routines of Beers et al. 1990). Our measurement of the mean redshift of the cluster is ⟨z⟩ = 0.0545 ± 0.0002 (i.e., ⟨V⟩ = 16 313 ± 71 km s−1). We estimate the velocity dispersion, σV, by applying the cosmological correction and the standard correction for velocity errors (Danese et al. 1980). We obtain  km s−1, where the errors are estimated by a bootstrap technique.
Using the fitted relation between the mass3M200 and the velocity dispersion in simulated clusters Eq. (1) of Munari et al. (2013) we derive M200 = 5.4 ± 1.5 × 10¹⁴ M⊙ for the mass contained in R200 = 1.65 ± 0.10 Mpc. The uncertainties of 6% and 28% for R200 and M200 are calculated using the error propagation for σV (R200 ∝ σV and  ) and an additional uncertainty of 10% for the mass due to the scatter around the relation of Munari et al. (2013). Properties of the cluster are shown in Table 2.
Global properties of A780.
Figure 5 shows the distribution of the member galaxies in the (g − r vs. r) color-magnitude diagram, compared to all galaxies with redshift measurements. The color-magnitude relation, indicating the location of the early-type galaxies, can be seen out to faint magnitudes of r ∼ 21 mag. Following Boschin et al. (2012) we use a 2σ rejection procedure to fit g − r = 1.34 − 0.03 × r.
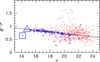 |
Fig. 5. Aperture color vs. Kron-like magnitude diagram (g − r vs. r). All galaxies with available spectroscopy and member galaxies are indicated by red crosses and blue squares, respectively. The large blue square and triangle indicate the BCG and LEDA 87445, respectively. The black line shows the color-magnitude relation obtained for the member galaxies. |
5. Substructure analysis
We analyzed the presence of substructures using the velocity distribution of galaxies, their projected positions on the sky, and the combination of these two pieces of information (1D, 2D, and 3D tests, respectively).
Using a number of indicators such as kurtosis, skewness, tail index, and asymmetry index (Bird & Beers 1993), the analysis of the velocity distribution shows no evidence of possible deviations from Gaussian distribution. Moreover, the BCG is a good indicator of the mean redshift of the cluster as there is no evidence for a peculiar velocity according to the Indicator test of Gebhardt & Beers (1991).
We analyzed the spatial distribution of the 126 spectroscopic member galaxies using the 2D adaptive-kernel method of Pisani (1996, hereafter 2D DEDICA, see also Girardi et al. 1996). Our results are shown in Fig. 6 and Table 3. For each clump of galaxies detected with a c.l. higher than 99%, Table 3 contains the number of member galaxies, the position of the 2D density peak, and its relative density ρ with respect to the densest peak. Figure 6 shows a peak in the cluster core (Core) and other peaks in the south and southeast (S, SSE, and SE). The BCG and LEDA 87445 belong to Core and SSE galaxy groups, respectively. To verify that our results are independent of the positioning of the spectroscopic masks, we performed the same analysis for the 497 non-member galaxies and found that non-members cluster in a different way.
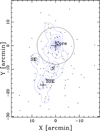 |
Fig. 6. Spatial distribution of the 126 spectroscopically determined cluster members on the sky and the relative isodensity contour map obtained with the 2D DEDICA method (black dots and blue contours). The two black crosses indicate the position of the BCG and LEDA 87445. The plot is centered on the cluster center and circle contains the cluster within a radius of 0.5 Mpc ∼ 1/3 × R200. Labels refer to the 2D DEDICA peaks in the galaxy distribution shown in Table 3. |
2D DEDICA substructure.
For each group, Table 3 lists the mean velocity of the member galaxies. The mean velocity of the galaxies in the SSE group is 3σ higher than that of the galaxies in the Core group (ΔVrf ∼ 850 km s−1 at the cluster rest frame). The velocity difference is the same order as that between the two brightest galaxies, the BCG and LEDA 87445. However, the BCG velocity is significantly higher than the mean velocity of the Core group, with a c.l. in the range 95−99% according to the Indicator test. The velocity of LEDA 87445 is higher than that of the SSE group, with a c.l. in the range 90−95%. These discrepancies could be the consequence of a truly complex structure or contamination by projected galaxies. To address this issue, we present below analyses based on positions and on velocities.
As for the full 3D analysis, we looked for a correlation between velocity and position information. The presence of a velocity gradient is quantified by a multiple linear regression fit to the observed velocities with respect to the galaxy positions in the plane of the sky (see also den Hartog & Katgert 1996). The position angle on the celestial sphere is  degrees (measured counterclockwise from the north), which means that high-velocity galaxies are located in the southeastern region of the cluster (see Fig. 7). To assess the significance of this velocity gradient, we performed 1000 Monte Carlo simulations of clusters by randomly shuffling the velocities of the galaxies. For each simulation, we determined the coefficient of multiple determination (RC2, NAG Fortran Workstation Handbook 1986). The significance of the velocity gradient is the fraction of cases in which the RC2 of the simulated data is smaller than the observed RC2. In A780, the velocity gradient is significant at the 98.5% confidence level.
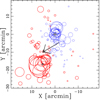 |
Fig. 7. Dressler & Schectman bubble plot for the DSV test. Spatial distribution of the 126 cluster members, each indicated by a symbol: the larger the symbol, the greater the deviation |δi, V| of the local mean velocity from the global mean velocity. The blue thin and red thick circles indicate where the local mean velocity is smaller or larger than the global mean velocity. The diagram is centered on the center of the cluster and the large and small crosses indicate the BCG and LEDA 87445. The arrow indicates the direction of the velocity gradient, which points toward the region with high velocities. |
We used the classical Δ-test of Dressler & Shectman (1988, hereafter DS test). For each ith galaxy, the deviation of the local mean velocity from the global velocity is defined as |δi| with ![$ \delta_{i}^2 = [(N_{\rm nn}+1)/\sigma^2_{\rm V}] \times [(\langle V \rangle_{\rm loc} - \langle V \rangle)^2 + (\sigma_{\rm V,loc} - \sigma_{\rm V})^2] $](/articles/aa/full_html/2022/02/aa42213-21/aa42213-21-eq7.gif) , where the local mean velocity ⟨V⟩loc and velocity dispersion σV, loc are calculated using the ith galaxy and its Nnn = 10 neighbors. For a cluster the cumulative deviation is given by the value of Δ, which is the sum of the |δi| values of the individual N galaxies. We also used the modified version that considers only the indicator of local mean velocity, that is δi, V = [(Nnn + 1)1/2/σV] × (⟨V⟩loc − ⟨V⟩) and Δ is the sum of the |δi, V| values of the individual N galaxies (hereafter DSV test, Girardi et al. 2010). As in the calculation of the velocity gradient, the significance of the Δ (i.e., the presence of substructure) is based on 1000 Monte Carlo simulated clusters. In A780, the significance of the substructure is larger than the 99.9% c.l. according to the DS and the DSV tests. In Fig. 7 we show the Dressler & Schectman bubble-plot resulting from the indicator of the DSV test, |δi, V|. This plot shows very clearly how the galaxy LEDA 87445 is surrounded by galaxies that have higher velocities than the galaxies in the core of the cluster.
, where the local mean velocity ⟨V⟩loc and velocity dispersion σV, loc are calculated using the ith galaxy and its Nnn = 10 neighbors. For a cluster the cumulative deviation is given by the value of Δ, which is the sum of the |δi| values of the individual N galaxies. We also used the modified version that considers only the indicator of local mean velocity, that is δi, V = [(Nnn + 1)1/2/σV] × (⟨V⟩loc − ⟨V⟩) and Δ is the sum of the |δi, V| values of the individual N galaxies (hereafter DSV test, Girardi et al. 2010). As in the calculation of the velocity gradient, the significance of the Δ (i.e., the presence of substructure) is based on 1000 Monte Carlo simulated clusters. In A780, the significance of the substructure is larger than the 99.9% c.l. according to the DS and the DSV tests. In Fig. 7 we show the Dressler & Schectman bubble-plot resulting from the indicator of the DSV test, |δi, V|. This plot shows very clearly how the galaxy LEDA 87445 is surrounded by galaxies that have higher velocities than the galaxies in the core of the cluster.
As a first attempt to detect substructure members, we resorted to the technique developed by Biviano et al. (2002). We compared the distribution of δi, V-values of the real galaxies with the distribution of δi, V-values of the galaxies of all 1000 Monte Carlo simulated clusters (Fig. 8). According to the Kolmogorov-Smirnov test, the two distributions differ at the 95% confidence level. The distribution of the values of the real galaxies shows a tail at low δi, V values and a tail at high δi, V values. When considering galaxies with |δi, V|> 2, the 15 galaxies in the low tail are projected onto the core region of the cluster and the 14 galaxies in the high tail are projected onto the LEDA 87445 region.
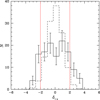 |
Fig. 8. Distribution of δi, V values of the deviation of the local mean velocity from the global velocity (according to the DSV test, see text). The solid line histogram indicates the observed galaxies. The dashed line histogram indicates the galaxies of the simulated clusters, normalized to the number of observed galaxies. The red vertical lines indicate the |δi, V|> 2 regions where we expect to find substructure members. |
In order to better determine the members of the substructures, in particular the group around LEDA 87445, we also analyzed our data using three methods. In the first step we analyzed the sample of 35 galaxies within 0.5 Mpc of LEDA 87445 using Kaye’s Mixture Model (KMM). This method, as implemented by Ashman et al. (1994), is useful for finding a possible group partitioning of the velocity distribution. The KMM algorithm fits a user-specified number of Gaussian distributions to a data set and evaluates the improvement of this fit over a single Gaussian according to the likelihood ratio test statistic. The algorithm also makes an assignment of galaxies into groups. When the KMM method is applied to the sample of 35 galaxies, we find that a bimodal distribution is better than a unimodal one at the ∼95% confidence level. We obtain a low-velocity group (LVG05) of 15 galaxies with ⟨V⟩ = 15 745 km s−1 and a high-velocity group (HVG05) of 20 galaxies with ⟨V⟩ = 17 273 km s−1 (see Fig. 9). The high-velocity group contains LEDA 87445.
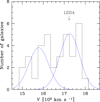 |
Fig. 9. Velocity distribution of all 35 galaxies within 0.5 Mpc of LEDA 87445. The blue curves show the two Gaussian curves resulting from the 1D KMM analysis for the two detected groups LVG05 and HV05. |
We also used the 3D DEDICA method (Pisani 1996; Bardelli et al. 1998). Table 4 lists the properties of the galaxy peaks that are detected with a probability higher than the > 99% c.l. and have a relative density ρ ≥ 0.3. Figure 10 shows the positions of the galaxies assigned to the detected groups. The group with the lowest velocity (3DLVG) is projected onto the core of the cluster. The highest velocity group (3DHVG) is the one projected onto the south-southeast region and contains LEDA 87445. Of the three intermediate velocity groups, 3DMVG2 is projected onto the core of the cluster and contains the BCG. Since it is known that the multidimensional application of the DEDICA algorithm may lead to spurious substructure (Bardelli et al. 1998), we also applied the alternative version of Balestra et al. (2016) based on the rule of thumb for the kernel size given by Silverman (1986). The goal is to detect the major substructures at the cost of losing some real minor substructures. The alternative procedure is successful in recovering a main system (96 galaxies) and the 3DSHVG group (30 galaxies). The 3DSHVG group contains LEDA 87445 and is populated by the same galaxies as the 3DHVG group, with the exception of two galaxies. This suggests that the detection of a galaxy group related to LEDA 87445 is quite robust.
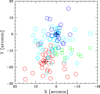 |
Fig. 10. Spatial distribution of the 126 cluster members on the sky, with the groups discovered with the 3D DEDICA method indicated by different symbols. From low to high velocities: 3DLVG (blue circles), 3DMVG1 (cyan rotated squares), 3DMVG2-BCG (cyan circles), 3DMVG3 (green squares), and 3DHVG-LEDA (red circles). The crosses indicate the BCG and LEDA 87445. |
3D DEDICA substructure.
As a final approach, we applied the method described by Serna & Gerbal (1996), which is referred to in the literature as the Serna-Gerbal or H-tree method (e.g., Durret et al. 2009; Girardi et al. 2011; Guennou et al. 2014). The H-tree method uses hierarchical cluster analysis to determine the relationship between galaxies based on their relative binding energy. The ignorance of the mass associated with each galaxy is overcome by assuming the typical mass-to-light ratio of galaxy clusters for each galaxy halo. Figure 11 shows the resulting dendrogram for the case M/Lr = 200 M⊙/L⊙ (e.g., Popesso et al. 2005), where the total energy appears along the horizontal axis. At the ∼30 energy level (in normalized units), the cluster splits into two groups, HTG1 and HTG2. The BCG and its close companion are located in the potential hole of the HTG1 group, which is populated by 24 galaxies. LEDA 87445 is located in the potential hole of group HTG2, which is populated by five galaxies. HTG1 and HTG2 probably correspond to the cores of the main cluster and the LEDA 87445 group, respectively. Similar results are found in the cases with M/Lr = 150 and 250 M⊙/L⊙. Table 5 summarizes the kinematic properties of the LEDA group obtained by different methods.
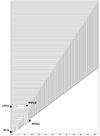 |
Fig. 11. Dendrogram obtained by the H-tree algorithm. The x-axis is the binding energy, here in arbitrary units with the lowest negative energy levels on the left. The labels indicate prominent galaxies and structures. |
Kinematic properties of the group related to LEDA 87445.
6. Discussion
6.1. Cluster global properties
In this section we first discuss our results on global properties of A780. Our estimates for the cluster mean redshift, ⟨z⟩ = 0.0545 ± 0.0002, and velocity dispersion,  km s−1, agree within 1σ with our previous estimates in De Grandi et al. (2016). With four times as many cluster members, the uncertainties are smaller by a factor of two. Using our estimate of σV and the estimate of the global X-ray temperature in the literature (kTX ∼ 3 − 3.5 keV), we can calculate the ratio of the energy per unit mass of galaxies to that of the ICM,
  , where
  with μ = 0.58 the average molecular weight and mp the proton mass. Since βspec = 1 is expected when assuming density-energy equipartition between galaxies and ICM, our result means that A780 is probably not far from the dynamical equilibrium. This indication of large-scale relaxation is consistent with the evidence reported in the literature, such as the presence of a cool core and the smoothness of the X-ray morphology of A780 within 1 Mpc (see Sect. 1).
The velocity of the BCG is very close to the mean velocity of the galaxy cluster and we have found that there is no peculiarity in terms of the velocity distribution of the cluster galaxies. For the BCG, we calculate |Vrf/σV| = 0.08, which places A780 in the low tail of the |Vrf/σV| distribution, as obtained by Lauer et al. (2014) for 178 clusters. The BCG spectrum shows a few emission lines (see Fig. 2) and the BCG color is bluer than that of the red sequence (see Fig. 5), which is consistent with what is expected for BCGs in cool core clusters, especially for BCGs with radio emission, as known in the literature (e.g., Crawford et al. 1995). Thus, the BCG also exhibits the typical features of BCGs in relaxed systems.
Our estimate of the dynamical mass, M200 = 5.4 ± 1.5 × 10¹⁴ M⊙, is in agreement with the mass obtained from the gravitational lensing,  (Okabe et al. 2016). Taking into account the large uncertainties, there is also a 2σ agreement with the mass estimate from X-ray data,
  (Zhu et al. 2021). However, our nominal value of the dynamical mass is a factor of two higher than the value of the mass from X-rays, and we prefer to discuss it further. Mass estimates of galaxy clusters are subject to various systematic uncertainties and biases, depending on the approach taken (see Pratt et al. 2019 for a review). This can justify strong differences when comparing mass estimates for a single cluster. When samples of many clusters with high-quality data are examined, generally better agreement is found (Ettori et al. 2019).
Although our study is not dedicated to the study of the galaxy population, our data show that the red sequence is visible at least down to r ∼ 21 mag, about five magnitudes below the value of M* in the luminosity function (see Fig. 5). This is consistent with previous studies that have looked at the spectroscopically determined luminosity function in clusters down to similarly deep magnitudes. These studies show that the red sequence in local clusters is already established down to galaxies with faint magnitudes, albeit with different levels of definition (Rines & Geller 2008; Aguerri et al. 2020 and references therein). We refer the reader to the review by Boselli & Gavazzi (2014) for a full discussion of the origin of the faint end of the red sequence in high-density environments.
6.2. Cluster substructure
Our study is designed to provide new insights into the small-scale structure of A780, especially in the LEDA 87445 region. We present solid evidence for the existence of a group of galaxies around LEDA 87445. The first evidence comes from our 2D analysis (see Fig. 6). It is useful to compare our present results with those based on photometric likely members in our previous study, which uniformly cover the entire cluster field (see Fig. A.3 in De Grandi et al. 2016). Both the old and new maps of the galaxy distribution show the presence of a substructure related to LEDA 87445. This suggests that photometric likely members can be a good alternative to study the internal structure of the cluster, at least if the bright galaxies located in the red sequence are considered (e.g., Lubin et al. 2000). The final evidence comes from the DS and DSV tests, which find a very significant correlation between galaxy positions and velocities, confirming the presence of high-velocity galaxies around LEDA 87445 (see Fig. 7).
Our spectroscopic catalog is extensive enough to make an attempt to identify the members of the LEDA 87445 group and to obtain a first estimate of its kinematic properties (see Table 5). For each method we find good agreement between the mean velocity of the group and the velocity of LEDA 87445, and between the center of the group and the position of LEDA 87445. LEDA 87445 is characterized by a higher velocity with respect to the cluster mean velocity, with a velocity difference of Vrf ∼ +870 km s−1. Depending on the detection method, the velocity difference between the group and the cluster ranges from Vrf = +785 km s−1 to +920 km s−1. LEDA 87445 lies ∼1.1 Mpc south of the cluster center. Our estimates of the group center are around LEDA 87445, at distances in the range of 40−100 kpc. We thus find no evidence of a systematic shift between the galaxies of the group and LEDA 87445 itself, which can be considered a good tracer of the group.
In De Grandi et al. (2016) we propose that the LEDA 87445 group is infalling and moving in a circular orbit with a velocity of  km s−1 relative to the main cluster, as seen from X-ray features. This velocity estimate is subject to large uncertainties and no difference can be detected with the Vrf estimated here. In De Grandi et al. (2016), we also propose that the tail of the LEDA 87445 group is due to ram pressure. According to new hydrodynamical simulations, Sheardown et al. (2019) claim that the X-ray features are more consistent with the scenario of a slingshot tail rather than a tail caused by ram pressure. In this scenario, the group has already passed the cluster center with a large impact parameter and is now near the apocenter, where it re-enters the cluster (see their Fig. 1). However, Sheardown et al. (2019) do not give an estimate of the velocity of the LEDA 87445 group.
Table 5 also reports the estimates for the velocity dispersion of group galaxies. We note that the estimate of the dispersion is less robust than the estimate of the mean. In particular, possible contamination by non-member galaxies is likely to lead an overestimation of the true value of the velocity dispersion. The nominal values of the velocity dispersion range from σV ∼ 420 to ∼500 km s−1, that is kTX ∼ 1.1 − 1.5 keV assuming βspec = 1. This temperature estimate is in agreement with X-ray data for the gas along the wake (kTX ∼ 1.3, De Grandi et al. 2016). Our estimate of the group mass, based on the value of σV and the relation of Munari et al. (2013), is M200 = 0.8 − 1.3 × 10¹⁴ M⊙, while the mass estimated by De Grandi et al. (2016) using the M500 − kTX relation of Sun et al. (2009) was found to be M500, X = 0.2 − 0.5 × 10¹⁴ M⊙ (i.e., M200, X = 0.3 − 0.7 × 10¹⁴ M⊙). In the case of the LEDA 87445 group, the main source of the uncertainty in the dynamical mass is probably related to the selection of the group galaxies. On the other hand, the gas content might suffer more from the interaction with the main system due to its collisional nature, and therefore the X-ray mass is also quite uncertain. Taking our nominal values of the mass for the LEDA 87445 group and the parent cluster, we can estimate that their mass ratio is ∼1 : 5.
We also obtain new information about the cluster core. The galaxy distribution in the cluster core is characterized by some strong peculiarities. The phase-space diagram of the cluster galaxies shows that the BCG velocity is close to the cluster mean velocity (set to zero in Fig. 4), but in the inner regions, within ∼0.5 Mpc, there are very few galaxies with velocities higher than that of the BCG. This asymmetry is real with a probability of 99.1%, as determined by applying a 2D Kolmogorov–Smirnov test to compare the distributions of galaxies with positive and negative velocities within 0.5 Mpc. The mean velocity of the 44 galaxies within 0.5 Mpc is ⟨Vrf⟩= − 259 ± 107 km s−1, which differs from the expected zero value at 99.3%, in agreement with the above test. We note for comparison that the distribution of galaxies in the phase space outside 0.5 Mpc does not show significant asymmetry between positive and negative velocities, despite the presence of the LEDA 87445 group. Moreover, according to the DSV test, the cluster core is characterized by galaxies with peculiar low velocity (see Fig. 7) and the BCG has a higher peculiar velocity with respect to the galaxy peak detected by our 2D DEDICA analysis in the core. Another indication of a peculiarity of the mass distribution in the cluster core comes from the analysis of the weak lensing data, which are better described at the innermost radius by a two-component model (Okabe et al. 2016).
A possible interpretation of the above features in the cluster core is that there is a low-velocity group, still far from being virialized within the cluster, which is projected onto the cluster core. Using the 3D DEDICA method, we can detect a group of low-velocity galaxies in the core (3DLVG) whose peak velocity is lower than the mean velocity of the cluster, Vrf ∼ −750 km s−1, and the galaxy content is ∼10% of the whole system (see Table 4 and Fig. 10).
To check the above “group hypothesis”, we ran a simple Monte Carlo simulation to reproduce a combined system of cluster plus a group with the same center. For a given mass M200, we used the NFW model with the appropriate concentration parameter (Navarro et al. 1997; Dolag et al. 2004) to simulate the 2D galaxy distribution of galaxies out 2 R200 (e.g., Biviano & Girardi 2003; Rines et al. 2013). The velocities were distributed according to a Gaussian. To mimic the cluster we used the mass and velocity dispersion of the whole A780 (M200 = 5.4 × 10¹⁴ M⊙, σV = 795 km s−1) and distributed the particles in such a way to have 10 000 particles within R200 = 1.65 Mpc, with zero mean velocity. The group was ten times less massive (M200 = 0.54 × 10¹⁴ M⊙, σV = 369 km s−1), with 1000 particles within R200 = 0.767 Mpc, and mean velocity equal to −750 km s−1. Out of this combined system we randomly extracted 1000 times 44 particles within R = 0.5 Mpc from the center to obtain 1000 values of mean velocity, MVrf, sim. The value of ⟨MVrf, sim⟩ is −119 km s−1, which differs at ∼90% from the observed value ⟨Vrf⟩= − 259 ± 107 km s−1. In summary, the presence of a group projected onto the cluster center can strongly reduce the significance of the observed asymmetry in the velocity distribution. We note that our model is very simple. For instance, we assume that the particle number-density rescales with the mass of the system, while the very luminous BCG in A780 may indicate a different rescaling. Very luminous BCGs might be formed at the expenses of the merger–cannibalization of surrounding galaxies with a subsequent change of the luminosity function (e.g., see Zarattini et al. 2015). This would make the effect of the group more important.
Using N-body simulations, Vijayaraghavan et al. (2015) show that the core of a group survives for many gigayears after a head-on merger with a cluster. On the other hand, the presence of a group–cluster interaction would raise a new issue since cool cores in clusters can be resilient for off-axis mergers, but not for head-on ones (Valdarnini & Sarazin 2021 and references therein). Therefore, we suggest that the low-velocity group, if confirmed, might be on undergoing its first infall onto the cluster.
Finally, we discuss our results in terms of the central engine of the Hydra A AGN. The shock detected in the Chandra X-ray images, which is modeled as an ellipse with a size of ∼400 kpc, shows a displacement of the center with respect to the AGN, and this displacement was caused by bulk flows or sloshing in the ICM according to Simionescu et al. (2009). According to the authors, these gas motions should be associated with velocities on the order of 600 km s−1, and could be related to a small merger. We detect a galaxy group related to the LEDA 87445 group with a comparably high relative velocity, and the simulation of Sheardown et al. (2019) explains the sloshing of the ICM at the cluster center, in particular when the merging group is at its apocenter (see also Col. 3 of Fig. 7 in Sheardown et al. 2018).
7. Summary and conclusions
Our previous study (Appendix A in De Grandi et al. 2016) was based on the largest available homogeneous sample of spectroscopic data at the time; it consisted of 41 galaxies (Smith et al. 2004), from which we selected 33 member galaxies. To surpass our earlier study, we acquired new spectroscopic data at TNG and VLT, giving us a redshift catalog of 623 galaxies. Our new spectroscopic data are mainly focused on the south-southeast region of the cluster (i.e., the region of the bright X-ray tail). We paid special attention to combining data from different sources in order to obtain a homogeneous redshift catalog. Our membership selection procedure leads to a catalog of 126 member galaxies, which extends the data sample analyzed in our previous study by a factor four. In the following we list our main results:
-
We derive the mean redshift of the cluster ⟨z⟩ = 0.0545 ± 0.0002 and the line-of-sight velocity dispersion
 km s−1. We estimate the dynamical mass M200 = 5.4 ± 1.5 × 10¹⁴ M⊙ within R200 = 1.65 ± 0.10 Mpc. We find no evidence of a deviation in the density-energy equipartition between galaxies and ICM or of a peculiarity of the BCG, consistent with the cluster being relaxed on a large scale.
 -
Using four different techniques, we detect the presence of a group related to LEDA 87445 and list the fiducial members. For each technique, we calculate the velocity and center of the group. The difference between these estimates and the velocity and position of LEDA 87445 is less than 90 km s−1 and 0.1 Mpc, respectively. Therefore, LEDA 87445 is an excellent tracer of the galaxy group. Our estimate of the velocity dispersion of the group is ∼420−500 km s−1, leading to a group mass M200 = 0.8 − 1.3 × 10¹⁴ M⊙.
-
The parameters of the collision can be summarized with a relative line-of-sight velocity of Vrf ∼ +870 km s−1, a projected distance D = 1.1 Mpc, and a mass ratio of 1:5 between the group and the cluster.
-
We present evidence of an asymmetry in the velocity distribution of galaxies in the inner cluster region. This asymmetry might be related to the presence of a small low-velocity group, as suggested by the detection of a substructure projected onto the cluster center at Vrf = −750 km s−1.
We conclude that A780, although dynamically relaxed at first sight, contains minor substructures. As for the LEDA 87445 group, optical and X-ray data result in a consistent scenario and previous studies have addressed its impact on the energetics of the core region. To better understand the observed velocity asymmetry in the cluster core, we note the need for additional redshifts of galaxies in that region.
Acknowledgments
We thank the referee for her/his useful and constructive comments. M.G. acknowledges the support from the grant MIUR PRIN 2017 WSCC32 “Zooming into dark matter and proto-galaxies with massive lensing clusters”. This publication is based on observations made on the island of La Palma with the Italian Telescopio Nazionale Galileo (TNG), which is operated by the Fundación Galileo Galilei – INAF (Istituto Nazionale di Astrofisica) and is located in the Spanish Observatorio of the Roque de Los Muchachos of the Instituto de Astrofísica de Canarias. This publication is based on observations collected at the European Southern Observatory under ESO programme 098.A-0807(A). This publication uses public data from the CFHT Science Archive, which contains data provided by the Canada-France-Hawaii Telescope.
References
- Abell, G. O., Corwin, H. G., Jr., & Olowin, R. P. 1989, ApJS, 70, 1 [NASA ADS] [CrossRef] [Google Scholar]
- Adami, C., Biviano, A., Durret, F., & Mazure, A. 2005, A&A, 443, 17 [NASA ADS] [CrossRef] [EDP Sciences] [Google Scholar]
- Aguerri, J. A. L., Girardi, M., Agulli, I., et al. 2020, MNRAS, 494, 1681 [NASA ADS] [CrossRef] [Google Scholar]
- Ashman, K. M., Bird, C. M., & Zepf, S. E. 1994, AJ, 108, 2348 [Google Scholar]
- Balestra, I., Mercurio, A., Sartoris, B., et al. 2016, ApJS, 224, 33 [Google Scholar]
- Bardelli, S., Pisani, A., Ramella, M., Zucca, E., & Zamorani, G. 1998, MNRAS, 300, 589 [NASA ADS] [CrossRef] [Google Scholar]
- Barrena, R., Boschin, W., Girardi, M., & Spolaor, M. 2007, A&A, 469, 861 [NASA ADS] [CrossRef] [EDP Sciences] [Google Scholar]
- Beers, T. C., Flynn, K., & Gebhardt, K. 1990, AJ, 100, 32 [Google Scholar]
- Benavides, J. A., Sales, L. V., & Abadi, M. G. 2020, MNRAS, 498, 3852 [Google Scholar]
- Berrier, J. C., Stewart, K. R., Bullock, J. S., et al. 2009, ApJ, 690, 1292 [NASA ADS] [CrossRef] [Google Scholar]
- Bird, C. M., & Beers, T. C. 1993, AJ, 105, 1596 [NASA ADS] [CrossRef] [Google Scholar]
- Biviano, A., & Girardi, M. 2003, ApJ, 585, 205 [NASA ADS] [CrossRef] [Google Scholar]
- Biviano, A., Katgert, P., Thomas, T., & Adami, C. 2002, A&A, 387, 8 [NASA ADS] [CrossRef] [EDP Sciences] [Google Scholar]
- Boschin, W., Girardi, M., Barrena, R., & Nonino, M. 2012, A&A, 540, A43 [NASA ADS] [CrossRef] [EDP Sciences] [Google Scholar]
- Boselli, A., & Gavazzi, G. 2014, A&ARv, 22, 74 [Google Scholar]
- Crawford, C. S., Edge, A. C., Fabian, A. C., et al. 1995, MNRAS, 274, 75 [NASA ADS] [CrossRef] [Google Scholar]
- Danese, L., de Zotti, G., & di Tullio, G. 1980, A&A, 82, 322 [NASA ADS] [Google Scholar]
- De Grandi, S., Eckert, D., Molendi, S., et al. 2016, A&A, 592, A154 [NASA ADS] [CrossRef] [EDP Sciences] [Google Scholar]
- den Hartog, R., & Katgert, P. 1996, MNRAS, 279, 349 [NASA ADS] [CrossRef] [Google Scholar]
- Dewhirst, D. W. 1959, in URSI Symp. 1: Paris Symposium on Radio Astronomy, ed. R. N. Bracewell, 9, 507 [NASA ADS] [Google Scholar]
- Dolag, K., Bartelmann, M., Perrotta, F., et al. 2004, A&A, 416, 853 [NASA ADS] [CrossRef] [EDP Sciences] [Google Scholar]
- Dressler, A., & Shectman, S. A. 1988, AJ, 95, 985 [Google Scholar]
- Durret, F., Slezak, E., & Adami, C. 2009, A&A, 506, 637 [NASA ADS] [CrossRef] [EDP Sciences] [Google Scholar]
- Eckert, D., Molendi, S., Owers, M., et al. 2014, A&A, 570, A119 [NASA ADS] [CrossRef] [EDP Sciences] [Google Scholar]
- Ettori, S., Ghirardini, V., Eckert, D., et al. 2019, A&A, 621, A39 [NASA ADS] [CrossRef] [EDP Sciences] [Google Scholar]
- Fadda, D., Girardi, M., Giuricin, G., Mardirossian, F., & Mezzetti, M. 1996, ApJ, 473, 670 [NASA ADS] [CrossRef] [Google Scholar]
- Feretti, L., Gioia, I. M., & Giovannini, G. 2002, Merging Processes in Galaxy Clusters (Dordrecht: Kluwer Academic Publishers), 272 [Google Scholar]
- Forman, W., Jones, C., Schwarz, J., & Giacconi, R. 1979, BAAS, 11, 634 [NASA ADS] [Google Scholar]
- Gebhardt, K., & Beers, T. C. 1991, ApJ, 383, 72 [NASA ADS] [CrossRef] [Google Scholar]
- Girardi, M., Fadda, D., Giuricin, G., et al. 1996, ApJ, 457, 61 [NASA ADS] [CrossRef] [Google Scholar]
- Girardi, M., Boschin, W., & Barrena, R. 2010, A&A, 517, A65 [NASA ADS] [CrossRef] [EDP Sciences] [Google Scholar]
- Girardi, M., Bardelli, S., Barrena, R., et al. 2011, A&A, 536, A89 [NASA ADS] [CrossRef] [EDP Sciences] [Google Scholar]
- Girardi, M., Mercurio, A., Balestra, I., et al. 2015, A&A, 579, A4 [NASA ADS] [CrossRef] [EDP Sciences] [Google Scholar]
- Guennou, L., Adami, C., Durret, F., et al. 2014, A&A, 561, A112 [NASA ADS] [CrossRef] [EDP Sciences] [Google Scholar]
- Gwyn, S. D. J. 2009, in Astronomical Data Analysis Software and Systems XVIII, eds. D. A. Bohlender, D. Durand, & P. Dowler, ASP Conf. Ser., 411, 123 [NASA ADS] [Google Scholar]
- Ichinohe, Y., Werner, N., Simionescu, A., et al. 2015, MNRAS, 448, 2971 [NASA ADS] [CrossRef] [Google Scholar]
- Jones, C., Stern, C., Forman, W., et al. 1997, ApJ, 482, 143 [Google Scholar]
- Laganá, T. F., Andrade-Santos, F., & Lima Neto, G. B. 2010, A&A, 511, A15 [NASA ADS] [CrossRef] [EDP Sciences] [Google Scholar]
- Lane, W. M., Clarke, T. E., Taylor, G. B., Perley, R. A., & Kassim, N. E. 2004, AJ, 127, 48 [NASA ADS] [CrossRef] [Google Scholar]
- Lauer, T. R., Postman, M., Strauss, M. A., Graves, G. J., & Chisari, N. E. 2014, ApJ, 797, 82 [Google Scholar]
- Lisker, T., Vijayaraghavan, R., Janz, J., et al. 2018, ApJ, 865, 40 [Google Scholar]
- Lubin, L. M., Brunner, R., Metzger, M. R., Postman, M., & Oke, J. B. 2000, ApJ, 531, L5 [NASA ADS] [CrossRef] [Google Scholar]
- Matthews, T. A., Morgan, W. W., & Schmidt, M. 1964, ApJ, 140, 35 [NASA ADS] [CrossRef] [Google Scholar]
- McGee, S. L., Balogh, M. L., Bower, R. G., Font, A. S., & McCarthy, I. G. 2009, MNRAS, 400, 937 [Google Scholar]
- McNamara, B. R., Wise, M., Nulsen, P. E. J., et al. 2000, ApJ, 534, L135 [NASA ADS] [CrossRef] [Google Scholar]
- Molnar, S. 2015, Front. Astron. Space Sci., 2, 7 [NASA ADS] [Google Scholar]
- Munari, E., Biviano, A., Borgani, S., Murante, G., & Fabjan, D. 2013, MNRAS, 430, 2638 [Google Scholar]
- NAG Fortran Workstation Handbook 1986, NAG Fortran Workstation Handbook (Downers Grove: Numerical Algorithms Group) [Google Scholar]
- Navarro, J. F., Frenk, C. S., & White, S. D. M. 1997, ApJ, 490, 493 [Google Scholar]
- Neichel, B., Rigaut, F., Vidal, F., et al. 2014, MNRAS, 440, 1002 [NASA ADS] [CrossRef] [Google Scholar]
- Nulsen, P. E. J., McNamara, B. R., Wise, M. W., & David, L. P. 2005, ApJ, 628, 629 [NASA ADS] [CrossRef] [Google Scholar]
- Okabe, N., Umetsu, K., Tamura, T., et al. 2016, MNRAS, 456, 4475 [NASA ADS] [CrossRef] [Google Scholar]
- Osmond, J. P. F., & Ponman, T. J. 2004, MNRAS, 350, 1511 [NASA ADS] [CrossRef] [Google Scholar]
- Peng, Y., Maiolino, R., & Cochrane, R. 2015, Nature, 521, 192 [Google Scholar]
- Pisani, A. 1993, MNRAS, 265, 706 [NASA ADS] [Google Scholar]
- Pisani, A. 1996, MNRAS, 278, 697 [NASA ADS] [CrossRef] [Google Scholar]
- Popesso, P., Biviano, A., Böhringer, H., Romaniello, M., & Voges, W. 2005, A&A, 433, 431 [NASA ADS] [CrossRef] [EDP Sciences] [Google Scholar]
- Pratt, G. W., Arnaud, M., Biviano, A., et al. 2019, Space Sci. Rev., 215, 25 [Google Scholar]
- Press, W. H., Teukolsky, S. A., Vetterling, W. T., & Flannery, B. P. 1992, Numerical Recipes in FORTRAN. The Art of Scientific Computing (Cambridge: Cambridge University Press) [Google Scholar]
- Rines, K., & Geller, M. J. 2008, AJ, 135, 1837 [NASA ADS] [CrossRef] [Google Scholar]
- Rines, K., Geller, M. J., Diaferio, A., & Kurtz, M. J. 2013, ApJ, 767, 15 [NASA ADS] [CrossRef] [Google Scholar]
- Sato, T., Sasaki, T., Matsushita, K., et al. 2012, PASJ, 64, 95 [NASA ADS] [CrossRef] [Google Scholar]
- Serna, A., & Gerbal, D. 1996, A&A, 309, 65 [NASA ADS] [Google Scholar]
- Sheardown, A., Roediger, E., Su, Y., et al. 2018, ApJ, 865, 118 [Google Scholar]
- Sheardown, A., Fish, T. M., Roediger, E., et al. 2019, ApJ, 874, 112 [Google Scholar]
- Silverman, B. W. 1986, Density Estimation for Statistics and Data Analysis (London: Chapman and Hall/CRC) [Google Scholar]
- Simionescu, A., Werner, N., Finoguenov, A., Böhringer, H., & Brüggen, M. 2008, A&A, 482, 97 [NASA ADS] [CrossRef] [EDP Sciences] [Google Scholar]
- Simionescu, A., Roediger, E., Nulsen, P. E. J., et al. 2009, A&A, 495, 721 [NASA ADS] [CrossRef] [EDP Sciences] [Google Scholar]
- Smith, R. J., Hudson, M. J., Nelan, J. E., et al. 2004, AJ, 128, 1558 [NASA ADS] [CrossRef] [Google Scholar]
- Sun, M., Voit, G. M., Donahue, M., et al. 2009, ApJ, 693, 1142 [NASA ADS] [CrossRef] [Google Scholar]
- Taylor, G. B., Perley, R. A., Inoue, M., et al. 1990, ApJ, 360, 41 [NASA ADS] [CrossRef] [Google Scholar]
- Tonry, J., & Davis, M. 1979, AJ, 84, 1511 [Google Scholar]
- Treu, T., Ellis, R. S., Kneib, J.-P., et al. 2003, ApJ, 591, 53 [Google Scholar]
- Valdarnini, R., & Sarazin, C. L. 2021, MNRAS, 504, 5409 [NASA ADS] [CrossRef] [Google Scholar]
- Vijayaraghavan, R., & Ricker, P. M. 2013, MNRAS, 435, 2713 [NASA ADS] [CrossRef] [Google Scholar]
- Vijayaraghavan, R., Gallagher, J. S., & Ricker, P. M. 2015, MNRAS, 447, 3623 [NASA ADS] [CrossRef] [Google Scholar]
- Wise, M. W., McNamara, B. R., Nulsen, P. E. J., Houck, J. C., & David, L. P. 2007, ApJ, 659, 1153 [NASA ADS] [CrossRef] [Google Scholar]
- Zarattini, S., Aguerri, J. A. L., Sánchez-Janssen, R., et al. 2015, A&A, 581, A16 [NASA ADS] [CrossRef] [EDP Sciences] [Google Scholar]
- Zhang, Y. Y., Andernach, H., Caretta, C. A., et al. 2011, A&A, 526, A105 [NASA ADS] [CrossRef] [EDP Sciences] [Google Scholar]
- Zhu, Z., Xu, H., Hu, D., et al. 2021, ApJ, 908, 17 [NASA ADS] [CrossRef] [Google Scholar]
All Tables
All Figures
|
Fig. 1. CFHT/Megacam r-band image (north top and east left) of the galaxy cluster A780 with the contour levels of the XMM-Newton X-ray image superimposed (photons in the energy range 0.7−1.2 keV, De Grandi et al. 2016). Cluster members, as defined in Sect. 4, are highlighted by red circles (see Table 1). The numbers denote the galaxies discussed in the text: ID 47 (the BCG where the Hydra A radio source is located) and ID 97 (LEDA 87445). |
| In the text | |
|
Fig. 2. Near-IR diffraction-limited image of the BCG and ID 50 taken with the MCAO system of the Gemini South telescope (adapted from Fig. 5 in Neichel et al. 2014). The insets show the wavelength-calibrated TNG spectra of BCG and its close projected companion. |
| In the text | |
|
Fig. 3. Distribution of galaxy redshifts within z = 0.2. The histogram refers to all galaxies with the spectroscopic redshift in the region of A780. The histogram with the thick, red line refers to the 131 galaxies assigned to the A780 peak by the 1D DEDICA reconstruction method (faint line). The inset shows the 126 member galaxies with the redshifts of the BCG and LEDA 87445 indicated. |
| In the text | |
|
Fig. 4. Rest frame velocity Vrf = (V − ⟨V⟩)/(1 + z) vs. projected cluster-centric distance R for galaxies with redshifts in the range ±8000 km s−1 (black dots). Circles indicate the 126 members of the cluster. The large and small red squares refer to the BCG and LEDA 87445, respectively. The green curves contain the region where |Vrf| is smaller than the escape velocity (see text). |
| In the text | |
|
Fig. 5. Aperture color vs. Kron-like magnitude diagram (g − r vs. r). All galaxies with available spectroscopy and member galaxies are indicated by red crosses and blue squares, respectively. The large blue square and triangle indicate the BCG and LEDA 87445, respectively. The black line shows the color-magnitude relation obtained for the member galaxies. |
| In the text | |
|
Fig. 6. Spatial distribution of the 126 spectroscopically determined cluster members on the sky and the relative isodensity contour map obtained with the 2D DEDICA method (black dots and blue contours). The two black crosses indicate the position of the BCG and LEDA 87445. The plot is centered on the cluster center and circle contains the cluster within a radius of 0.5 Mpc ∼ 1/3 × R200. Labels refer to the 2D DEDICA peaks in the galaxy distribution shown in Table 3. |
| In the text | |
|
Fig. 7. Dressler & Schectman bubble plot for the DSV test. Spatial distribution of the 126 cluster members, each indicated by a symbol: the larger the symbol, the greater the deviation |δi, V| of the local mean velocity from the global mean velocity. The blue thin and red thick circles indicate where the local mean velocity is smaller or larger than the global mean velocity. The diagram is centered on the center of the cluster and the large and small crosses indicate the BCG and LEDA 87445. The arrow indicates the direction of the velocity gradient, which points toward the region with high velocities. |
| In the text | |
|
Fig. 8. Distribution of δi, V values of the deviation of the local mean velocity from the global velocity (according to the DSV test, see text). The solid line histogram indicates the observed galaxies. The dashed line histogram indicates the galaxies of the simulated clusters, normalized to the number of observed galaxies. The red vertical lines indicate the |δi, V|> 2 regions where we expect to find substructure members. |
| In the text | |
|
Fig. 9. Velocity distribution of all 35 galaxies within 0.5 Mpc of LEDA 87445. The blue curves show the two Gaussian curves resulting from the 1D KMM analysis for the two detected groups LVG05 and HV05. |
| In the text | |
|
Fig. 10. Spatial distribution of the 126 cluster members on the sky, with the groups discovered with the 3D DEDICA method indicated by different symbols. From low to high velocities: 3DLVG (blue circles), 3DMVG1 (cyan rotated squares), 3DMVG2-BCG (cyan circles), 3DMVG3 (green squares), and 3DHVG-LEDA (red circles). The crosses indicate the BCG and LEDA 87445. |
| In the text | |
|
Fig. 11. Dendrogram obtained by the H-tree algorithm. The x-axis is the binding energy, here in arbitrary units with the lowest negative energy levels on the left. The labels indicate prominent galaxies and structures. |
| In the text | |
Current usage metrics show cumulative count of Article Views (full-text article views including HTML views, PDF and ePub downloads, according to the available data) and Abstracts Views on Vision4Press platform.
Data correspond to usage on the plateform after 2015. The current usage metrics is available 48-96 hours after online publication and is updated daily on week days.
Initial download of the metrics may take a while.