Fig. 7.
Download original image
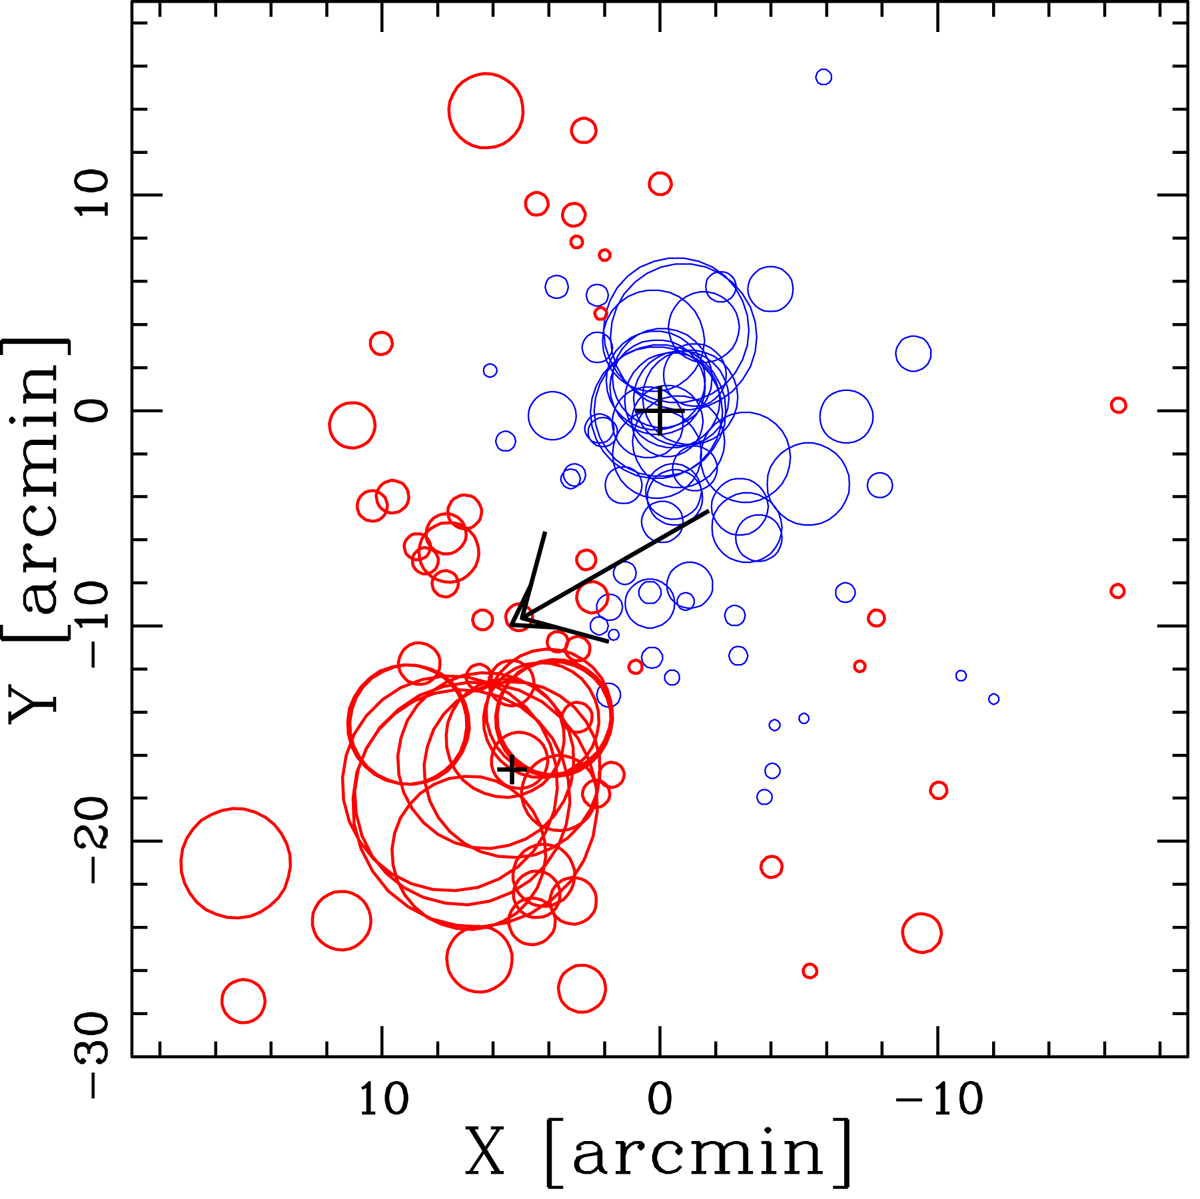
Dressler & Schectman bubble plot for the DSV test. Spatial distribution of the 126 cluster members, each indicated by a symbol: the larger the symbol, the greater the deviation |δi, V| of the local mean velocity from the global mean velocity. The blue thin and red thick circles indicate where the local mean velocity is smaller or larger than the global mean velocity. The diagram is centered on the center of the cluster and the large and small crosses indicate the BCG and LEDA 87445. The arrow indicates the direction of the velocity gradient, which points toward the region with high velocities.
Current usage metrics show cumulative count of Article Views (full-text article views including HTML views, PDF and ePub downloads, according to the available data) and Abstracts Views on Vision4Press platform.
Data correspond to usage on the plateform after 2015. The current usage metrics is available 48-96 hours after online publication and is updated daily on week days.
Initial download of the metrics may take a while.