| Issue |
A&A
Volume 658, February 2022
|
|
|---|---|---|
| Article Number | A74 | |
| Number of page(s) | 20 | |
| Section | Extragalactic astronomy | |
| DOI | https://doi.org/10.1051/0004-6361/202140641 | |
| Published online | 03 February 2022 | |
Inside-out star formation quenching and the need for a revision of bulge-disk decomposition concepts for spiral galaxies
1
Instituto de Astrofísica e Ciências do Espaço, Universidade de Lisboa, OAL, Tapada da Ajuda, 1349-018 Lisboa, Portugal
e-mail: papaderos@astro.up.pt
2
Departamento de Física, Faculdade de Ciências da Universidade de Lisboa, Edifício C8, Campo Grande, 1749-016 Lisboa, Portugal
3
Instituto de Astrofísica e Ciências do Espaço – Centro de Astrofísica da Universidade do Porto, Rua das Estrelas, 4150-762 Porto, Portugal
4
Instituto de Astrofísica de Andalucía (CSIC), Glorieta de la Astronomía s/n, 18008 Granada, Spain
5
Department of Astrophysics, University of Vienna, Türkenschanzstr. 17, 1180 Vienna, Austria
Received:
23
February
2021
Accepted:
5
November
2021
Our knowledge about the photometric and structural properties of bulges in late-type galaxies (LTGs) is founded upon image decomposition into a Sérsic model for the central luminosity excess of the bulge and an exponential model for the more extended underlying disk. We argue that the standard practice of adopting an exponential model for the disk all the way to its center is inadequate because it implicitly neglects the fact of star formation (SF) quenching in the centers of LTGs. Extrapolating the fit to the observable star-forming zone of the disk (outside the bulge) inwardly overestimates the true surface brightness of the disk in its SF-quenched central zone (beneath the bulge). We refer to this effect as δio. Using predictions from evolutionary synthesis models and by applying to integral field spectroscopy data REMOVEYOUNG, a tool that allows the suppression of stellar populations younger than an adjustable age cutoff we estimate the δio in the centers of massive SF-quenched LTGs to be up to ∼2.5 (0.7) B (K) mag. The primary consequence of the neglect of δio in bulge-disk decomposition studies is the oversubtraction of the disk underneath the bulge, leading to a systematic underestimation of the true luminosity of the latter. Secondary biases impact the structural characterization (e.g., Sérsic exponent η and effective radius) and color gradients of bulges, and might include the erroneous classification of LTGs with a moderately faint bulge as bulgeless disks. Framed in the picture of galaxy downsizing and inside-out SF quenching, δio is expected to differentially impact galaxies across redshift and stellar mass ℳ⋆, thus leading to systematic and complex biases in the scatter and slope of various galaxy scaling relations. We conjecture that correction for the δio effect will lead to a down-bending of the bulge versus supermassive black hole relation for galaxies below log(ℳ⋆/M⊙) ∼ 10.7. A decreasing ℳ∙/ℳ⋆ ratio with decreasing ℳ⋆ would help to consistently explain the scarcity and weakness of accretion-powered nuclear activity in low-mass spiral galaxies. Finally, it is pointed out that a well-detectable δio (> 2 r mag) can emerge early on through inward migration of star-forming clumps from the disk in combination with a strong contrast of emission-line equivalent widths between the quenched protobulge and its star-forming periphery. Spatially resolved studies of δio with the James Webb Space Telescope, the Extremely Large Telescope, and Euclid could therefore offer key insights into the chronology and physical drivers of SF-quenching in the early phase of galaxy assembly.
Key words: galaxies: structure / galaxies: photometry / galaxies: spiral / galaxies: bulges / galaxies: evolution
© ESO 2022
1. Introduction
An explicit assumption in bulge-disk decomposition studies of late-type galaxies (LTGs) is that the exponential model for the visible part of the disk (i.e., outside the bulge) is valid all the way to the galaxy center (below the bulge). Subtraction of that model from the galaxy allows extracting the central luminosity excess of the bulge, the fitting of which with a Sérsic (1963) function yields the total magnitude, the Sérsic index η, effective radius Reff, and the effective surface brightness μeff of the bulge.
These quantities are fundamental to our understanding of the nature and structural characteristics of galaxy bulges, and to their empirical subdivision into classical bulges and pseudobulges (cf. Gadotti 2009; Fisher & Drory 2011a,b; Fernandez Lorenzo et al. 2014; Méndez-Abreu et al. 2017; Neumann et al. 2017, among others). They also constitute the observational foundation for various galaxy scaling relations (e.g., Kormendy 1977; Faber & Jackson 1976; Djorgovski & Davis 1987), including the correlation of the bulge versus supermassive black hole (SMBH; Richstone et al. 1998; Ferrarese & Merritt 2000; Ho 2008; Simmons et al. 2013), see also, Kormendy & Ho 2013 for a review).
Regardless of whether the photometric analysis of the bulge is carried out in 1D or 2D and whether it is done sequentially, through subtraction of the disk first and subsequent fitting of the bulge, or simultaneously, through nonlinear fitting of both, the key assumption in all cases is that the intensity profile of the disk below the bulge (hereafter, inner disk, iD) is simply the inward extension of the exponential profile of the outer disk (oD).
However, it is worth contemplating what further assumptions are implicitly encapsulated in the postulate that the exponential model for the visible outer disk is valid all the way to the galaxy center. The first assumption is that the stellar surface density Σ⋆ (M⊙ kpc−2) of the disk follows a single exponential profile to R⋆ = 0″, and the second assumption is that its stellar mass-to-light ratio (ℳ/ℒ) is spatially constant.
Here, we only focus on the second assumption. To a first approximation (leaving aside the age-metallicity degeneracy), a radially constant ℳ/ℒ translates into a homologous spectral energy distribution (SED), a spatially uniform star formation history (SFH), and current specific star formation rate (sSFR), as previously pointed out in Breda et al. (2020b, hereafter B20b).
This, however, stands in diametric contrast to the well-established phenomenon of star formation quenching (SFQ) in the centers of massive (L ≳ L⋆) late-type galaxies. A strong depression or complete cessation of star formation (SF) activity within the bulge radius RB of these systems has been documented through photometry (e.g., Balcells & Peletier 1994; Peletier & Balcells 1996; de Jong & van der Kruit 1994) and, more recently, the centrally decreasing SF surface density, sSFR, and Hα equivalent width, and increasing age within RB using integral field spectroscopy (IFS) data (Pérez et al. 2013; Fang et al. 2013; González-Delgado et al. 2014; Catalán-Torrecilla et al. 2017; Belfiore et al. 2018; Zibetti et al. 2017; Breda & Papaderos 2018; Quai et al. 2019; Kalinova et al. 2021).
That SFQ commences early on in the dense centers of galaxies above typically log(ℳ⋆/M⊙) ∼ 10.5 (Strateva et al. 2001) has observationally been established through studies of galaxies at higher redshift (Tacchella et al. 2015; Mosleh et al. 2017), in agreement with cosmological simulations (e.g., Tacchella et al. 2016). The most direct illustration of SFQ is through visual inspection of true-color images of local LTGs with their typically reddish bulge and surrounding blue star-forming disk (Fig. 1, left).
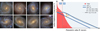 |
Fig. 1. Illustration of the morphology and radial structure of typical Milky Way-sized LTGs in the local Universe. Left: SDSS true-color thumbnails of galaxies from the sample analyzed by Breda & Papaderos (2018) with their inner reddish zone and surrounding blue star-forming disk. From top left to bottom-right: NGC 0309, NGC 0234, NGC 3811, NGC 0873, UGC 4256, NGC 2543, NGC 0171, and UGC 4308. Right: schematic representation of the bulge (shaded red area) and the disk (light blue) in a face-on late-type galaxy. The surface brightness profile of the disk results from the projection of an exponential stellar surface density Σ⋆ (dark blue), whereby the ℳ/ℒ ratio in the inner SF-quenched zone of the disk (iD) within the bulge radius RB is higher than that in the outer (R⋆ > RB) star-forming zone of the disk (oD). A consequence of this is that the central surface brightness μ0 of the disk is fainter by δμ0 mag than the value implied by inward extrapolation of the exponential fit to the outer disk (dashed line) and that the standard bulge-disk decomposition overestimates the integrated magnitude of the disk within RB by δio (mag). This in turn entails an oversubtraction of the disk, thus a systematic underestimation of the luminosity of the bulge. |
The physical origin and timescales of inside-out SFQ in galaxies, even though a fundamental subject that has motivated numerous previous investigations, is not of primary importance to our considerations next. Important is merely the simple argument that the mechanisms that inhibit SF in the bulge must also act toward inhibiting SF in the inner disk, given that these two stellar components are cospatial and their SF activity (if any at all) is fed by a common reservoir of gas (Breda et al. 2020a, hereafter B20a). Because partial or complete cessation of SF entails an increase in the ℳ/ℒ ratio, a consequence of SFQ is that the ℳ/ℒ ratio in the inner disk (R⋆ ≤ RB) must be higher than than in the outer disk (R⋆ > RB). If this is so, the SF-quenched inner disk must be dimmer than the inwardly extrapolated model for the star-forming outer disk. Therefore, the immediate implication of SFQ for bulge-disk decomposition studies is the overestimation (and oversubtraction) of the disk inside RB, consequently, the underestimation of the luminosity of the bulge.
A schematic illustration of this effect (dimmer inner disk than the inwardly extrapolated exponential fit to the outer disk) is given in the right panel of Fig. 1. For a thin face-on disk, the surface brightness profile (SBP; in L⊙ pc−2 or mag/▫″; light blue) is the product of the stellar surface density Σ⋆ (dark blue) by the inverse ℳ/ℒ. For the sake of simplicity, Σ⋆ is here assumed to follow an exponential profile all the way to R⋆ = 0″ (see, however, B20b and Sect. 4.4). If ℳ/ℒ were to be constant throughout the disk (i.e., in the case of no SFQ), then the fit to the visible outer disk at R⋆ > RB (dashed line) would yield an exact match to the profile of the invisible inner disk (R⋆ ≤ RB), thus warranting a correct determination of the central luminosity excess of the bulge (shaded red area). In the case of SFQ, however, the central surface brightness μ0 of the disk is fainter by δμ0 mag than the value inferred from the exponential model for the visible outer disk. As a result, standard bulge-disk decomposition entails an overprediction of the luminosity of the disk underneath the bulge by a factor on the order of dex(δμ0/−2.5)−1. In the following, we refer to the difference between the true integrated magnitude of the disk inside RB and the value predicted from the exponential disk model as δio (≥0 mag).
The obvious next question is whether this δio effect is relevant at all. If it is small (e.g., ≲0.2 mag), it might rightfully be argued that it is absorbed within the error budget of bulge-disk decomposition studies for spiral and lenticular galaxies and thus can be ignored. If it is significantly larger, however, then it should deserve a closer examination because it might systematically impact photometric and structural studies of bulges.
The aim of this pilot study is to draw attention to δio and motivate observational and theoretical work toward better understanding it. To this end, we provide empirical estimates of this effect and offer a concise discussion of the biases that neglecting it entails for the photometric characterization of galaxy bulges. Section 2 presents estimates based on simple evolutionary models and spectral population synthesis of IFS data for local LTGs and shows that δio can exceed 2 mag in the optical and 0.6 mag in the near-infrared (NIR). Section 3 addresses the effect of the neglect of δio on determinations of the luminosity and color of bulges. We also show that δio can prevent detection of a moderately faint bulge embedded within a centrally SF-quenched LTG and lead to its erroneous classification as bulgeless. In Sect. 4 we briefly comment on the mass-dependent evolution of δio from the perspective of galaxy downsizing and how neglecting it might be imprinted on the slope and scatter of galaxy scaling relations, including the relation between absolute magnitude MB of the bulge and SMBH mass ℳ∙. Finally, we discuss possible empirical approaches for estimating δio and accounting for it in galaxy decomposition schemes. A summary of our conclusions is given in Sect. 5.
2. Estimates of δio
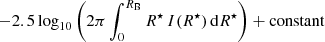
The exact value of δio depends on the integrated apparent magnitude of the disk inside the bulge radius RB,
with R⋆ denoting the photometric radius (″) and I(R⋆) the disk intensity profile (erg s−1 cm−2 ▫″) in a given photometric band. Because the central part of the disk underneath the bulge is observationally inaccessible, a direct determination of δio is not possible. Nevertheless, a rough estimate of it can be obtained from evolutionary synthesis models by assuming that the bulge and inner disk share a similar SFH (Sect. 2.1) or through a comparison of the luminosity contribution by young stellar populations in the inner and outer zone of the disk. The latter task can be achieved through postprocessing of population spectral synthesis (PSS) fits to spatially resolved IFS data with the age-slicing tool REMOVEYOUNG, as we detail in Sect. 2.2.
For the sake of brevity, we henceforth denote with “bulge” the entirety of stellar populations enclosed within RB, that is, the bulge itself and the inner disk, with a possible contribution from a bar.
2.1. Estimate of δio from evolutionary synthesis models
For an exponential stellar surface density profile Σ⋆(R⋆), δio (mag) primarily depends on the ratio ψ of the mean ℳ/ℒ of the disk inside and outside RB as
The ratio ψ in turn encapsulates the stellar mass assembly history and metallicity in the two disk zones, and obviously depends on the photometric filter considered. An estimate of ℳ/ℒ can be obtained using standard semiempirical SFH parameterizations, according to which galactic disks are characterized by a nearly-constant star formation rate (SFR; e.g., Gallagher et al. 1984) whereas stellar spheroids are better described by an exponentially declining SFR with an e-folding timescale τ that scales inversely with present-day stellar mass ℳ⋆ (Sandage 1986; Guiderdoni & Rocca-Volmerange 1987, see also Poggianti et al. 1999; Gavazzi et al. 2002).
Using PéGASE 2 (Fioc & Rocca-Volmerange 1997), we follow the photometric evolution of the outer disk (R⋆ > RB) assuming continuous SF at a constant SFR and a fixed stellar metallicity Z⊙/5 (hereafter SFH1). The bulge (R⋆ ≤ RB) is approximated by exponentially decreasing SFR models with a τ of 0.5 Gyr and 1 Gyr for solar metallicity (SFH2 and SFH3, respectively). These two models imply a currently low SFR and a predominantly old stellar population in the centers of LTGs, in agreement with optical and NIR colors (de Jong 1996a,b; Gadotti & dos Anjos 2001) and constraints from spectral synthesis (Gallazzi et al. 2005; Pérez et al. 2013; Zibetti et al. 2017; Breda & Papaderos 2018). Furthermore, the mass-weighted age implied by the two latter SFHs (t⋆,ℳ ≳ 12 Gyr) agrees well with determinations from spectral population synthesis for high-mass (log(ℳ⋆/M⊙) > 10.5) bulges (cf., e.g., Fig. 6 and Table B.1 in Breda & Papaderos 2018). The PéGASE models in Fig. 2 take nebular emission into account and refer to a Salpeter initial mass function (IMF) between 0.1 and 100 M⊙.
 |
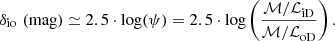
Fig. 2. Predictions based on the evolutionary synthesis code PéGASE 2 on the variation of the ℳ/ℒ ratio and δio as a function of galaxy age. Upper panel: logarithm of the ℳ/ℒ ratio as a function of time when assuming continuous star formation at a constant SFR (SFH1), and an exponentially decreasing SFR with an e-folding time τ of 0.5 Gyr and 1 Gyr (SFH2 and SFH3, respectively). Predictions for the B and R band (blue and red, respectively) are shown with symbols (squares, solid circles, and open circles for SFH1, SFH2, and SFH3, respectively) and those for the K band with curves (blue, orange, and black for SFH1, SFH2, and SFH3, respectively). Lower panel: evolution of δio, as approximated by Eq. (2), when assuming SFH2 and SFH3 for the bulge (solid and open symbols, respectively) with predictions for the B, R, and K band shown in blue, red, and black, respectively. |
The upper panel shows the evolution of ℳ/ℒ in B (Johnson), R (Cousins), and K for SFH1, SFH2, and SFH3. As expected, the ℳ/ℒ ratio evolves strongest in the B band and only mildly increases with time in the NIR. The lower panel illustrates the evolution of δio, as approximated by Eq. (2), in B, R, and K when assuming SFH2 or SFH3 for the bulge: both SFH scenarios imply a steep increase within the first ∼4 Gyr of galactic evolution (z ≈ 1.43, assuming that LTG formation began 0.5 Gyr after the Big Bang) and a leveling-off after ∼8 Gyr (z ≈ 0.6) to a nearly constant δio of ∼2.5 mag in B, 1.6 mag in R, and 0.7 mag in K.
The strongly simplified SFH parameterizations in Fig. 2 allow the insight that δio becomes significant (> 1 B mag) early on and is non-negligible in present-day LTGs. On the other hand, it should be kept in mind that the underlying working hypothesis of stellar populations within RB sharing a similar evolutionary history, although broadly consistent with observations and supported by plausibility arguments, does most certainly not capture the complexity of the diverse and highly interlinked processes that shape the evolution of gas and stars at the centers of LTGs.
The standard scenario (see, e.g., Kormendy & Kennicutt 2004, and references therein) distinguishes between classical bulges (CBs) and pseudobulges (PBs). The first are thought to emerge quasi-monolithically early on, prior to, and independently of the disk, and the second gradually build up over the billion-year-long secular evolution of LTGs through in situ SF and inward migration of stars and star-forming clumps from the disk. The picture of two distinct routes to bulge formation is not undisputed, however. For example, Breda & Papaderos (2018, hereafter BP18) found no evidence for the age bimodality implied by the standard scenario from a spectral synthesis study of a representative sample of LTGs. Their analysis shows instead that bulges span a continuous sequence in age, with the latter following a tight correlation with their present-day ℳ⋆ and Σ⋆.
Nevertheless, an elementary discussion of the relevance of δio from the perspective of the standard bulge formation scenario may be attempted. Whereas a disk underneath the bulge is unlikely to exist just after the dominant phase of CB formation, it is conceivable that stellar diffusion and inward migration of material from the outer disk subsequently lead to the gradual build-up of an inner disk. However, it is not immediately apparent why such dynamical processes per se ensure the fine-tuning required to make the Σ⋆ profile of the inner disk an exact inward extension of the exponential Σ⋆ profile of the outer disk. Furthermore, dynamical heating of the inner disk through its billion-year-long interaction with the kinematically hotter CB might inflate it into a triaxial entity that is hardly separable from the bulge itself. Such considerations suggest that CBs either lack an underlying inner disk, or that their inner disk, if present, substantially deviates from the exponential Σ⋆ slope of the outer disk (cf. the discussion in Breda et al. 2020b). This would then call for a revision of structural determinations of CBs (e.g., absolute magnitude, Sérsic exponent, and effective radius) on the basis of an adequate image decomposition scheme that allows a down-bending of the disk inside RB. Because a central depletion of the disk can from the photometric point of view be regarded as equivalent to an increase in the disk ℳ/ℒ to infinity, a high δio should be a generic characteristic of CB-hosting LTGs and as such an indispensable element to consider in their study.
The amplitude of δio in PBs likely depends on the relative contribution of migration and in situ SF to the stellar mass growth inside their RB. The first process (inward migration of stars and SF clumps from the disk) leads to negative radial age gradients with a slope that inversely scales with the average migration velocity (B20a) and can amplify preexisting SFQ patterns at the centers of LTGs (cf. BP18 for a discussion). This is due to the stellar mass filtering effect discussed in Papaderos et al. (2002, see also Papaderos & Östlin 2012), namely the depopulation of the high-mass end of the IMF with a main-sequence lifetime shorter than the migration timescale. As these authors remark, neglect of this effect can mimic a spatially varying IMF or lead to a systematic overestimation of age when color maps are used to age-date stellar populations. Quite importantly, because inward migration results in a higher ℳ/ℒ in the bulge than in the disk, it also naturally acts toward enhancing δio in PB-hosting LTGs.
It follows from these considerations that the presence of δio is consistent with the standard bulge formation scenario. On the other hand, without tight observational and theoretical constraints, it is difficult to establish whether an inner disk invariably exists in both CBs and PBs, and, if so, whether its SFH is similar to that of the bulge (and bar).
Addressing these questions not only requires further observational work (e.g., correction of bulge color gradients for a possible underlying inner disk, or a combined spectrophotometric and kinematical bulge-disk decomposition), but also the understanding of the influence of active galactic nuclei (AGN) on the SFH both within RB and over the entire galaxy. This subject encapsulates several poorly understood aspects, such as the directionality and chronology of negative AGN feedback, and its possible coupling with galaxy mass ℳ⋆. For instance, BP18 (their Fig. 6f) concluded from diagnostic emission-line ratios after Baldwin et al. (1981, hereafter BPT) that gas excitation in bulges of lower-mass LTGs (log(ℳ⋆/M⊙) ≲ 10) is dominated by photoionization by OB stars, whereas more massive ones (log(ℳ⋆/M⊙) ≳ 10.5) generally fall on the locus of composites, LINERs, and Seyferts. This empirical insight, also supported by previous work (e.g., Strateva et al. 2001; Kormendy & Ho 2013), led these authors to conjecture that the SMBH-to-bulge mass ratio ℳ∙/MB (or, alternatively, the Eddington ratio or SMBH spin parameter) increase with ℳ⋆, with the transition between SF- and AGN-dominated gas excitation occurring at around 10≲log(ℳ⋆/M⊙) ≲ 10.5 and a Σ⋆ ≃109 M⊙ kpc−2. Circumstantial support for this hypothesis comes from the observed inversion of radial stellar age gradients in bulges from zero and positive values in sub-L⋆ LTGs to predominantly negative values above log(ℳ⋆/M⊙) ∼ 10.5 (B20a).
2.2. Observational estimate of δio from population spectral synthesis
A second estimate on δio can be obtained from a comparison of the luminosity contribution of young stellar populations inside and outside the bulge. This is possible through spectral modeling of spatially resolved IFS data in conjunction with postprocessing of population vectors (the best-fitting combination of spectral templates obtained from PSS) with the tool REMOVEYOUNG (ℛ𝒴; Gomes & Papaderos 2016). This stratigraphy (age slicing) technique consists of removing simple stellar population (SSP) spectra younger than an adjustable age cutoff tcut from the population vector, of the subsequent reconstruction of the SED of the residual older stellar component, and, finally, of the computation of its apparent magnitude in various bands through convolution of its SED with (currently 25) filter transmission curves. An additional output from ℛ𝒴 is the stellar mass ℳ⋆ as a function of tcut. The determination of the magnitude and mass of stellar populations within different age intervals is implicit to the concept of this tool and has been implemented in the IFS processing pipeline PORTO3D (Papaderos et al. 2013; Gomes et al. 2016a).
REMOVEYOUNG was for the first time systematically applied to IFS data for a representative sample of 135 LTGs spanning a stellar mass 8.9 ≲ log(ℳ⋆/M⊙) ≲ 11.5 by BP18. Their sample was compiled from the CALIFA survey (Sánchez et al. 2012, 2016), which was conducted with the Potsdam Multi-Aperture Spectrometer (PMAS; Roth et al. 2005) in its PPaK mode (Verheijen et al. 2004; Kelz et al. 2006) and the V500 grating, and reduced as described in García-Benito et al. (2015, and references therein). Spectral modeling was carried out in a spaxel-by-spaxel mode with STARLIGHT (Cid Fernandes et al. 2005) using SSPs from Bruzual & Charlot (2003) for 38 ages between 1 Myr and 13 Gyr (see BP18 for details). ℛ𝒴 was applied for nine tcut back to an age of 9 Gyr (an empirical estimate of the average lookback time where the age resolution of STARLIGHT models to CALIFA data becomes lower than 1 Gyr; cf. Breda 2019) with the goal of investigating the mass assembly history of LTGs in a radially resolved manner.
While the ℛ𝒴-based analysis by BP18 reinforces the insight that the centers of massive LTGs assemble and quench first (e.g., Pérez et al. 2013; Tacchella et al. 2015), it offers a novel route to the study of inside-out SFQ through the determination of the luminosity fraction of stellar populations of different age to the SBPs of galaxies. In particular, BP18 proposed to use the difference ⟨δμ9G⟩ (mag) between the mean r-band surface brightness within the bulge radius1 at tcut = 0 Gyr and 9 Gyr as a diagnostic for the evolutionary and physical properties of LTG bulges2.
The rationale for this was that ⟨δμ9G⟩ tightly correlates with ℳ⋆, Σ⋆, and the mass-weighted stellar age and metallicity of LTG bulges. Based on ⟨δμ9G⟩, BP18 tentatively subdivided their sample into three classes: galaxies hosting iA bulges (⟨δμ9G⟩ < −1.5 mag) populate the low-mass end (log(ℳ⋆/M⊙) < 10.3) of the LTG sequence and typically show the lowest bulge-to-total (B/T) mass ratio and bulge-to-disk age contrast. iB bulges reside in LTGs with log(ℳ⋆/M⊙) ∼ 10.5 and show an intermediate ⟨δμ9G⟩, while high-mass iC bulges in LTGs with log(ℳ⋆/M⊙) ≳ 10.7 are characterized by a ⟨δμ9G⟩ greater than −0.5 mag. This last class is characterized by the highest B/T ratio and bulge-to-disk age contrast (up to ∼3 Gyr). The morphological and structural properties of these three LTG classes point to a loose association with bulgeless, pseudo-bulge, and classical-bulge LTGs, respectively.
Consistently with the observed increase in the bulge-to-disk age contrast with increasing galaxy mass (BP18; their Fig. 7c), SBPs computed with ℛ𝒴 for different tcut witness a continued growth of the disk in all LTGs, regardless of their ℳ⋆, in contrast to the evidence for a dependence of SFQ on ℳ⋆ within the bulge (cf. Fig. 5 in BP18): Suppression of stellar populations younger than 9 Gyr has virtually no effect on SBPs of high-mass iC bulges, which implies that they have completed their assembly and entered the ensuing SFQ early on.
In contrast, removal of young stellar populations leads to a strong dimming by 1–2 r mag in the disk of these most massive LTGs. At the antipodal end of low-mass LTGs (iA class), suppression of stellar populations of increasingly high age leads to a roughly symmetric dimming both in the bulge and in the disk, which points to a nearly homologous radial growth of Σ⋆. Therefore, the combined evidence from the analysis of LTGs with ℛ𝒴 suggests a trend for an increasing δio with increasing ℳ⋆. This is consistent with the fact that the mass fraction of stars older than 9 Gyr increases by a factor ∼4 within the bulge (from 21% in iA bulges to 85% in iC bulges), but only by a factor ∼2 in the outer disk (BP18).
Figure 3 shows an example of the application of ℛ𝒴 to the iC LTG NGC 0776. From panel b, it is apparent that the Hα equivalent width EW(Hα) increases from the center to the periphery, as also reflected in the radial distribution of values for individual spaxels (dots in panel c) for which the spectrum was fit with a mean percentual deviation ADEV < 6 (cf. Cid Fernandes et al. 2005; Gomes et al. 2016a). Squares correspond to mean values within irregular isophotal annuli (isan) adapted to the morphology of the emission-line free continuum (cf. BP18 for details). Panel d shows the g-band SBPs after suppression of stellar populations youger than 0.03, 0.1, 0.3, 1, 3, 5, 7, and 9 Gyr, as obtained by postprocessing the spectral modeling output from STARLIGHT with ℛ𝒴. Removal of stellar populations for all tcut has little effect on the bulge, which, taken at face value, implies that SF at the center of the galaxy has been practically extinguished since at least 9 Gyr ago. In contrast, the outer disk (R⋆/RB ≳ 1) has continued building up, as is apparent from the fact that suppression of stellar populations younger than 9 Gyr effects a dimming by ∼1.5 g mag.
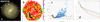 |
Fig. 3. Synopsis of results obtained for the LTG NGC 0776 (D = 65.5 Mpc; log(ℳ⋆/M⊙) = 11.1) from spectral modeling of CALIFA IFS data. (a) True-color SDSS image composite of the galaxy. The circle depicts the isophotal diameter of the bulge (15 |

The differential growth of bulge and disk is better illustrated in Fig. 4, where we show the difference between the observed g-band SBP relative to the SBPs computed for the eight aforementioned tcut values. The horizontal line corresponds to a dimming of 0 mag, and black symbols show isan determinations for tcut = 0 Gyr, that is, after subtraction of nebular line emission only. Suppression of young (< 30 Myr) ionizing stellar populations effects a dimming of δμ ∼ 0.2 mag, with the outer disk becoming fainter by ∼1.5 mag at a tcut = 9 Gyr, that is, within the range of values previously estimated from evolutionary synthesis models in Sect. 2.1. The bar, originally traceable as a weak surface brightness enhancement at R⋆/RB ≳ 1 in the observed SBP (see also Fig. 2 of BP18 for SBPs from higher-resolution SDSS data with an FWHM = 1 3 as compared to an FWHM ∼ 2
 7 for CALIFA) is now better visible out to R⋆/RB ∼2. Moreover, a noticeable feature from Fig. 4 is a slight steepening of the disk δμ (cf. linear fits for R⋆/RB > 2) for an age > 1 Gyr, which might indicate inside-out galaxy growth.
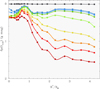 |
Fig. 4. Dimming δμ (mag) relative to the observed, emission-line corrected g-band SBP of NGC 0776 (black) as a function of normalized radius R⋆/RB after suppression of stellar populations younger than a tcut between 0.03 and 9 Gyr. The color-coding is same as in Fig. 3d. Gray lines show linear fits for R⋆/RB ≥2, i.e., in a radius interval in which the contribution of the bulge and bar become negligible. |
That the build-up timescale of stellar populations is inversely related to their present-day Σ⋆ (a trend referred to as local or subgalactic downsizing by Rosales-Ortega et al. 2012 and BP18 on the basis of spatially resolved IFS studies of stellar metallicity and age, respectively; see also Ganda et al. 2007) is illustrated in Fig. 5. Consistently with the evidence from Fig. 4, the upper panel shows that ⟨δμ9G⟩ increases by > 1 mag from the low-Σ⋆ disk periphery to the dense galactic center. As opposed to the stagnation of SF activity within RB, the continued growth of the outer disk is also reflected in its mass fraction of stars younger than 1 Gyr (lower panel), which is higher by a factor ≳4.
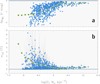 |
Fig. 5. Visualization of the connection between present-day stellar surface density and stellar mass growth for the LTG NGC 0776. (a) Difference ⟨δμ9G⟩ between the r-band magnitude of the old (≥9 Gyr) and existing stellar component vs. logarithm of the stellar surface density Σ⋆ (M⊙ kpc−2). Symbols have the same meaning as in Fig. 3c. (b) Percentual mass fraction of stars formed over the past one Gyr (lower panel) vs. Σ⋆. |
From these considerations, it follows that only after removal of stellar populations of age ≲9 Gyr does the excess emission of the outer disk (aka the δio effect) in NGC 0776 become sufficiently suppressed and its residual older stellar component become roughly compatible with the bulge from the evolutionary point of view (i.e., with regard to its SED and light-weighted age). Only then would the traditional bulge-disk decomposition concept be logically sound and ensure an unbiased determination of the luminosity and color of the bulge (and bar). Clearly, the exploration of an optimal age threshold tcut that could permit such an age homogenization of stellar populations in the bulge and disk is a nontrivial task that requires further investigation.
Nevertheless, already the cursorily discussion here shows that subtraction of an exponential model to the δio-corrected outer disk of an LTG can lead to a significant increase in the luminosity of the bulge, in addition to allowing a better recovery of a possibly present bar (Breda et al., in prep.). For instance, fitting an exponential to the SBP of NGC 0776 for tcut = 9 Gyr (dark red curve in Fig. 3d), that is, the tcut coming closest to the light-weighted age of the bulge (∼9.7 Gyr; cf. lower panel of Fig. 6), yields a total magnitude for the disk that is fainter by 1.5 mag than that determined from the observed (tcut = 0 Gyr) SBP (14.47 mag and 12.95 mag, respectively). This in turn implies a luminosity for the excess emission above the disk (i.e., bulge + bar) that is higher by a factor ∼3 and a rise in the B/T ratio of the galaxy from 0.15 to 0.43. Clearly, a positive trend between the B/T ratio and the minimum present-day age (tcut) of stellar populations extracted from an IFS cube is to be expected in an inside-out galaxy growth (and SFQ) scenario.
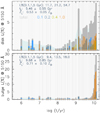 |
Fig. 6. Comparison of the SFH inferred with STARLIGHT for the bulge and disk of NGC 0776 (lower and upper panel, respectively). Vertical bars, color-coded according to stellar metallicity (open blue, dark blue, green, and orange for Z⊙/10, Z⊙/5, Z⊙/2.5, and Z⊙, respectively) show the contribution (in percent) of individual SSPs to the monochromatic luminosity of the continuum at 5150 Å. The sum of all SSP contributions at a given age is shown in gray. Thin vertical lines mark the (38) ages available in the SSP library we used (see BP18 for details). The labels in the upper left part of each diagram inform about the luminosity fraction of stellar populations younger than 0.1, 1, and 5 Gyr, as well as the light-weighted stellar age and metallicity. The bulge luminosity is dominated by old stellar populations, whereas more than 50% of the emission in the disk comes from stars younger than 5 Gyr. |
2.3. Effect of nebular emission on δio in local LTGs
The effect of nebular emission on broadband magnitudes and colors has been examined in several previous studies (Huchra 1977; Krüger et al. 1995; Izotov et al. 1997; Papaderos et al. 1998; Zackrisson et al. 2001; Anders & Fritze von Alvensleben 2003; Schaerer & de Barros 2009; Atek et al. 2011; Papaderos & Östlin 2012, among others)showing that it becomes important when the emission-line EWs rise above a few percent of the effective width of broadband filters. Because the EW(Hα) in the disks of centrally SF-quenched local LTGs (typically, iB and iC systems with log(ℳ⋆/M⊙) > 10.3) is generally low (< 40 Å; e.g., Kennicutt 1989; Catalán-Torrecilla et al. 2017; Belfiore et al. 2018; Breda & Papaderos 2018; Kalinova et al. 2021), nebular emission is practically negligible in the context of δio.
This can be illustrated again using NGC 0776 as an example. BPT line ratios place both the bulge and the disk of this galaxy in the locus of SF or composite sources (Fig. 7a). It may therefore be regarded as an example for a higher-mass LTG with an intermediate level of contamination (∼40%) of the Hα+[N II]6548, 6584 blend by nitrogen lines. Panel b shows the observed EW(Hα) versus the enhancement δμ(obs-fit) of the r magnitude due to nebular line emission (i.e., the difference between the magnitude of the observed spectrum and the stellar fit to it, as obtained by applying ℛ𝒴 for a tcut = 0). The low average EW(Hα) within individual isan (< 20 Å) translates into a negligible δμ, with the effect of nebular line contamination becoming appreciable (> 0.1 mag) only locally for a few individual spaxels in HII regions in which the EW(Hα) rises above 102 Å. A linear fit yields the relation δμ ≈ 0.74 r mag/kÅ, implying that nebular line emission does not notably enhance the surface brightness enhancement of the disk.
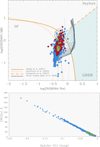 |
Fig. 7. Diagnostic emission-line ratios and photometric impact of nebular emission in NGC 0776. Upper panel: log([N II]6584/Hα) vs. log([O III]5007/Hβ) diagram. Single-spaxel determinations within RB and in the outer disk (red and blue, respectively) are shown with dots, whereas squares depict average values within isan. The locus that is characteristic of AGN and LINERs and the locus corresponding to photoionization by OB stars in SF regions are indicated with demarcation lines from Kauffmann et al. (2003, dotted curve), Kewley et al. (2001, solid curve), and Schawinski et al. (2007, dashed line). The grid of thin gray lines depicts the parameter space that can be accounted for by pure shock excitation, as predicted by Allen et al. (2008) for a magnetic field of 1 μG, and a range of shock velocities between 100 and 1000 km s−1 for gas densities between 0.1 and 100 cm−3. It is apparent that the diagnostic line ratios both for the bulge and outer disk fall close to the empirical envelope characterizing SF regions and in the locus of composite sources (i.e., between the curves by Kauffmann et al. and Kewley et al.). Lower panel: difference between the r-band magnitude of the observed spectrum and that of the stellar fit to it vs. EW(Hα) (Å) for individual spaxels (dots) and isan (squares). A linear fit (line) indicates that nebular line emission in this composite system enhances the r-band emission by ∼0.7 mag per 103 Å in EW(Hα). |
The situation is most certainly different in high-z proto-LTGs, where rest-frame EWs in the disk likely exceed several hundred Ångström and nebular emission may even dominate optical broadband magnitudes. If the early phase of bulge growth is driven by inward migration and coalescence of massive (108−9 M⊙) star-forming clumps emerging out of violent disk instabilities (Noguchi 1999; Bournaud et al. 2007; Elmegreen et al. 2008; Mandelker et al. 2014, 2017), then a strong δio in these systems could develop early on, within the theoretically estimated clump migration timescale τm of a few 108 yr. In addition to negative age and ℳ/ℒ gradients (BP18), a plausible expectation from clump migration is a bulge-to-disk EW contrast that develops as early as within the first 1 Gyr of galaxy evolution.
For example, an SF clump with Z⊙/20 forming at a radius ∼7 kpc and reaching the center of the galaxy after a τm∼700 Myr with a mean radial velocity of ∼9.8 km s−1 will experience a decrease in its EW(Hα) from initially ∼3 × 10³ Å to 60 (2) Å for an exponentially declining SFR with an e-folding time of 300 (100) Myr. The EW(Hα) excess of the disk relative to the bulge translates by the empirical relation from Fig. 7b into a surface brightness enhancement δμ0 (∼δio) of > 2 r mag. The temporal evolution of the EW(Hα) profile will of course depend on various factors, such as the fraction of clumps being massive enough to survive SF-driven feedback and reach RB as dynamically bound entities (Tamburello et al. 2017), the level of in situ SF in the bulge that is fed by inflowing intraclump gas (Hopkins et al. 2012), the dilution of emission-line EWs by the inwardly increasing stellar continuum, and the stellar metallicity.
If, on the other hand, bulge formation starts with a phase of dissipative gas collapse (wet compaction in the notation by Dekel & Burkert 2014), then a strong δio should first emerge once a high-Σ⋆ core surrounded by an outwardly propagating quenching wave (Tacchella et al. 2015) has developed. The radially evolving high-sSFR ring around the SF-quenched proto-bulge that is inferred from postprocessing of cosmological simulations in Tacchella et al. (2016) probably implies an inversion of negative to positive EW(Hα) gradients as the galaxy completes its wet compaction phase and enters the inside-out SFQ.
Studies with the JWST, ELT, and Euclid could address whether positive EW gradients in high-z galaxies emerge prior to or after the appearance of a high-Σ⋆ proto-bulge, thereby offering observational constraints on the relative role of clump migration and wet compaction during the early stage of bulge formation. Further valuable insights might be gained from high-resolution cosmological simulations incorporating a detailed treatment of nebular emission and its expected effect on radial color and EW profiles (e.g., Hirschmann et al. 2017).
A fact deserving special attention in bulge-disk decomposition studies of higher-z LTGs is that strong emission lines lead to a selective surface brightness enhancement of the disk (consequently, an increased δio) in various redshift intervals, depending on photometric filter. For example, the I-band surface brightness of the disk is elevated at z ≃ 0.17 because of contamination by the Hα line, with a second and third peak occurring at z ∼ 0.54 and ∼1.18 due to the [O III]4959, 5007 and [OII]3727, 29 lines. Similarly, the H-band surface brightness of the disk is enhanced by hydrogen Paschen lines at z ∼ 0.7 and by the Hα line at z ∼ 1.4.
The essential aspects of this issue were discussed in Papaderos & Östlin (2012). These authors have examined the influence of nebular emission on photometric studies of high-sSFR galaxies that consist of a high-surface-brightness stellar core and a more extended nebular envelope. Whereas these authors used the local blue compact dwarf (BCD) galaxy I Zw 18 to exemplify a high-z protogalaxy, where SF-feedback leads to extended nebular emission and the spatial decoupling of ionized gas from ionizing stellar clusters, their considerations also apply to any other source of energy and momentum surrounded by a nebular envelope, for example, quasars with a Lyα halo (e.g., Villar-Martín et al. 2007; Humphrey et al. 2013; Borisova et al. 2016; Wisotzki et al. 2016; Leclercq et al. 2020). They showed that the shift of various strong emission lines to filter transmission curves across z leads to a wide range of combinations of colors and a core-to-envelope color contrast δce. These, when interpreted in terms of purely stellar SEDs, or when ignoring the fact that the (stellar+nebular) SED of a galaxy varies with galactocentric radius, can prompt a variety of erroneous conclusions about the nature and evolutionary status of a higher-z galaxies. For example, as these authors remark, at 0.15 ≲ z ≲ 0.3, the large δce (∼0.8 mag) in V–I and moderately blue colors of the core (0.5 mag) superficially suggest an old disk hosting nuclear SF activity. The opposite conclusion would be drawn from the δce in B–V (∼0.5 mag), which could be taken as evidence for a young stellar disk encompassing a slightly older core. Likewise, in other zs, observed-frame colors together with an overall low δce could lead to the classification of a starburst galaxy as quiescent.
From Fig. 15 by Papaderos & Östlin (2012) is also apparent that nebular line contamination does not boost δio solely in narrow z-intervals that could easily be excluded from automated bulge-disk decomposition studies of large galaxy samples, but affects several broad windows in z, a fact requiring a careful treatment of this issue. It is also important that the selective enhancement of δio in these z-intervals, correspondingly an artificial dimming and reddening of the bulge relative to the disk (cf. Sect. 3), could affect the net (disk-subtracted) SED of the bulge such as to potentially mimic bulge growth in discrete major episodes at various z or might lend superficial support to a duality in the origin of bulges.
3. Effect of δio on photometric properties of bulges
Before turning to potential implications of δio on galaxy scaling relations (Sect. 4), we briefly discuss here its expected principle effect on determinations of photometric properties of bulges. Additionally, we show that it is in practice impossible to photometrically rule out the presence of a centrally SF-quenched disk beneath the bulge, and that numerous combinations of a centrally downbending disk (cf. Fig. 1, right) with a Sérsic profile for the bulge can adequately reproduce typical SBPs of local LTGs over their entire morphological spectrum, from bulge-dominated all the way to prima facie bulgeless systems.
3.1. Effect of a centrally quenched disk on luminosity determinations for the bulge
The range of δio estimated in Sect. 2 (up to ∼2.5 mag in B and ∼0.7 mag in K) translates into an overestimation of the disk below the bulge by a factor between ∼1.7 and ∼9. The underestimation of the bulge luminosity as result of the oversubtraction of the underlying disk depends on two competing factors, namely the δio itself and the luminosity ratio B/iD of the bulge to the inner disk. For this reason, a faint bulge residing in a disk with a low δio might be more affected than a prominent bulge in a fully SF-quenched disk with a high δio.
This can be illustrated by the example of a synthetic LTG (Fig. 8) that consists of an old bulge and a centrally SF-quenched disk. The B-band SBP of the bulge is approximated by a Sérsic profile,

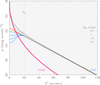 |
Fig. 8. Synthetic SBP of a galaxy that consists of a bulge (red; approximated by a Sérsic model) and a more extended disk (blue; approximated by the modexp function; cf. Eq. (4)). Inside the isophotal radius of the bulge at 24 mag/▫″ (RB = 20″), star formation quenching leads to a central dimming of the disk by 0.5 ≤ δμ0 ≤ 2 relative to the exponential fit for R⋆ ≥ RB (orange). The composite bulge+disk SBP for a δμ0 of 0.5 mag and 2 mag is shown with the dark and light gray curves, respectively. |
with μ0, B = 18 mag/▫″, β = 0 4 and η = 2.3, and the disk by the modified exponential (modexp) function proposed in Papaderos et al. (1996), which allows a depression of an exponential intensity profile inside a cutoff radius,
![$$ \begin{aligned} I(R^{\star }) = I_{\rm exp} \cdot \big [1-\epsilon _1\,\exp (-P_3(R^*))\big ] , \end{aligned} $$](/articles/aa/full_html/2022/02/aa40641-21/aa40641-21-eq8.gif)
where P3(R⋆) is defined as
The first term in Eq. (4) stands for the standard exponential law Iexp = I0 ⋅ exp(−R⋆/α), where I0 and α are the central intensity and angular scale length of an exponential profile, respectively. The modexp function involves two further parameters, namely the central intensity depression ϵ1 = ΔI/I0 relative to the exponential model, and the core radius Rc = ϵ2 ⋅ α within which the flattening occurs. The modexp was developed to approximate the underlying stellar host of local BCDs, for which indirect evidence for a central flattening exists (Papaderos et al. 1996; Noeske et al. 2003), similar to several normal and nucleated dwarf ellipticals (cf., e.g., Binggeli & Cameron 1993). This flexible functional form also permits simulating a centrally depleted disk profile (B20b)3.
Here, we adopt for the disk an (extrapolated) central surface brightness μ0, D = 21.6 mag/▫″, an α = 20″, and an ϵ2 = 1, meaning that the modexp profile deviates from the exponential law inward of one disk scale length. For simplicity, we assume that the cutoff radius (Rc ≈ 20″) roughly corresponds to the isophotal radius of the bulge at 24 B mag/▫″ (cf. Fig. 8). The depression parameter ϵ1 can be adjusted such as to simulate profiles with a central disk surface brightness being by δμ0 (mag) fainter than μ0, D. With the condition ϵ1 = dex(δμ0/−2.5)−1, this translates into an ϵ1 between 0.37 and 0.84 for 0.5 ≤ δμ0 ≤ 2.
The apparent magnitude of the bulge (14.27 mag) and the galaxy (12.8 mag) yield a B/T and bulge-to-disk (B/D) ratio of 0.26 and 0.35, respectively, which is in the range of typical values for local high-mass LTGs with log(ℳ⋆/M⊙) > 11 (e.g., Méndez-Abreu et al. 2017).
The superposition of a Sérsic with a modexp profile yields a good match to the SBPs of typical LTGs (e.g., de Jong & van der Kruit 1994; de Jong 1996a; Andredakis & Sanders 1994; Andredakis et al. 1995; Gadotti & dos Anjos 2001; MacArthur et al. 2003; Domínguez-Palmero et al. 2008; Martinsson et al. 2013; Erwin 2015; Erwin et al. 2021; Barsanti et al. 2021; Costantin et al. 2021). Quite importantly, it is in practice impossible to visually infer the presence of even a strong (δμ0 = 2) central down-bending in the disk from such a composite profile because the bulge dominates the line-of-sight intensity out to ∼RB/2 (see also B20b).
Figure 9 shows the net bulge emission that would be obtained by subtracting an exponential fit to the outer disk (> 20″) from the composite SBP in Fig. 8. This example, which essentially simulates the standard practice in 1D and 2D decomposition, illustrates that the deviation of the retrieved profile for the bulge from its true Sérsic form (red) increases with δio, with a tendency for a steepening within the bulge effective radius (Reff≈11″) and the appearance of a plateau at Reff≲ R⋆ ≲ RB.
 |
Fig. 9. Net emission of the bulge, as obtained by subtracting the inwardly extrapolated exponential fit to the visible outer disk at R⋆ > 20″ from the total (Sérsic+modexp) SBP in Fig. 8. |
Depending on the specifics of the fitting procedure (in particular, the error assigned to the inner points and corrections for the point spread function, PSF; cf. Sect. 4.1), the Sérsic model parameters for the bulge can be biased in various ways (Breda et al. 2019, for further remarks). For instance, fitting only its inner part (1 5 ≤ R⋆ ≤ Reff) would in the case of δμ0 = 2 mag yield an η ∼ 1.75, thus leading to the classification of the input classical bulge (η = 2.3) as a pseudo-bulge. Evidently, the luminosity of the bulge is increasingly underestimated with increasing δio (aka δμ0): the bulge apparent magnitude inside RB (14.64 mag) decreases to 14.75, 14.94, 15.09 and 15.21 for a δμ0 of 0.5, 1.0, 1.5 and 2.0 mag, respectively, which for the synthetic model under study translates into an error of up to 40%. Additionally, the underestimation of the luminosity of the bulge scales inversely to the bulge luminosity itself, consequently, the described bias is aggravated for intrinsically faint bulges (i.e., a low B/iD ratio)): if the simulated bulge in Fig. 8 were fainter by just one mag, then already a δμ0 = 0.5 (1.0) mag would result in the underestimation of its luminosity by 47% (84%)4.
Another insight from our foregoing remarks is that in the presence of SFQ, standard bulge-disk decomposition should lead to discrepant determinations of the bulge Sérsic η in different filters, in the sense of a positive correlation between η and central filter wavelength. This is because the effect of the oversubtraction of the star-forming outer disk on the net SBP of the bulge is stronger in the blue (because δio ∝λ−1; cf. Fig. 2). Together with the evidence from Fig. 9, this implies that the underestimation of Sérsic η decreases with increasing λ and becomes minimal in the NIR. Instead of attempting to eliminate this seeming discrepancy by forcing Sérsic model parameters to smoothly vary along λ according to an empirical functional form (e.g., Häußler et al. 2013; Vika et al. 2014), we might take advantage of it in order to obtain indirect constraints on δio and the true radial intensity profile of the disk below the bulge.
3.2. Bulgeless galaxies from the perspective of δio
The existence of bulgeless galaxies, that is, LTGs with a minor, if any at all, central luminosity excess above the disk (e.g., Kormendy et al. 2010; Coelho et al. 2013; Bizzocchi et al. 2014; Grossi et al. 2018) has triggered an intense controversy (e.g., Governato et al. 2010; Pilkington et al. 2011), given that these galaxies are not expected in the ΛCDM cosmology. In the light of our previous considerations, it is worth contemplating whether the conclusion that these systems lack a bulge of appreciable mass remains compelling. Figure 10 simulates an LTG with a B/T ratio of ∼0.1 through the superposition of the same modexp model for the disk as in Fig. 8 (blue) with a shallower Sérsic profile for the bulge (red) that is given by μ0, B = 22 mag/▫″, β = 10″ and η = 0.7. The composite SBP (gray curve) is a nearly perfect exponential over 6 mag in surface brightness. A fit for the outer disk severely underestimates the luminosity of the bulge (∼16.7 mag, i.e., 1.2 mag fainter than its true apparent magnitude of 15.5 mag), which now appears as a low-surface brightness (> 24 mag/▫″) core enclosing just < 4% of the total emission of the galaxy.
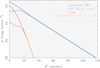 |
Fig. 10. Simulation of a seemingly bulgeless galaxy that consists of a faint bulge (red; B/T ratio ∼0.1) and an SF-quenched disk (blue) with δμ0 = 1 mag. The residual bulge emission after subtraction of an exponential model to the outer disk (R⋆ > 20″) is shown in orange. |
The main insight from Fig. 10 is that even a modest δio (δμ0∼1 mag) would comfortably allow a low-luminosity bulge to coexist with a centrally SF-quenched disk in a nearly perfect exponential composite SBP and evade detection with the standard bulge-disk decomposition technique. Although δio is mitigated in the I band and in the NIR, this alone does not warrant that a putative bulge can invariably be recovered in a bulgeless LTG because its detectability also depends on its luminosity (or the B/iD) and the core radius Rc = ϵ2 ⋅ α of the SF-quenched central zone of the disk (Sects. 3.1 and Appendix A.2).
3.3. Effect of a centrally quenched disk on color profiles within the bulge
Color gradients within RB may hold valuable clues to bulge formation and evolution. It is thus worthwhile to examine how they are influenced by the line-of-sight intensity contribution of the underlying disk, both in the presence and absence of SFQ.
For the sake of our discussion, we assume that the bulge in Fig. 8 has a constant B(Johnson)–R(Cousins) color of 1.54 mag, in agreement with predictions from PéGASE 2.0 (Fioc & Rocca-Volmerange 1997) for SFH3 and an age of ∼13 Gyr (cf. Fig. 2). The disk is approximated both in B and R by a modexp with the same α and cutoff radius (20″≡ RB), but a slightly different central intensity depression ϵ1, such as to obtain a δμ0 of 1 mag and 0.2 mag, respectively (upper panel of Fig. 11). These two SBPs yield a constant color of 0.74 mag (i.e., the value expected for SFH1 at the present age) outside the bulge that gradually rises inside RB to a central value of 1.54 mag, such as to simulate SFQ. The lower panel shows the color profiles resulting from superposition of the bulge with the disk when the latter is centrally SF-quenched, thus following a modexp profile, and in the case of no SFQ, that is, when the disk follows a purely exponential profile and has an overall constant B–R color of 0.74 mag.
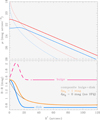 |
Fig. 11. Simulation of the radial surface brightness and color distribution for a centrally SF-quenched LTG. Upper panel: surface brightness profiles in B and R (blue and red, respectively) for the bulge and disk (thin and thick curves, respectively) for a synthetic galaxy with a constant B–R color of 1.54 mag in its bulge and 0.74 mag in its outer disk (R⋆ > RB = 20″). The disk is modeled by modexp profiles with a different central depression parameter ϵ1 in B and R such as to simulate a central SF quenching with a δμ0 = 1 mag in B and a color that smoothly increases inward of RB from 0.74 mag to 1.54 mag (cf. lower panel). Lower panel: true B–R color of the bulge (solid red line), true-color profile of the disk (blue), and observed color profile resulting from the superposition of the bulge and the disk in the case of SFQ (orange) and no SFQ (black). The dashed red curve shows the color profile that would be obtained for the bulge if the correction for the underlying disk were made by assuming a pure exponential (instead of a modexp) profile for it, that is, when SFQ is neglected. |
Regardless of whether the disk is centrally SF-quenched or not, the observed negative color gradient within RB (≃0.5 mag/RB) is purely a projection effect that is driven by the outwardly increasing line-of-sight contribution of the disk. Using this color gradient to place constraints on bulge evolution and demographics is obviously pointless. Without prior correction for the underlying disk, negative color gradients within RB cannot be interpreted in terms of a possible radial decrease in stellar age or metallicity within the bulge, and offer useful constraints on bulge formation and evolution. Unfortunately, a review of the rich literature about LTGs reveals only very few photometric studies acknowledging the influence of the disk on color gradients within the bulge (e.g., Head et al. 2014).
More generally, any superposition of evolutionary and spatially distinct stellar components results in (or alters existing) radial color gradients. One similar but reverse example is offered by blue compact dwarf galaxies: In their majority, these systems exhibit intense SF in the central part of an evolved (B − R ∼ 1 mag) stellar host. The interplay between the radially decreasing SFR surface density and the increasing line-of-sight contribution of the old underlying stellar component manifests itself in positive color gradients out to approximately two exponential scale lengths of the host. Papaderos et al. (2002) have shown that correction for the host can reduce the integral color of the starburst component by ∼0.5 B–R mag and change its radial color gradient by up to 1 mag kpc−1. Thus, modeling and subtracting the underlying host is crucial for a proper age dating of the young stellar component in these systems. Evidently, similar considerations apply to any other radially resolvable luminosity-weighted observable in a 3D geometry (EW, light-weighted age and metallicity, stellar velocity dispersion, Lick indices, and diagnostic emission-line ratios).
Next, we comment on the color profile that would be obtained for the bulge if a correction for the underlying disk were attempted on the standard assumption that the intensity of the latter follows a purely exponential instead of a modexp profile. The color profile obtained in this way is overestimated throughout within the bulge, reaching at Reff ≃ RB/2 (11″) a maximum deviation of +0.5 mag from the true color. A correction of bulge color profiles (or color maps) for the underlying disk without taking SFQ into account (i.e., assuming a purely exponential model for the disk) leads to an increasingly overestimated color with increasing δio. This is better illustrated in Fig. 12, where we plot the observed and disk-corrected color profile (solid and dashed curves, respectively) for a δμ0 between 0 mag (no SFQ) and 2 mag. As δμ0 increases, the color gradient at RB/2 ≲ R⋆ ≲ RB steepens from −0.35 mag/′RB for δμ0 = 0 mag (black) to −0.76 mag/RB for δμ0 = 2 mag (red). The disk-corrected color of the bulge is overestimated for any δμ0 > 0 mag, exhibiting around Reff a broad excess by 0.2 mag (δμ0 = 0.5) and up to 0.9 mag (δμ0 = 2).
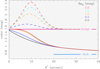 |
Fig. 12. Central part of B–R color profiles for the composite (Sérsic+modexp) galaxy model in Fig. 11 for a δμ0 between 0 and 2 mag (solid curves). Dashed curves show disk-corrected color profiles computed on the standard assumption that the disk follows an exponential profile all the way to its center. The true color of the bulge (1.54 mag) and of the outer disk (R⋆ > RB; 0.74 mag) are depicted by the horizontal lines. |
Summarizing, negative color gradients within galaxy bulges can be entirely due to the outwardly increasing line-of-sight contribution of the underlying disk, both in the absence and presence of SFQ. In the case of a centrally SF-quenched LTG, correction for the disk using an inadequate model for its radial intensity (i.e., a purely exponential profile with constant color) leads to a local and global overestimation of the color of the bulge, in particular, to an artificially red circumnuclear zone that could be taken as evidence for enhanced dust obscuration. Additionally, the oversubtraction of the blue SED of the disk can lead to an abnormally red SED for the bulge and drive spectrophotometric bulge-disk decomposition studies toward an exceedingly high age and metallicity (B20b). This is particularly true for LTGs at redshift intervals where δio is enhanced by nebular line emission in the disk (cf. Sect. 2.3).
4. Discussion
The goal of this study is to draw attention to the implications of SFQ for structural studies of galaxies and motivate an exploration of this hitherto uncharted territory. Extending our discussion in Sect. 3, in the following we point out that the neglect of δio can introduce complex biases with considerable relevance to our understanding of the formation history and demographics of galaxy bulges (Sect. 4.1) and that these biases are not simple to overcome because they impact structural studies differentially, depending on galaxy mass and redshift (Sect. 4.2). In particular, the neglect of δio might appreciably affect the scatter and slope of galaxy scaling relations (Sect. 4.3), which calls for a closer observational and theoretical examination of this effect and for the development of empirical approaches for its correction in a statistical sense. Possible routes toward this goal are discussed in Sect. 4.5.
4.1. Principle photometric biases due to the neglect of δio
As discussed in Sect. 3, the neglect of δio in dedicated bulge-disk decomposition studies can result in biased determinations of the photometric properties of galaxy bulges. Expected effects include (a) a systematic underestimation of the luminosity of the bulge in a manner that is inversely related to its prominence (specifically, the B/iD ratio) and proportional to the degree (δμ0) and radial extent (Rc = ϵ2 ⋅ α) of SFQ, and (b) a potential underestimation of the Sérsic exponent η. The latter entails an overestimation of the model-dependent effective radius of the bulge (because Reff is by definition inversely related to η; e.g., Trujillo et al. 2001), consequently also an underestimation of the mean stellar velocity dispersion σ⋆ therein. In practice, the adopted value for σ⋆ will depend on aperture corrections (e.g., Davies et al. 1987; Jørgensen et al. 1995; Ziegler & Bender 1997; Jablonka et al. 2007) which in turn require assumptions on the SBP of the bulge. The underestimation of η likely results in a tendency for the classification of moderately luminous classical bulges as pseudo-bulges on the basis of the commonly adopted empirical cutoff at η ∼ 2. Finally, as previously shown, the neglect of δio can result in the erroneous classification of low-B/D LTGs as bulgeless disks.
Whereas it is plausible that any galaxy decomposition scheme that lacks a relevant structural component or adopts an inadequate functional form for it can entail a bias, quantitative predictions on the concrete implications of this for a multicomponent bulge-(bar)-disk fit that involves multiple nonlinearly coupled free parameters is not straightforward. This is particularly true when photometric uncertainties, hence the statistical weights that largely guide the best-fitting solution, happen to correlate with evolutionary patterns in galaxies (colors, sSFR, and emission-line EWs). This is precisely the case in LTGs: because the S/N scales with the surface brightness (or Σ⋆), the highest weight is given to the SF-quenched core (R⋆ ≲ RB), that is, the radial zone showing the strongest negative color and age gradients simultaneously with the steepest positive sSFR and EW(Hα) gradients (cf., e.g., Balcells & Peletier 1994; Gadotti & dos Anjos 2001; Catalán-Torrecilla et al. 2017; Belfiore et al. 2018; Breda et al. 2020a). A further complication stems from the fact that this core is most affected by PSF smearing, which can propagate into further uncertainties in the Sérsic fit for the bulge (see the discussion in Breda et al. 2019).
How the interplay between these factors is imprinted on the best-fitting solution is not immediately clear. For instance, the scaling of photometric errors inversely to surface brightness can result in an artificial compaction of the disk (underestimation of its α and overestimation of its μ0), which in turn translates into an underestimation of B/iD (the disk luminosity fraction inside RB) and could bias the Sérsic model parameters for the bulge (Papaderos et al. 1996). The neglect of a possibly present bar poses a further complication (cf., e.g., Méndez-Abreu et al. 2008, BP18); this is especially true for higher-mass LTGs because the bar prominence increases with LTG luminosity (Bittner et al. 2017; Gadotti et al. 2020). Moreover, small-scale features such as nuclear rings (Buta & Combes 1996; Comerón et al. 2010) or nuclear disks (Bittner et al. 2020) or double bars (de Lorenzo-Cáceres et al. 2019) may have an influence given their high surface brightness (and weight in the fit).
It is thus conceivable that the neglect of δio is largely responsible for the fact that bulge-disk decomposition solutions in different bands are frequently mutually inconsistent or untenable from the evolutionary point of view. For instance, dos Reis et al. (2020) report several cases of formally (in terms of χ2) irreproachable fits with GALFIT (Peng et al. 2010) that translate into unphysical colors for the bulge and disk when the best-fitting solution is extrapolated beyond R⋆ ≳ Reff, however. As remarked in Sect. 3.1, forcing the Sérsic exponent η to vary smoothly across λ according to an ad hoc functional form might offer a remedy, but no solution to the problem.
An important step forward would be to empirically examine in synthetic multiband galaxy images how the neglect of SFQ is imprinted on determinations of structural properties of bulges (η, Reff, μeff, total magnitude MB). To this end, standard bulge-disk decomposition into a Sérsic and a purely exponential model would need to be applied to synthetic galaxies whose disk is given by a modexp or other functional forms (e.g., a variant of the five-parameter core-Sérsic profile; Graham et al. 2003; Trujillo et al. 2004; Bonfini 2014), possibly with the addition of a Ferrers (1877) component approximating a bar. In addition to a grid of models that densely cover possible configurations of a central flattening or downbending of the disk inside the bulge (i.e., the ϵ1, 2 parameters of Eq. (5)), this task should ideally include the radially varying contribution of nebular emission to broadband SBPs in different evolutionary stages of an LTG (Sect. 2.3).
4.2. Galaxy downsizing and the differential nature of δio
The factor δLB by which the luminosity of the bulge is underestimated due to the neglect of δio depends on two competing but interrelated factors, namely the δio itself and the luminosity fraction B/iD of the bulge inside RB. For the sake of simplicity, we assume that B/iD roughly scales with B/T (however, see Sect. 4.4).
Some qualitative predictions can be made from empirical insights and plausibility arguments. A reasonable expectation is that δio affects determinations of photometric and structural properties of bulges differentially, that is, in a manner that at a given age scales inversely with galaxy mass ℳ⋆.
From the perspective of galaxy downsizing (Cowie et al. 1996), the formation timescale of galaxies is anticorrelated with ℳ⋆, with the dominant phase of their build-up being delayed to a lower z as ℳ⋆ decreases (staged galaxy formation; Noeske et al. 2007). Manifestations of this phenomenon include the inverse relation between ℳ⋆ and burst parameter or EW(Hα) in BCDs (Salzer et al. 1989; Krüger et al. 1995), and the anticorrelation between ℳ⋆ (or Σ⋆) and various proxies to the ongoing and average past SF activity, such as EW(Hα) or SFR/< SFR> (Brinchmann et al. 2004), mass doubling time (Noeske et al. 2007) and luminosity-weighted age (Gallazzi et al. 2005). The advent of wide-field IFS helped to better recognize that an analogy to downsizing on galactic scales exists on subgalactic scales (subgalactic downsizing, in the notation by BP18) in the sense that the formation timescale of stellar populations is anticorrelated with their mean Σ⋆: As documented by several recent studies, the dense galaxy centers assemble first and is followed by a prolonged, still ongoing build up of their periphery (e.g., Pérez et al. 2013; Fang et al. 2013; González-Delgado et al. 2014; Gomes et al. 2016b), as also shown from UV observations in Muñoz-Mateos et al. (2007), Salim & Rich (2010), Salim et al. (2012), and Gil de Paz et al. (2007), for instance. In the specific context of LTGs, this trend is echoed by the increasing bulge-to-disk age contrast with increasing ℳ⋆, for example, or by the radially increasing luminosity contribution of stellar populations of intermediate-to-young age (Sect. 2.2).
This (sub)galactic downsizing may be simulated with delayed SFH scenarios (Fig. 13) that yield a zero-order approximation to a ℳ⋆-dependent formation history for bulges in the three LTG classes tentatively defined in BP18: Similar to Fig. 2, the disk outside the bulge is assumed to form continuously with a constant SFR, whereas the SFR of iC, iB, and iA bulges is approximated by models involving an SFR that reaches its maximum at 0.47, 1.2, and 2.4 Gyr, respectively, and then exponentially declines with an e-folding time that scales inversely with ℳ⋆. As in Fig. 2, nebular emission is taken into account and a constant metallicity of Z⊙ (Z⊙/5) is assumed for the bulge (disk). The lower panel of Fig. 13 shows the evolution of δio in the B and R band for the three scenarios. δio becomes positive after 1–3 Gyr, as SF and nebular contamination gradually cease in the bulge and its ℳ/ℒ rises above that of the outer disk, and then smoothly increases to its present value of ≳2 B mag and 1.5 R mag.
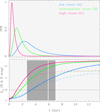 |
Fig. 13. Mass-dependent SFH of bulges and resulting evolution of δio for a galaxy downsizing scenario. Upper panel: SFR parameterizations simulating a downsizing trend for galaxy bulges by assuming that their age at the peak of their SFR and their SF e-folding timescale inversely with ℳ⋆. High-, intermediate-, and low-mass bulges (iC, iB, and iA, respectively, in the classification by BP18) reach their maximum SFR at 0.47, 1.2, and 2.4 Gyr. Lower panel: evolution of δio (approximated by 2.5 ⋅ log(ψ), as in Fig. 2) in the B and R band (solid and dashed curves, respectively) for the three SFH scenarios for the bulge (upper panel) when a constant SFR for the outer disk is assumed. The shaded gray area depicts the redshift interval 0.76 ≤ z ≤ 2.3 that will be covered both by the MOONS spectrograph at VLT (0.65–1.8 μm) and the B-band filter (∼0.37–0.54 μm). The amplitude of δio at z ∼ 1 (vertical white line) depends on galaxy mass. It is moderate (∼0.85 B mag) for low-mass (< L⋆) galaxies and reaches ∼2 mag for massive LTGs in advanced stages of SF quenching. |
An insight from this simplified parameterization of galaxy downsizing is that δio increases faster for massive LTGs and vice versa. Taking the evidence from Fig. 13 at face value, at z ∼ 1 (vertical line; roughly at the onset of the decline of the cosmic SFR density; cf. Madau & Dickinson 2014), massive galaxies in an advanced stage of SFQ have developed a δio that is higher by > 1 mag than low-mass galaxies that still sustain a significant level of SF in their bulges. The gap between the two gradually shrinks to less than 0.7 B mag since only ∼4 Gyr ago (z ∼ 0.36).
The key implication is that (the neglect of) δio does not just add a scatter to any galaxy scaling relation that involves bulge luminosities, but affects its slope to a degree that depends both on galaxy mass and z. This calls for caution when (magnitude- or mass-selected) galaxy samples spanning a range in redshift are jointly analyzed with a focus on the structural and photometric evolution of their bulge.
For example, in the spectral range covered by the multi-object spectrograph MOONS at VLT (0.65–1.8 μm; Cirasuolo et al. 2020), single-fiber spectroscopy can be supplemented by bulge-disk decomposition in the restframe B-band at 0.76 ≤ z ≤ 2.3 (shaded gray area in Fig. 13). Within this interval, δio shows roughly the same increase for all LTGs (∼1.3 mag), but its value at z = 1 is nearly three times higher for massive (iC) galaxies (2.2 mag) than for low-mass (iA) galaxies (0.85 mag). Therefore, photometric corrections adopting an average value for δio are inadequate for compensating for the effect of SFQ. Star formation quenching obviously has a broader range of implications for fixed-aperture spectroscopic surveys (we refer to several previous studies addressing aperture effects from various viewpoints, e.g., Hopkins et al. 2003; Brinchmann et al. 2004; Iglesias-Páramo et al. 2013, 2016, and references therein). In particular, Gomes et al. (2016c) have shown that for a model of inside-out galaxy growth (or SFQ) that reproduces the size of local early-type galaxies, the 3″ aperture of the SDSS misses a progressively large portion of the outer star-forming zone for z < 1. This leads to a severe underestimation of their total SFR and their incorrect classification as “retired” on the basis of the spectroscopic classification by Stasińska et al. (2008). With regard to the upcoming MOONS, the spectroscopic fiber (⌀ = 1″) will map a projected area of ∼8 kpc at z ∼ 1, therefore encompassing at least parts of the star-forming outer disk both for high-mass centrally SF-quenched and lower-mass star-forming galaxies. One implication of this is that dilution of AGN-specific emission-line diagnostics by the star-forming disk will be stronger in massive quenched galaxies because nebular emission within their bulges is weaker. This effectively entails a detection bias against jet-mode AGN because these are predominantly hosted by SF-quenched, virtually gas-devoid stellar spheroids (Kormendy & Ho 2013; Heckman & Best 2014) with a high Lyman-continuum photon escape fraction, hence weak nebular emission (Papaderos et al. 2013; Gomes et al. 2016a).
Quantitative inferences based on the fractional underestimation of the bulge luminosity δLB have to await detailed studies of δio and B/iD (Sect. 4.5). Nevertheless, it is reasonable to assume that δLB scales inversely with ℳ⋆, being low in massive iC LTGs (log(ℳ⋆/M⊙) > 10.7) and comparatively high in intermediate-ℳ⋆ (log(ℳ⋆/M⊙) ∼ 10.5) iB LTGs. This is because the former, although having developed the highest δio (Fig. 13), typically host prominent bulges, which implies a high B/iD. These two factors likely counterbalance each other, effectively reducing δLB. Intermediate-mass LTGs, on the other hand, at the same time combine a significant δio with a modest B/iD, which likely acts toward raising their δLB. Finally, low-mass LTGs (iA) show a comparable level of SF in their centers and disk periphery, thus a generally low δio, as is also apparent from their low bulge-to-disk age contrast (cf. BP18) and flat age gradients within RB (B20a). This is also consistent with their BPT classification in the locus of SF regions, which suggests the absence of strong AGN activity as a possible agent of inside-out SFQ. Notwithstanding this fact, because of the faintness of their bulge (i.e., very low B/iD), even a small δio could raise δLB and even prevent detection of their bulge (Fig. 10). Based on these considerations, we expect δLB in the low-mass end of the LTG sequence to show a large dispersion around a generally low median value.
4.3. Effect of δio on the scatter and slope of fundamental scaling relations
A closer investigation of δio is of considerable interest also because correction for this effect in galaxy decomposition studies will likely influence the scatter and slope of some galaxy scaling relations, eventually opening new prospects for improving our understanding of bulge evolution and demographics. Because this correction will increase the bulge luminosity and probably also the Sérsic η, it will move some previously categorized pseudo-bulges into the locus of classical bulges, possibly leading to sharper observational photometric discriminators for bulge classification. For instance, it is imaginable that the failure to establish η as a robust bulge classification means, despite several efforts over the past three decades (e.g., Neumann et al. 2017, for a recent review), partly stems from the neglect of δio (Sect. 3.1). Furthermore, the expected increase in the parametric (Sérsic model-dependent) effective surface brightness, effective radius, and σ⋆ therein could be relevant to for example for the Kormendy (1977) relation (see also Kormendy & Djorgovski 1989 and Ziegler et al. 1999) and for the Faber & Jackson (1976) relation for bulges, as well as for any relation contrasting structural characteristics of bulges (e.g., η, Reff, μeff, MB) with, for example, the α4 parameter (Fabricius et al. 2012), ellipticity, concentration index, velocity anisotropy, and nonthermal radio power. Furthermore, because disk-dominated LTGs are more affected by δio than bulge-dominated early-type galaxies, it might naturally be expected that bulges in these two galaxy classes describe slightly different slopes in various scaling relations.
The principle effect of accounting for δio might be illustrated with the example of the ℳ∙-bulge relation (e.g., Magorrian et al. 1998; Ferrarese & Merritt 2000) in which the bulge mass is commonly approximated by its absolute K-band magnitude or mean σ⋆ within Reff. This relation is fundamental to our understanding of the regulatory role of AGN in galaxy evolution, as also reflected in the fact that deviations from the average ratio ℳ∙/ℳ⋆ ≈0.002 (Heckman & Best 2014) are regarded as signatures of distinct evolutionary routes in the coevolution of SMBHs and galaxy spheroids. For example, Kormendy et al. (2011) studied a sample of CBs (high-luminosity, pressure-supported bulges), PBs (intermediate-luminosity bulges with significant rotational support), and bulgeless disks, all having direct kinematical determinations of their ℳ∙. These authors find that similar to ellipticals, CBs obey the bulge versus ℳ∙ relation, whereas PBs and bulgeless galaxies show a large scatter or systematic deviations from it (however, see Bennert et al. 2021). Five of the 11 PBs included in this study are indeed overluminous by 1–2 K mag for their ℳ∙.
A correction for δio could enhance the luminosity of bulges by a factor  (cf. Sect. 4.2), which would have a greater effect for PBs than for CBs and would lead to a down-bending of the bulge-ℳ∙ relation below log(ℳ⋆/M⊙) ∼ 10.7, as sketched in Fig. 14. From the perspective of the standard scenario (Kormendy & Kennicutt 2004, for a review), this down-bending could be taken as supportive evidence for the prevailing view that CBs and PBs are evolutionary distinct, with the former showing an affinity to massive stellar spheroids that form early on and experience a synchronous growth with their SMBH, whereas the latter primarily resulting from rearranged disk material that piles up into a central luminosity excess in the course of the secular evolution of disk-dominated galaxies.
 |
Fig. 14. Schematic sketch of the relation between SMBH mass ℳ∙ and absolute magnitude of the bulge MB, with the solid diagonal line depicting the commonly adopted mean ratio ℳ∙/ℳ⋆ ≈ 0.002 (cf., e.g., Heckman & Best 2014) and the dashed line its expected change after correction for the δio effect. Arrows in the upper part point to the amplitude of δio and the expected fractional under-estimation of the bulge luminosity δLB for the three LTG classes proposed in BP18. Bulgeless, pseudo-bulge, and classical-bulge galaxies may loosely be associated with type iA, iB, and iC LTGs in the mass intervals log(ℳ⋆/M⊙) < 10.3, ∼10.5, and > 10.7, respectively. Whereas δio increases with ℳ⋆, its effect on δLB is likely comparatively small for high-mass LTGs because of the prominence of their bulges, while it is expected to increase for intermediate-mass LTGs that simultaneously show a significant δio and a modest B/D ratio. We expect δLB for low-mass LTGs to show a large scatter around a low median value because of their very low δio and B/D ratio. |
Alternatively, a down-bending of the bulge-ℳ∙ relation for sub-L⋆ galaxies could strengthen the conclusion by Heckman & Best (2014, their Fig. 9b) that ℳ∙ is not a fixed fraction of ℳ⋆ but decreases from a mean ℳ∙/ℳ⋆ ratio of 10−2.5 at ℳ⋆ ∼ 1011.5 M⊙ to ∼10−4 at ℳ⋆ ∼ 1010 M⊙. Furthermore, a dependence of the ℳ∙/ℳ⋆ ratio on ℳ⋆ would be consistent with the scarcity or weakness of accretion-powered nuclear activity in low-mass LTGs (Kormendy & Ho 2013, see also BP18).
Summarizing, in the light of our considerations above, a correction of bulge magnitudes for δio appears to be fundamental for sharpening observational constraints on the intrinsic scatter of the bulge-ℳ∙ relation (e.g., Gültekin et al. 2009) and the possible dependence of its slope on ℳ⋆ (Fig. 14) or galaxy morphology (e.g., Sahu et al. 2020)
4.4. Combined effect of δio with a possible central depletion of the disk
Our foregoing considerations are based on the conservative assumption that the stellar surface density Σ⋆(R⋆) of the disk is exponential all the way to its center and the central flattening or down-bending of its SBP is solely due to a higher ℳ/ℒ inside the SF-quenched bulge. However, the exponentiality of Σ⋆ is not for granted. Theoretical work points to a central depletion of the disk (Kuijken & Dubinski 1995; Obreja et al. 2013; Widrow & Dubinski 2005; Du et al. 2020) although little is quantitatively known on its possible connection to ℳ⋆ and other galaxy properties (e.g., angular momentum, presence of an AGN). As an example, Obreja et al. (2013) find from hydrodynamical simulations a steep decrease in the disk’s Σ⋆ by ∼2.5 dex within R⋆ ∼1 kpc (∼1/2 RB).
Circumstantial observational support for a central depletion in the disk comes from recent work by B20b. These authors showed that the stellar SED of the outer disk, if scaled to the light fraction implied within RB by inward extrapolation of a purely exponential model and then subtracted from the integrated spectrum therein, yields an unphysical (negative) or implausible net stellar SED for the bulge. The latter was deemed to be the case when the disk-corrected SED for the bulge is abnormally red, which would force spectral synthesis models to converge to the maximum possible age and metallicity allowed by the construction of the SSP library used, or yield for the net-bulge a ℳ⋆ that exceeds the value obtained by fitting the integrated SED within RB. These authors also tested the effect that a modexp model for the disk would have on the net SED of the bulge. They showed that models with a central flattening reduce the percentage of implausible solutions to 15%, whereas a down-bending of the disk to a central intensity of 0 (i.e., a modexp with ϵ1 = 1, cf. Eq. (4)) in all cases yields an acceptable spectral fit. We recall that the first modexp model (centrally flat exponential profile) can be accounted for by a modest δio, whereas the second model (ϵ1 = 1) cannot just be due to a variation in the ℳ/ℒ ratio, but requires a central evacuation of the disk. Because the pilot study by B20b has considered only these two modexp profiles, it was unable to pinpoint the form of the inner disk below the bulge or place constraints on the relative importance of δio and a possible central decrease in Σ⋆. For instance, it is conceivable that a δio at the upper range of estimated values (∼2.5 B mag) could alleviate the need for a strong central reduction of Σ⋆. It is also important to bear in mind that modexp is a functional form developed in another context (dwarf galaxies) and may not be optimal for galactic disks.
Star formation quenching and a central depletion of the disk are presumably nonmutually exclusive phenomena, and both imply an upward revision of the luminosity of the bulge. A step forward toward their better understanding might be possible through spectrophotometric and kinematical decomposition of IFS data (e.g., by extending the method by B20b by a dense grid of modexp models for 0 ≤ ϵ1 ≤ 1, or other functional forms that allow for a centrally depressed exponential disk). A combined analysis of observational constraints gained from this task with galaxy simulations that incorporate detailed prescriptions for SFQ as well as Schwarzschild orbital superposition modeling (e.g., Zhu et al. 2018a,b; Du et al. 2020; Jagvaral et al. 2022) would be of considerable interest.
4.5. Approaches toward an empirical correction of δio
Because the δio effect is a direct and causal consequence of star formation quenching, understanding it is almost tautologous to the understanding of spiral galaxy evolution, including the physical drivers, timescales, and spatial characteristics of inside-out cessation of SF. Elucidating this subject in its broad complexity is clearly a long-term endeavor. For this reason, it appears worthwhile to explore empirical recipes that could permit an approximate short-term a posteriori correction of the large existing body of photometric quantities for bulges from previous galaxy decomposition studies. Ideally, such corrective formulae should involve easily accessible observables (e.g., EWs, colors) or quantities inferred from spectral modeling (bulge-to-disk age contrast, ⟨δμ9G⟩). This task can presumably only be achieved in a statistical sense: The rich variety of substructures in the central parts of LTGs (nuclear disks and rings, single- and double-bars, barlenses; cf., e.g., Bittner et al. 2017; de Lorenzo-Cáceres et al. 2019; Laurikainen et al. 2018; Gadotti et al. 2020) together with the significant scatter (∼1.7 Gyr/RB) of stellar age gradient determinations therein (B20a) document a diversity in the biography of individual systems.
The development of such a rectification concept will most likely require determination and suppression of δio in a large, representative sample of local LTGs in conjunction with multiband photometric analyses of simulated galaxies in various stages of SFQ with the goal of elaborating empirical constraints on the impact of δio on bulge-disk decomposition (Sect. 4.1). The first task could exploit image processing (e.g., unsharp masking), and SED fitting of spatially resolved data in combination with an age-slicing tool like ℛ𝒴.
(a) One possibility is to mask or bidimensionally subtract spiral features prior to bulge-disk decomposition. This has been done in detailed studies of small galaxy samples in order to stabilize the initial guess on ellipticity and center (cf. the iterative technique by Méndez-Abreu et al. 2008). While feasible, such an approach requires careful interactive work and thus appears impractical for automated studies of large galaxy samples. Machine-learning-supported suppression of nonaxissymmetric features might be an alternative, but would require training on local galaxy samples, which could turn into a disadvantage for studies of irregular clumpy galaxies at a higher z. An additional concern is that high-contrast grand-design spiral features are generally prominent in massive LTGs, whereas lower-mass spirals tend to be flocculent and to show low-contrast spiral patterns (e.g., Bittner et al. 2017). This could result in a bias against lower-mass LTGs, especially when studying higher-z samples with PSF-degraded imaging data. Another limitation of this approach is that it is hardly suitable for suppression of diffuse ionized gas (DIG) and intraspiral arm emission from moderately evolved (∼200 Myr) stellar populations that experience significant evolution in their ℳ/ℒ over a galaxy rotation period. The DIG, although faint (EW(Hα) < 6 Å), can contribute up to ∼50% of the total Hα luminosity of star-forming galaxies (Ferguson et al. 1996; Weilbacher et al. 2018; den Brok et al. 2019).
(b) NIR photometry allows for the reduction of δio by a factor ∼3 (cf. Sect. 2.1), but it is prone to contamination by the nebular continuum (e.g., Krüger et al. 1995). On the other hand, thanks to the rapidly increasing amount of NIR data with an adequate resolution (e.g., with VISTA and soon Euclid), it offers important prospects for the suppression of δio in low-z galaxy samples.
(c) Another possible approach could take advantage of ℛ𝒴 (Sect. 2.2) to suppress the excess emission from the star-forming outer disk and obtain an estimate on the size and intensity profile of the SF-quenched core (i.e., the ϵ1, 2 parameters of Eq. (5)). Limitations of this approach stem from uncertainties in population spectral synthesis (Gomes & Papaderos 2016; Breda & Papaderos 2018, for a discussion), its high computational expense, and the requirement for an objective definition of the optimal tcut for a galaxy.
(d) A complement to the aforementioned methods could involve bulge-(bar)-disk decomposition of stellar surface density (instead of surface brightness) maps (Lang et al. 2014, see also Wuyts et al. 2012). In this regard, the availability of spatially resolved, low-resolution (R ∼ 60) SEDs from Javalambre Physics of the Accelerating Universe Astrophysical Survey (J-PAS; Moles et al. 2011; Bonoli et al. 2021) opens a promising avenue.
Despite their advantages and disadvantages, a combination of the approaches above could yield statistical estimates of δio as a function of ℳ⋆ and B/D ratio and might support the refinement of various spectrophotometric decomposition concepts proposed recently (e.g., Johnston et al. 2012, 2017; Tabor et al. 2017, 2019; Méndez-Abreu et al. 2019; Breda et al. 2020b; Barsanti et al. 2021). A correction for δio could also help provide accurate 2D ℳ/ℒ and Σ⋆ maps needed for advanced Schwarzschild orbital decomposition and foster synergy between theory and observations toward a better understanding of the star formation quenching phenomenon.
5. Summary and conclusions
The aim of this study was to draw attention to the implications of star formation quenching (SFQ) for bulge-disk decomposition studies of late-type galaxies (LTGs) and motivate further observational and theoretical work in this field. The standard practice of bulge-disk decomposition is to fit and subtract an exponential model to the disk (more specifically, to its visible periphery outside the bulge) in order to isolate the net luminosity of the bulge. Regardless of whether the modeling of disk and bulge is done sequentially or simultaneously or in 1D or 2D, the key assumption in all cases is that the inwardly extrapolated fit to the outer disk faithfully reproduces the radial intensity profile in its observationally inaccessible inner zone, below the bulge.
However, this postulate would only be valid if the star formation history (SFH) and specific SFR of the disk were spatially invariant, which is irreconcilable with the well established fact of SFQ inside the bulge radius RB of massive (≳L⋆) LTGs. A central depression of star formation (SF) implies a higher ℳ/ℒ ratio for the inner SF-quenched disk (R⋆ < RB) than for the SF-enhanced outer disk (R⋆ > RB). For this reason, the inwardly extrapolated exponential model must lead to an overestimation (and oversubtraction) of the disk inside RB, consequently to a systematic underestimation of the luminosity of the bulge. We refer to the difference between the true magnitude of the disk inside RB and the value implied by the exponential fit for the outer disk as δio (≥0 mag). This quantity can be approximated by the difference δμ0 between the true and extrapolated central surface brightness of the disk, or as 2.5⋅log(ψ), where ψ denotes the ratio of the mean ℳ/ℒ of the disk inside and outside RB.
(i) We showed that if the bulge and the inner disk share roughly the same SFH, then δio in present-day LTGs can reach 2.5 mag in B and 0.7 mag in K. This was demonstrated with evolutionary synthesis models involving continuous SF in the outer disk and an exponentially decreasing SF with an e-folding time of 0.5 and 1 Gyr within RB. These estimates remain valid for SFH scenarios that simulate a downsizing trend, with bulges in massive galaxies experiencing the dominant phase of their formation early on and vice versa. Additionally, observational support for a δio well in excess of 1 g-band mag is provided through post-processing of spatially resolved spectral synthesis models for local LTGs with the age-slicing tool REMOVEYOUNG (Gomes & Papaderos 2016), extending previous work in Breda & Papaderos (2018).
(ii) In the presence of SFQ, the exponential surface brightness profile (SBP) of the disk should show a central flattening or down-bending inside the radius of the bulge. A suitable functional form for such an SBP is given by the modified exponential (modexp) distribution proposed in Papaderos et al. (1996).
(iii) It is pointed out that the neglect of δio in dedicated bulge-disk decomposition studies can result in biased determinations of the photometric and structural properties of galaxy bulges. Expected effects include a) a systematic underestimation of the luminosity of the bulge in a manner that is inversely related to its prominence and proportional to the degree of SFQ (aka δio), and b) a potential underestimation of the Sérsic exponent η. The latter entails an overestimation of the model-dependent effective radius of the bulge (because Reff and η are inversely related to each other), and consequently also an underestimation of the mean stellar velocity dispersion σ⋆ therein. These biases likely lead to a tendency for the classification of moderately luminous classical bulges as pseudo-bulges on the basis of the commonly adopted empirical cutoff at η ∼ 2. Additionally, we showed that the neglect of δio can readily result in the erroneous classification of low-B/D LTGs as bulgeless disks.
(iv) Negative color gradients within the bulge can entirely be due to the outwardly increasing line-of-sight intensity contribution of the blue star-forming disk. This applies both to centrally star-forming and SF-quenched disks. For this reason, correction for the underlying disk (which, in turn, requires an understanding of δio) is crucial for a meaningful study of color gradients in LTG bulges and the evolutionary clues these may hold. If such a correction is attempted assuming a purely exponential SBP for the disk, then the net color of the bulge is invariably overestimated. This chromatic bias is aggravated by red rims that can be taken as evidence for dusty circumnuclear SF rings.
(v) From a synopsis of insights from this study and existing observational and theoretical evidence, it is pointed out that massive LTGs develop a high δio early on because their centers quench first, whereas lower-mass LTGs experience a retarded evolution that leads to a slower rise of δio with time. This differential evolution of δio across galaxy mass (ℳ⋆) can lead to complex biases when galaxy samples spanning a range in redshift (z) or ℳ⋆ are structurally analyzed and compared with each other, and propagate into errors in the scatter and slope of any galaxy scaling relation that involves photometric quantities for bulges. As an example, we argued that correction for δio might lead to a down-bending of the bulge versus supermassive black hole mass ℳ∙ relation below log(ℳ⋆/M⊙) ≲ 10.7. A decrease of the ℳ∙/ℳ⋆ ratio with decreasing ℳ⋆ would offer an element toward understanding the virtual absence of accretion-powered nuclear activity in low-mass spiral galaxies.
(vi) The above conclusions are drawn on the conservative assumption that the radial stellar surface density Σ⋆ of the disk is purely exponential, and the central down-bending of its SBP results solely from an increase in its ℳ/ℒ ratio within the bulge. However, a possible central depletion of the disk (Breda et al. 2020b) would further enhance photometric biases due to δio.
(vii) A significant δio (≳2 mag in restframe r band) is expected in young high-z galaxies due to aging of SF clumps as they inwardly migrate from the disk. An important contribution to the early rise of δio likely comes from the outwardly increasing contamination of broadband fluxes by nebular emission, both due to the lower age of SF clumps and the lower dilution of their emission-line equivalent widths (EWs) by the local continuum. Spatially resolved studies of high-z protogalaxies with the JWST, ELT, and Euclid could test whether positive EW gradients emerge prior to or after the appearance of a dense, SF-quenched bulge, and might in this way place observational constraints on the relative role of clump migration and dissipative gas collapse during the early phase of bulge formation.
(viii) Possible approaches toward a statistical estimation of δio and its effect on the large existing body of photometric and structural determinations for bulges were discussed.
These authors defined RB as the extinction-corrected isophotal radius at which a Sérsic model to the central luminosity excess of the bulge has a surface brightness of 24 r mag/▫″. An alternative definition of RB involves the radius at which the surface brightness of the disk becomes equal to that of the bulge (e.g., Sánchez-Blázquez et al. 2014).
See Appendix A.2 for further quantitative estimates as a function of the true magnitude of the bulge and the intensity profile of the disk.
Acknowledgments
The authors thank the anonymous referee for valuable comments and suggestions, and colleagues Catarina Lobo, José Afonso and Jarle Brinchmann (Instituto de Astrofísica e Ciências do Espaço; IA) for inspiring discussions. P. P. thanks Fundação para a Ciência e a Tecnologia (FCT) for managing research funds graciously provided to Portugal by the EU. This work was supported through FCT grants UID/FIS/04434/2019, UIDB/04434/2020, UIDP/04434/2020 and the project “Identifying the Earliest Supermassive Black Holes with ALMA (IdEaS with ALMA)” (PTDC/FIS-AST/29245/2017). I. B. was supported by IA through the research grants CIAAUP-30/2019-BID and IA2020-05-BIDP and by the FCT PhD::SPACE Doctoral Network (PD/00040/2012) through the fellowship PD/BD/52707/2014. She also acknowledges financial support from the State Agency for Research of the Spanish MCIU through the “Center of Excellence Severo Ochoa” award to the Instituto de Astrofísica de Andalucía (SEV-2017-0709)”. A. H. acknowledges support through contract CIAAUP-37/2018-CTTI. J. M. G. is supported by the DL 57/2016/CP1364/CT0003 contract and acknowledges the previous support by the fellowships CIAAUP-04/2016-BPD in the context of the FCT project UID/-FIS/04434/2013 and POCI-01-0145-FEDER-007672, and SFRH/BPD/66958/2009 funded by FCT and POPH/FSE (EC). C. P. acknowledges support from DL 57/2016 (P2460) from the ‘Departamento de Física, Faculdade de Ciências da Universidade de Lisboa’. We acknowledge support from the FCT-CAPES Transnational Cooperation Project “Parceria Estratégica em Astrofísica Portugal-Brasil”. This study uses data provided by the Calar Alto Legacy Integral Field Area (CALIFA) survey (http://califa.caha.es), funded by the Spanish Ministry of Science under grant ICTS-2009-10, and the Centro Astronómico Hispano-Alemán. It is based on observations collected at the Centro Astronómico Hispano Alemán (CAHA) at Calar Alto, operated jointly by the Max-Planck-Institut für Astronomie and the Instituto de Astrofísica de Andalucía (CSIC). This research has made use of the NASA/IPAC Extragalactic Database (NED) which is operated by the Jet Propulsion Laboratory, California Institute of Technology, under contract with the National Aeronautics and Space Administration.
References
- Allen, M. G., Groves, B. A., Dopita, M. A., Sutherland, R. S., & Kewley, L. J. 2008, ApJS, 178, 20 [Google Scholar]
- Anders, P., & Fritze von Alvensleben, U. 2003, A&A, 401, 1063 [NASA ADS] [CrossRef] [EDP Sciences] [Google Scholar]
- Andredakis, Y. C., & Sanders, R. H. 1994, MNRAS, 267, 283 [NASA ADS] [CrossRef] [Google Scholar]
- Andredakis, Y. C., Peletier, R. F., & Balcells, M. 1995, MNRAS, 275, 874 [NASA ADS] [CrossRef] [Google Scholar]
- Atek, H., Siana, B., Scarlata, C., et al. 2011, ApJ, 743, 121 [NASA ADS] [CrossRef] [Google Scholar]
- Balcells, M., & Peletier, R. F. 1994, AJ, 107, 135 [NASA ADS] [CrossRef] [Google Scholar]
- Baldwin, J. A., Phillips, M. M., & Terlevich, R. 1981, PASP, 93, 5 [Google Scholar]
- Barsanti, S., Owers, M. S., McDermid, R. M., et al. 2021, ApJ, 906, 100 [NASA ADS] [CrossRef] [Google Scholar]
- Belfiore, F., Maiolino, R., Bundy, K., et al. 2018, MNRAS, 477, 3014 [Google Scholar]
- Bennert, V. N., Treu, T., Ding, X., et al. 2021, ApJ, 921, 36 [NASA ADS] [CrossRef] [Google Scholar]
- Binggeli, B., & Cameron, L. M. 1993, A&AS, 98, 297 [NASA ADS] [Google Scholar]
- Bittner, A., Gadotti, D. A., Elmegreen, B. G., et al. 2017, MNRAS, 471, 1070 [NASA ADS] [CrossRef] [Google Scholar]
- Bittner, A., Sánchez-Blázquez, P., Gadotti, D. A., et al. 2020, A&A, 643, A65 [NASA ADS] [CrossRef] [EDP Sciences] [Google Scholar]
- Bizzocchi, L., Filho, M. E., Leonardo, E., et al. 2014, ApJ, 782, 22 [CrossRef] [Google Scholar]
- Bonfini, P. 2014, PASP, 126, 935 [NASA ADS] [CrossRef] [Google Scholar]
- Bournaud, F., Elmegreen, B. G., & Elmegreen, D. M. 2007, ApJ, 670, 237 [Google Scholar]
- Breda, I., & Papaderos, P. 2018, A&A, 614, A48 [NASA ADS] [CrossRef] [EDP Sciences] [Google Scholar]
- Breda, I. 2019, PhD Thesis, University of Porto, Portugal [Google Scholar]
- Breda, I., Papaderos, P., Gomes, J. M., & Amarantidis, S. 2019, A&A, 632, A128 [NASA ADS] [CrossRef] [EDP Sciences] [Google Scholar]
- Breda, I., Papaderos, P., & Gomes, J. M. 2020a, A&A, 640, A20 [NASA ADS] [CrossRef] [EDP Sciences] [Google Scholar]
- Breda, I., Papaderos, P., Gomes, J. M., et al. 2020b, A&A, 635, A177 [NASA ADS] [CrossRef] [EDP Sciences] [Google Scholar]
- Brinchmann, J., Charlot, S., White, S. D. M., et al. 2004, MNRAS, 351, 1151 [Google Scholar]
- Bonoli, S., Marín-Franch, A., Varela, J., et al. 2021, A&A, 653, A31 [NASA ADS] [CrossRef] [EDP Sciences] [Google Scholar]
- Borisova, E., Cantalupo, S., Lilly, S. J., et al. 2016, ApJ, 831, 39 [Google Scholar]
- Bruzual, G., & Charlot, S. 2003, MNRAS, 344, 1000 [NASA ADS] [CrossRef] [Google Scholar]
- Buta, R., & Combes, F. 1996, Fund. Cosmic Phys., 17, 95 [Google Scholar]
- Catalán-Torrecilla, C., Gil de Paz, A., Castillo-Morales, A., et al. 2017, ApJ, 848, 87 [Google Scholar]
- Cid Fernandes, R., Mateus, A., Sodré, L., Stasińska, G., & Gomes, J. M. 2005, MNRAS, 358, 363 [Google Scholar]
- Cid Fernandes, R., Stasińska, G., Mateus, A., et al. 2011, MNRAS, 413, 1687 [NASA ADS] [CrossRef] [Google Scholar]
- Cirasuolo, M., Fairley, A., Rees, P., et al. 2020, Messenger, 180, 10 [Google Scholar]
- Coelho, B., Antón, S., Lobo, C., & Ribeiro, B. 2013, MNRAS, 436, 2426 [NASA ADS] [CrossRef] [Google Scholar]
- Comerón, S., Knapen, J. H., Beckman, J. E., et al. 2010, MNRAS, 402, 246 [Google Scholar]
- Costantin, L., Pérez-González, P. G., Méndez-Abreu, J., et al. 2021, ApJ, 913, 125 [NASA ADS] [CrossRef] [Google Scholar]
- Cowie, L. L., Songaila, A., Hu, E. M., & Cohen, J. G. 1996, AJ, 112, 839 [Google Scholar]
- Davies, R. L., Burstein, D., Dressler, A., et al. 1987, ApJS, 64, 581 [Google Scholar]
- de Jong, R. S., & van der Kruit, P. C. 1994, A&AS, 104, 451 [Google Scholar]
- de Jong, R. S. 1996a, A&AS, 118, 557 [NASA ADS] [CrossRef] [EDP Sciences] [Google Scholar]
- de Jong, R. S. 1996b, A&A, 313, 377 [NASA ADS] [Google Scholar]
- Dekel, A., & Burkert, A. 2014, MNRAS, 438, 1870 [Google Scholar]
- Dekel, A., Birnboim, Y., Engel, G., et al. 2009, Nature, 457, 451 [Google Scholar]
- de Lorenzo-Cáceres, A., Méndez-Abreu, J., Thorne, B., & Costantin, L. 2019, MNRAS, 484, 665 [CrossRef] [Google Scholar]
- den Brok, M., Carollo, M., Erroz-Ferrer, S., et al. 2019, MNRAS, 491, 4089 [Google Scholar]
- Djorgovski, S., & Davis, M. 1987, ApJ, 313, 59 [Google Scholar]
- Domínguez-Palmero, L., Balcells, M., Erwin, P., et al. 2008, A&A, 488, 1167 [NASA ADS] [CrossRef] [EDP Sciences] [Google Scholar]
- dos Reis, S., Buitrago, F., Papaderos, P., et al. 2020, A&A, 634, A11 [NASA ADS] [CrossRef] [EDP Sciences] [Google Scholar]
- Du, M., Ho, L. C., Debattista, V. P., et al. 2020, ApJ, 895, 139 [CrossRef] [Google Scholar]
- Elmegreen, B. G., Bournaud, F., & Elmegreen, D. M. 2008, ApJ, 688, 67 [NASA ADS] [CrossRef] [Google Scholar]
- Erwin, P. 2015, ApJ, 799, 226 [Google Scholar]
- Erwin, P., Seth, A., Debattista, V. P., et al. 2021, MNRAS, 502, 2446 [NASA ADS] [CrossRef] [Google Scholar]
- Faber, S. M., & Jackson, R. E. 1976, ApJ, 204, 668 [Google Scholar]
- Fabricius, M. H., Saglia, R. P., Fisher, D. B., et al. 2012, ApJ, 754, 67 [Google Scholar]
- Fang, J. J., Faber, S. M., Koo, D. C., & Dekel, A. 2013, ApJ, 776, 63 [NASA ADS] [CrossRef] [Google Scholar]
- Ferguson, A. M. N., Wyse, R. F. G., Gallagher III, J. S., & Hunter, D. A. 1996, AJ, 111, 2265 [NASA ADS] [CrossRef] [Google Scholar]
- Fernandez Lorenzo, M., Sulentic, J., Verdes-Montenegro, L., et al. 2014, ApJ, 788, L39 [CrossRef] [Google Scholar]
- Ferrarese, L., & Merritt, D. 2000, ApJ, 539, L9 [Google Scholar]
- Ferrers, N. M. 1877, Q. J. Pure Appl. Math, 14, 1 [Google Scholar]
- Fioc, M., & Rocca-Volmerange, B. 1997, A&A, 326, 950 [NASA ADS] [Google Scholar]
- Fisher, D., & Drory, N. 2011a, ApJ, 716, 942 [Google Scholar]
- Fisher, D., & Drory, N. 2011b, ApJ, 733, L47 [NASA ADS] [CrossRef] [Google Scholar]
- Gadotti, D. A. 2009, MNRAS, 393, 1531 [Google Scholar]
- Gadotti, D. A., & dos Anjos, S. 2001, AJ, 122, 1298 [NASA ADS] [CrossRef] [Google Scholar]
- Gadotti, D. A., Bittner, A., Falcón-Barroso, J., et al. 2020, A&A, 643, A14 [NASA ADS] [CrossRef] [EDP Sciences] [Google Scholar]
- Gallagher, J. S., III, Hunter, D. A., & Tutukov, A. V. 1984, ApJ, 284, 544 [NASA ADS] [CrossRef] [Google Scholar]
- Gallazzi, A., Charlot, S., Brinchmann, J., White, S. D. M., & Tremonti, C. A. 2005, MNRAS, 362, 41 [Google Scholar]
- Ganda, K., Peletier, R. F., McDermid, R. M., et al. 2007, MNRAS, 380, 506 [NASA ADS] [CrossRef] [Google Scholar]
- García-Benito, R., Zibetti, S., Sánchez, S. F., et al. 2015, A&A, 576, A135 [Google Scholar]
- Gavazzi, G., Bonfanti, C., Sanvito, G., et al. 2002, ApJ, 576, 135 [NASA ADS] [CrossRef] [Google Scholar]
- Gil de Paz, A., Boissier, S., Madore, B. F., et al. 2007, ApJS, 173, 185 [Google Scholar]
- Governato, F., Brook, C., Mayer, L., et al. 2010, Nature, 463, 203 [NASA ADS] [CrossRef] [Google Scholar]
- Grossi, M., Fernandes, C. A. C., Sobral, D., et al. 2018, MNRAS, 475, 735 [NASA ADS] [CrossRef] [Google Scholar]
- Gomes, J. M., & Papaderos, P. 2016, A&A, 594, A49 [NASA ADS] [CrossRef] [EDP Sciences] [Google Scholar]
- Gomes, J. M., Papaderos, P., Kehrig, C., et al. 2016a, A&A, 588, A68 [NASA ADS] [CrossRef] [EDP Sciences] [Google Scholar]
- Gomes, J. M., Papaderos, P., Vílchez, J. M., et al. 2016b, A&A, 585, A92 [NASA ADS] [CrossRef] [EDP Sciences] [Google Scholar]
- Gomes, J. M., Papaderos, P., Vílchez, J. M., et al. 2016c, A&A, 586, A22 [NASA ADS] [CrossRef] [EDP Sciences] [Google Scholar]
- González-Delgado, R. M., Pérez, E., Cid Fernandes, R., et al. 2014, A&A, 562, A47 [CrossRef] [EDP Sciences] [Google Scholar]
- Graham, A. W., Erwin, P., Trujillo, I., & Asensio Ramos, A. 2003, AJ, 125, 2951 [CrossRef] [Google Scholar]
- Guiderdoni, B., & Rocca-Volmerange, B. 1987, A&A, 186, 1 [NASA ADS] [Google Scholar]
- Gültekin, K., Richstone, D. O., Gebhardt, K., et al. 2009, ApJ, 698, 198 [Google Scholar]
- Häußler, B., Bamford, S. P., Vika, M., et al. 2013, MNRAS, 430, 330 [Google Scholar]
- Head, J. T. C. G., Lucey, J. R., Hudson, M. J., & Smith, R. J. 2014, MNRAS, 440, 1690 [Google Scholar]
- Heckman, T. M., & Best, P. N. 2014, ARA&A, 52, 589 [Google Scholar]
- Hirschmann, M., Charlot, S., Feltre, A., et al. 2017, MNRAS, 472, 2468 [NASA ADS] [CrossRef] [Google Scholar]
- Ho, L. C. 2008, ARA&A, 46, 475 [Google Scholar]
- Hopkins, A. M., Miller, C. J., Nichol, R. C., et al. 2003, ApJ, 599, 971 [Google Scholar]
- Hopkins, P. F., Kereš, D., Murray, N., Quataert, E., & Hernquist, L. 2012, MNRAS, 427, 968 [NASA ADS] [CrossRef] [Google Scholar]
- Huchra, J. P. 1977, ApJ, 217, 928 [NASA ADS] [CrossRef] [Google Scholar]
- Humphrey, A., Binette, L., Villar-Martín, M., Aretxaga, I., & Papaderos, P. 2013, MNRAS, 428, 563 [NASA ADS] [CrossRef] [Google Scholar]
- Iglesias-Páramo, J., Vílchez, J. M., Galbany, L., et al. 2013, A&A, 553, L7 [NASA ADS] [CrossRef] [EDP Sciences] [Google Scholar]
- Iglesias-Páramo, J., Vílchez, J. M., Rosales-Ortega, F. F., et al. 2016, ApJ, 826, 71 [Google Scholar]
- Izotov, Y. I., Lipovetsky, V. A., Chaffee, F. H., et al. 1997, ApJ, 476, 698 [CrossRef] [Google Scholar]
- Jablonka, P., Gorgas, J., & Goudfrooij, P. 2007, A&A, 474, 763 [NASA ADS] [CrossRef] [EDP Sciences] [Google Scholar]
- Jagvaral, Y., Campbell, D., Mandelbaum, R., & Rau, M. M. 2022, MNRAS, 509, 1764 [Google Scholar]
- Johnston, E. J., Aragón-Salamanca, A., Merrifield, M. R., & Bedregal, A. G. 2012, MNRAS, 422, 2590 [Google Scholar]
- Johnston, E. J., Häußler, B., Aragón-Salamanca, A., et al. 2017, MNRAS, 465, 2317 [Google Scholar]
- Jørgensen, I., Franx, M., & Kjærgaard, P. 1995, MNRAS, 276, 1341 [Google Scholar]
- Kalinova, V., Colombo, D., Sánchez, S. F., et al. 2021, A&A, 648, A64 [NASA ADS] [CrossRef] [EDP Sciences] [Google Scholar]
- Kauffmann, G., Heckman, T. M., Tremonti, C., et al. 2003, MNRAS, 346, 1055 [Google Scholar]
- Kelz, A., Verheijen, M. A. W., Roth, M. M., et al. 2006, PASP, 118, 129 [Google Scholar]
- Kennicutt, R. C., Jr 1989, ApJ, 344, 685 [CrossRef] [Google Scholar]
- Kewley, L. J., Dopita, M. A., Sutherland, R. S., Heisler, C. A., & Trevena, J. 2001, ApJ, 556, 121 [Google Scholar]
- Kormendy, J. 1977, ApJ, 217, 406 [Google Scholar]
- Kormendy, J., & Djorgovski, S. 1989, ARA&A, 27, 235 [NASA ADS] [CrossRef] [Google Scholar]
- Kormendy, J., & Ho, L. C. 2013, ARA&A, 51, 511 [Google Scholar]
- Kormendy, J., & Kennicutt, R., Jr 2004, ARA&A, 42, 603 [NASA ADS] [CrossRef] [Google Scholar]
- Kormendy, J., Drory, N., Bender, R., & Cornell, M. E. 2010, ApJ, 723, 54 [Google Scholar]
- Kormendy, J., Bender, R., & Cornell, M. 2011, Nature, 469, 374 [NASA ADS] [CrossRef] [Google Scholar]
- Krüger, H., Fritze von Alvensleben, U., & Loose, H. H. 1995, A&A, 303, 41 [Google Scholar]
- Kuijken, K., & Dubinski, J. 1995, MNRAS, 277, 1341 [CrossRef] [Google Scholar]
- Lang, P., Wuyts, S., Somerville, R., et al. 2014, ApJ, 788, 11 [NASA ADS] [CrossRef] [Google Scholar]
- Laurikainen, E., Salo, H., Laine, J., & Janz, J. 2018, A&A, 618, A34 [EDP Sciences] [Google Scholar]
- Leclercq, F., Bacon, R., Verhamme, A., et al. 2020, A&A, 635, A82 [NASA ADS] [CrossRef] [EDP Sciences] [Google Scholar]
- MacArthur, L. A., Courteau, S., & Holtzman, J. A. 2003, ApJ, 582, 689 [NASA ADS] [CrossRef] [Google Scholar]
- Madau, P., & Dickinson, M. 2014, ARA&A, 52, 415 [Google Scholar]
- Magorrian, J., Tremaine, S., Richstone, D., et al. 1998, AJ, 115, 2285 [Google Scholar]
- Mandelker, N., Dekel, A., Ceverino, D., et al. 2014, MNRAS, 443, 3675 [NASA ADS] [CrossRef] [Google Scholar]
- Mandelker, N., Dekel, A., Ceverino, D., et al. 2017, MNRAS, 464, 635 [NASA ADS] [CrossRef] [Google Scholar]
- Martig, M., Bournaud, F., Teyssier, R., & Dekel, A. 2009, ApJ, 707, 250 [Google Scholar]
- Martinsson, T. P. K., Verheijen, M. A. W., Westfall, K. B., et al. 2013, A&A, 557, A130 [NASA ADS] [CrossRef] [EDP Sciences] [Google Scholar]
- Méndez-Abreu, J., Aguerri, J. A. L., Corsini, E. M., & Simonneau, E. 2008, A&A, 478, 353 [NASA ADS] [CrossRef] [EDP Sciences] [Google Scholar]
- Méndez-Abreu, J., Ruiz-Lara, T., Sánchez-Menguiano, L., et al. 2017, A&A, 598, A32 [NASA ADS] [CrossRef] [EDP Sciences] [Google Scholar]
- Méndez-Abreu, J., Sánchez, S. F., & de Lorenzo-Cáseres, A. 2019, MNRAS, 484, 4298 [CrossRef] [Google Scholar]
- Moles, M., Cenarro, A. J., Cristóbal-Hornillos, D., et al. 2011, in Highlights of Spanish Astrophysics VI, Proceedings of the IX Scientific Meeting of the Spanish Astronomical Society (SEA), held in Madrid, September 13–17, 2010, ed. M. R. Zapatero Osorio, et al., 73 [Google Scholar]
- Mosleh, M., Tacchella, S., Renzini, A., et al. 2017, ApJ, 837, 2 [NASA ADS] [CrossRef] [Google Scholar]
- Muñoz-Mateos, J. C., Gil de Paz, A., & Boissier, S. 2007, ApJ, 658, 1006 [CrossRef] [Google Scholar]
- Noeske, K. G., Papaderos, P., Cairós, L. M., & Fricke, K. J. 2003, A&A, 410, 481 [NASA ADS] [CrossRef] [EDP Sciences] [Google Scholar]
- Noeske, K. G., Faber, S. M., Weiner, B. J., et al. 2007, ApJ, 660, 47 [Google Scholar]
- Neumann, J., Wisotzki, L., Cloudhury, O. S., et al. 2017, A&A, 604, A30 [NASA ADS] [CrossRef] [EDP Sciences] [Google Scholar]
- Noguchi, M. 1999, ApJ, 514, 77 [NASA ADS] [CrossRef] [Google Scholar]
- Obreja, A., Domínguez-Tenreiro, R., Brook, C., et al. 2013, ApJ, 763, 26 [Google Scholar]
- Papaderos, P., & Östlin, G. 2012, A&A, 537, A126 [NASA ADS] [CrossRef] [EDP Sciences] [Google Scholar]
- Papaderos, P., Loose, H. H., Thuan, T. X., & Fricke, K. J. 1996, A&AS, 120, 207 [NASA ADS] [CrossRef] [EDP Sciences] [Google Scholar]
- Papaderos, P., Izotov, Y. I., Fricke, K. J., Thuan, T. X., & Guseva, N. G. 1998, A&A, 338, 43 [NASA ADS] [Google Scholar]
- Papaderos, P., Izotov, Y. I., Thuan, T. X., et al. 2002, A&A, 393, 461 [NASA ADS] [CrossRef] [EDP Sciences] [Google Scholar]
- Papaderos, P., Gomes, J., Vílchez, J., et al. 2013, A&A, 555, L1 [NASA ADS] [CrossRef] [EDP Sciences] [Google Scholar]
- Peletier, R. F., & Balcells, M. 1996, AJ, 111, 2238 [NASA ADS] [CrossRef] [Google Scholar]
- Peng, C. Y., Ho, L. C., Impey, C. D., & Rix, H. W. 2010, AJ, 139, 2097 [Google Scholar]
- Pérez, E., Cid Fernandes, R., González Delgado, R. M., et al. 2013, ApJ, 764, L1 [Google Scholar]
- Pilkington, K., Gibson, B. K., Calura, F., et al. 2011, MNRAS, 417, 2891 [NASA ADS] [CrossRef] [Google Scholar]
- Poggianti, B. M., Smail, I., Dressler, A., et al. 1999, ApJ, 518, 576 [Google Scholar]
- Quai, S., Pozzetti, L., Moresco, M., et al. 2019, MNRAS, 490, 2347 [CrossRef] [Google Scholar]
- Richstone, D., Ajhar, E. A., Bender, R., et al. 1998, Nature, 395, 14 [Google Scholar]
- Rosales-Ortega, F., Sánchez, S. F., Iglesias-Páramo, J., et al. 2012, ApJ, 756, L31 [NASA ADS] [CrossRef] [Google Scholar]
- Roth, M. M., Kelz, A., Fechner, T., et al. 2005, PASP, 117, 620 [Google Scholar]
- Sahu, N., Graham, A. W., & Davis, B. L. 2020, ApJ, 903, 97 [NASA ADS] [CrossRef] [Google Scholar]
- Salim, S., & Rich, R. M. 2010, ApJ, 714, 290 [Google Scholar]
- Salim, S., Fang, J. J., Rich, R. M., et al. 2012, ApJ, 755, 105 [NASA ADS] [CrossRef] [Google Scholar]
- Salzer, J. J., MacAlpine, G. M., & Boroson, T. A. 1989, ApJS, 70, 479 [NASA ADS] [CrossRef] [Google Scholar]
- Sánchez, S. F., Kennicutt, R. C., Gil de Paz, A., et al. 2012, A&A, 538, A8 [Google Scholar]
- Sánchez, S. F., García-Benito, R., Zibetti, S., et al. 2016, A&A, 594, A36 [Google Scholar]
- Sánchez-Blázquez, P., Rosales-Ortega, F. F., Méndez-Abreu, J., et al. 2014, A&A, 570, A6 [NASA ADS] [CrossRef] [EDP Sciences] [Google Scholar]
- Sandage, A. 1986, A&A, 161, 89 [NASA ADS] [Google Scholar]
- Schaerer, D., & de Barros, S. 2009, A&A, 502, 423 [NASA ADS] [CrossRef] [EDP Sciences] [Google Scholar]
- Schawinski, K., Thomas, D., Sarzi, M., et al. 2007, MNRAS, 382, 1415 [Google Scholar]
- Sérsic, J. L. 1963, Boletin de la Asociacion Argentina de Astronomia, 6, 41 [Google Scholar]
- Silk, J. 1997, ApJ, 481, 703 [CrossRef] [Google Scholar]
- Simmons, B. D., Lintott, C., Schawinski, K., et al. 2013, MNRAS, 429, 2199 [NASA ADS] [CrossRef] [Google Scholar]
- Stasińska, G., Vale Asari, N., Cid Fernandes, R., Gomes, J. M., et al. 2008, MNRAS, 391, L29 [Google Scholar]
- Strateva, I., Ivvezic, Z., Knapp, G. R., et al. 2001, AJ, 122, 1861 [CrossRef] [Google Scholar]
- Tabor, M., Merrifield, M., Aragón-Salamanca, A., et al. 2017, MNRAS, 466, 2024 [NASA ADS] [CrossRef] [Google Scholar]
- Tabor, M., Merrifield, M., Aragón-Salamanca, A., et al. 2019, MNRAS, 485, 1546 [NASA ADS] [CrossRef] [Google Scholar]
- Tacchella, S., Carollo, C. M., Renzini, A., et al. 2015, Science, 348, 314 [NASA ADS] [CrossRef] [Google Scholar]
- Tacchella, S., Dekel, A., Carollo, C. M., et al. 2016, MNRAS, 458, 242 [NASA ADS] [CrossRef] [Google Scholar]
- Tamburello, V., Rahmati, A., Mayer, L., et al. 2017, MNRAS, 468, 4792 [NASA ADS] [CrossRef] [Google Scholar]
- Trujillo, I., Graham, A. W., & Caon, N. 2001, MNRAS, 326, 869 [Google Scholar]
- Trujillo, I., Erwin, P., Asensio Ramos, A., & Graham, A. W. 2004, AJ, 127, 1917 [NASA ADS] [CrossRef] [Google Scholar]
- Verheijen, M., Bershady, M., Andersen, D., et al. 2004, Astron. Nachr., 325, 151 [NASA ADS] [CrossRef] [Google Scholar]
- Vika, M., Bamford, S. P., Häußler, B., & Rojas, A. L. 2014, MNRAS, 444, 3603 [NASA ADS] [CrossRef] [Google Scholar]
- Villar-Martín, M., Sánchez, S. F., Humphrey, A., et al. 2007, MNRAS, 378, 416 [CrossRef] [Google Scholar]
- Weilbacher, P., Monreal-Ibero, A., Verhamme, A., et al. 2018, A&A, 611, A95 [NASA ADS] [CrossRef] [EDP Sciences] [Google Scholar]
- Widrow, L. M., & Dubinski, J. 2005, ApJ, 631, 838 [Google Scholar]
- Wisotzki, L., Bacon, R., Blaizot, J., et al. 2016, A&A, 587, 98 [Google Scholar]
- Wuyts, S., Förster Schreiber, N., Genzel, R., et al. 2012, ApJ, 753, 114 [NASA ADS] [CrossRef] [Google Scholar]
- Zackrisson, E., Bergvall, N., Olofsson, K., & Siebert, A. 2001, A&A, 375, 814 [NASA ADS] [CrossRef] [EDP Sciences] [Google Scholar]
- Zhu, L., van den Bosch, R., van de Ven, G., et al. 2018a, MNRAS, 473, 3000 [Google Scholar]
- Zhu, L., van de Ven, G., Méndez-Abreu, J., & Obreja, A. 2018b, MNRAS, 479, 945 [Google Scholar]
- Zibetti, S., Gallazzi, A. R., Ascasibar, Y., et al. 2017, MNRAS, 468, 1902 [NASA ADS] [Google Scholar]
- Ziegler, B. L., & Bender, R. 1997, MNRAS, 291, 527 [NASA ADS] [CrossRef] [Google Scholar]
- Ziegler, B. L., Saglia, R. P., Bender, R., et al. 1999, A&A, 346, 13 [NASA ADS] [Google Scholar]
Appendix A: Supplementary notes to Sect. 3
A.1. δio versus central intensity depression and cutoff radius of a modexp profile
In this section we supplement the discussion in Sect. 3.1 by a quantitative determination of δio for different modexp profiles for the disk. We recall that modexp involves two further free parameters in addition to the central surface brightness μ0 (mag/▫″) and scale length α (″) defining a purely exponential model. The first parameter, ϵ1 = ΔI/I0, constraints the depression ΔI of the disk relative to the central intensity I0 of a purely exponential profile. Correspondingly, the dimming δμ0 (mag) of the disk at R⋆ = 0″ relative to the central surface brightness of an exponential model is −2.5 log(1 − ϵ1). In Sect. 3.1 we considered cases of a modest central dimming (0.5 ≤ δμ0 (mag) ≤ 2), based on estimates with PéGASE on the ℳ/ℒ contrast between the star-forming disk and the SF-quenched bulge. This range of δμ0 appears adequate when we assume that the stellar surface density Σ⋆ profile of the disk is purely exponential all the way to R⋆ = 0″, thus SFQ is the only cause for the surface brightness depression of the disk in its central part. If, additionally, the disk is centrally depleted (cf. Sect. 4.4), then a higher δμ0 will need be invoked (e.g., ∼5 mag in the case of almost complete central evacuation with an ϵ1 ≈ 0.99).
The second free parameter ϵ2 quantifies the radius Rc (in units of α) inward of which modexp deviates from the exponential model. It can therefore be regarded as the galactocentric distance out to which the physical mechanisms behind SFQ appreciably influence the SFH (and radial ℳ/ℒ profile) of a galaxy. While to the best of our knowledge, theoretical or observational inferences do not exist for this radius, it is reasonable to assume that it depends on the nature and timescale of the dominant SF quenching mechanism. For example, in the context of morphological quenching (Martig et al. 2009), we may expect SFQ to be spatially confined to within RB (i.e., ϵ2 = 1 for the synthetic galaxy in Fig. 8 where RB=α) while extending well beyond RB in the case of AGN-driven SFQ (Silk 1997). As for other proposed mechanisms, such as inhibition of cold gas inflow from the cosmic web due to virial shocks in high-mass galaxies (Dekel et al. 2009), little can be quantitatively said about ϵ2 and the expected age and ℳ/ℒ gradients therein (see B20a for a discussion). Clearly, because ϵ2 might offer a discriminator between different models for SFQ, it would be interesting to explore techniques for its determination.
Figure A.1 (upper panel) illustrates the variation of modexp profiles for a disk model with the same μ0 and α as in Fig. 8 (21.6 mag/▫″ and 20″, respectively) for three ϵ2 (0.67, 1.0, and 1.5; blue, orange, and red, respectively) and two values for ϵ1, the first one (0.84) characterizing the upper range of values that one might expect for a purely exponential Σ⋆ profile, and the second one (0.99) approximating a centrally depleted exponential profile. These ϵ1 values correspond to a δμ0 of 2 and 5 mag, respectively. The lower panel shows as a function of ϵ1 the variation of δμ0 and dimming δio (mag) of the integrated magnitude of the disk within R⋆=α. The computed δio for ϵ1 = 0.84 ranges between 0.9 and 1.25 mag for an ϵ2 of 1.0 and 1.5, respectively, reaching values of 1.4 and 2.5 mag for a depleted disk with ϵ1 = 0.99.
 |
Fig. A.1. Connection between the form of modified exponential (modexp) profiles and the resulting δio for the disk. upper panel: Modified exponential profiles (Eq. (4)) with a central intensity depression ϵ1 of 0.84 and 0.99 (solid and dotted curves, respectively) and a cutoff radius ϵ2 of 0.67, 1.0, and 1.5 α (blue, orange, and red, respectively), with α (20″≡ RB for the synthetic SBP in Fig. 8) denoting the exponential scale length of the disk. lower panel:ϵ1 vs. depression δμ0 of the central surface brightness of a modexp profile relative to a purely exponential profile (dots). Curves show the variation across ϵ1 of the difference δio (mag) between the integrated magnitude within RB of modexp profiles and the value corresponding to a pure exponential profile. For an ϵ2 ≥ 1, the disk dims by between 0.9 mag (ϵ1 = 0.84) and 2.5 mag (ϵ1 = 0.99). |
Polynomial fits for 0.1≤ϵ1 ≤ 0.99 yield the relations
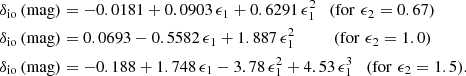
A.2. Retrieved versus true bulge magnitude when neglecting δio
In this section we supplement our remarks on Fig. 9 with further quantitative inferences on the under-estimation of the luminosity of the bulge when bulge-disk decomposition of a centrally SF-quenched LTG is made assuming that the exponential model to the outer, SF-elevated zone of the disk is valid all the way to the center of the galaxy. In particular, we show that the fainter the bulge is (i.e., the lower the B/iD) the higher is the fractional underestimation of its luminosity (Sect. 3.1&4.2). This means that a low-luminosity bulge in a modestly SF-quenched disk can be more affected by δio than an intrinsically bright bulge in a fully SF-quenched disk. Clearly, the estimates below only address a narrow aspect of the influence of inside-out SFQ for galaxy decomposition. As pointed out in Sect. 4.1 a comprehensive investigation of this subject will require simulations of bulge-disk decomposition for synthetic multiband galaxy images. These should integrate realistic prescriptions for SFQ as a function of age and galaxy mass, and reproduce the observational imprints (e.g., radial age, ℳ/ℒ and EW(Hα) gradients) of this process both for barless and barred galaxies. Additionally, observationally and theoretically motivated alternatives to modexp should be explored.
Similar to Fig. 9, the estimates next are obtained by decomposing synthetic SBPs that consist of a Sérsic model for the bulge and a modexp for the disk into, respectively, a Sérsic and a pure exponential profile. The net (disk-subtracted) profiles for the bulge were in turn used to infer how the neglect of δio affects the retrieved apparent magnitude of the bulge inside RB. These simulations refer to a disk with an (extrapolated) central surface brightness of 21.6 mag/▫″ and an exponential scale length α = 20″ (values identical to those in Fig. 8) and cover a range 0 ≤ ϵ1 ≤ 0.99 (correspondingly, a δμ0 between 0 and 5 mag) for three SFQ radii ϵ2 (0.67, 1 and 1.5 α). Additionally, they address how at a given ϵ1, 2 the fractional underestimation of the luminosity of the bulge increases as its intrinsic luminosity decreases; for this, we simulate a decrease of the magnitude of the bulge from its original value (mB = 14.27 mag; cf. Fig. 8) to ∼18 mag.
The main insight from Fig. A.2 is that the underestimation of the bulge magnitude (vertical bar at the r.h.s. of each diagram) depends both on mB itself and the shape of the SF-quenched disk (i.e., on ϵ1, 2). For example, a relatively bright bulge with the properties assumed in Fig. 8 is relatively immune to δio, as its apparent magnitude within RB would be underestimated by merely ≈0.5 (1) mag for a δμ0 = 1 (2) mag, when ϵ2 = 1. However, a bulge with the same compactness (i.e., β and η) but lower luminosity will artificially dim by 1.4 mag if its mB were one mag fainter (15.27 mag), and by 3.7 mag if its mB were 16.27 mag. The detection bias against intrinsically faint bulges will be further aggravated for a larger cutoff radius. For instance, an ϵ2 = 1.5 will increase the underestimation of the bulge magnitude to 2.6 mag and 5.2 mag, respectively. The evidence from Fig. A.2 underscores our remarks in Sect. 4.3 that studies of intrinsically bright bulges in iC LTGs are only moderately affected by δio, whereas a stronger effect is expected for lower-luminosity bulges in iB (∼L⋆) LTGs.
 |
Fig. A.2. Simulation of the underestimation (in mag) of the apparent magnitude of the bulge inside RB (vertical bar) when applying standard bulge-disk decomposition (into a Sérsic model for the bulge and a pure exponential model for the disk) to a galaxy with a centrally SF-quenched disk. The latter is approximated by a modexp profile with cutoff radii ϵ2 of 0.67, 1.0, and 1.5 (left, central and right panel, respectively; cf. Fig. A.1) and a central surface depression δμ0 = −2.5 log(1 − ϵ1) between 0 and 5 mag. The (extrapolated) central surface brightness μ0 (21.6 mag/▫″) and exponential scale length α (20″) of the disk are identical to those adopted in Fig. 8. The true apparent magnitude mB of the bulge (abscissa) varies between 14.27 mag (the value for the Sérsic profile in Fig. 8) and ∼18 mag. Contours go from 0.5 mag to 9 mag in increments of 0.5 mag. |
All Figures
|
Fig. 1. Illustration of the morphology and radial structure of typical Milky Way-sized LTGs in the local Universe. Left: SDSS true-color thumbnails of galaxies from the sample analyzed by Breda & Papaderos (2018) with their inner reddish zone and surrounding blue star-forming disk. From top left to bottom-right: NGC 0309, NGC 0234, NGC 3811, NGC 0873, UGC 4256, NGC 2543, NGC 0171, and UGC 4308. Right: schematic representation of the bulge (shaded red area) and the disk (light blue) in a face-on late-type galaxy. The surface brightness profile of the disk results from the projection of an exponential stellar surface density Σ⋆ (dark blue), whereby the ℳ/ℒ ratio in the inner SF-quenched zone of the disk (iD) within the bulge radius RB is higher than that in the outer (R⋆ > RB) star-forming zone of the disk (oD). A consequence of this is that the central surface brightness μ0 of the disk is fainter by δμ0 mag than the value implied by inward extrapolation of the exponential fit to the outer disk (dashed line) and that the standard bulge-disk decomposition overestimates the integrated magnitude of the disk within RB by δio (mag). This in turn entails an oversubtraction of the disk, thus a systematic underestimation of the luminosity of the bulge. |
| In the text | |
|
Fig. 2. Predictions based on the evolutionary synthesis code PéGASE 2 on the variation of the ℳ/ℒ ratio and δio as a function of galaxy age. Upper panel: logarithm of the ℳ/ℒ ratio as a function of time when assuming continuous star formation at a constant SFR (SFH1), and an exponentially decreasing SFR with an e-folding time τ of 0.5 Gyr and 1 Gyr (SFH2 and SFH3, respectively). Predictions for the B and R band (blue and red, respectively) are shown with symbols (squares, solid circles, and open circles for SFH1, SFH2, and SFH3, respectively) and those for the K band with curves (blue, orange, and black for SFH1, SFH2, and SFH3, respectively). Lower panel: evolution of δio, as approximated by Eq. (2), when assuming SFH2 and SFH3 for the bulge (solid and open symbols, respectively) with predictions for the B, R, and K band shown in blue, red, and black, respectively. |
| In the text | |
|
Fig. 3. Synopsis of results obtained for the LTG NGC 0776 (D = 65.5 Mpc; log(ℳ⋆/M⊙) = 11.1) from spectral modeling of CALIFA IFS data. (a) True-color SDSS image composite of the galaxy. The circle depicts the isophotal diameter of the bulge (15 |
| In the text | |
|
Fig. 4. Dimming δμ (mag) relative to the observed, emission-line corrected g-band SBP of NGC 0776 (black) as a function of normalized radius R⋆/RB after suppression of stellar populations younger than a tcut between 0.03 and 9 Gyr. The color-coding is same as in Fig. 3d. Gray lines show linear fits for R⋆/RB ≥2, i.e., in a radius interval in which the contribution of the bulge and bar become negligible. |
| In the text | |
|
Fig. 5. Visualization of the connection between present-day stellar surface density and stellar mass growth for the LTG NGC 0776. (a) Difference ⟨δμ9G⟩ between the r-band magnitude of the old (≥9 Gyr) and existing stellar component vs. logarithm of the stellar surface density Σ⋆ (M⊙ kpc−2). Symbols have the same meaning as in Fig. 3c. (b) Percentual mass fraction of stars formed over the past one Gyr (lower panel) vs. Σ⋆. |
| In the text | |
|
Fig. 6. Comparison of the SFH inferred with STARLIGHT for the bulge and disk of NGC 0776 (lower and upper panel, respectively). Vertical bars, color-coded according to stellar metallicity (open blue, dark blue, green, and orange for Z⊙/10, Z⊙/5, Z⊙/2.5, and Z⊙, respectively) show the contribution (in percent) of individual SSPs to the monochromatic luminosity of the continuum at 5150 Å. The sum of all SSP contributions at a given age is shown in gray. Thin vertical lines mark the (38) ages available in the SSP library we used (see BP18 for details). The labels in the upper left part of each diagram inform about the luminosity fraction of stellar populations younger than 0.1, 1, and 5 Gyr, as well as the light-weighted stellar age and metallicity. The bulge luminosity is dominated by old stellar populations, whereas more than 50% of the emission in the disk comes from stars younger than 5 Gyr. |
| In the text | |
|
Fig. 7. Diagnostic emission-line ratios and photometric impact of nebular emission in NGC 0776. Upper panel: log([N II]6584/Hα) vs. log([O III]5007/Hβ) diagram. Single-spaxel determinations within RB and in the outer disk (red and blue, respectively) are shown with dots, whereas squares depict average values within isan. The locus that is characteristic of AGN and LINERs and the locus corresponding to photoionization by OB stars in SF regions are indicated with demarcation lines from Kauffmann et al. (2003, dotted curve), Kewley et al. (2001, solid curve), and Schawinski et al. (2007, dashed line). The grid of thin gray lines depicts the parameter space that can be accounted for by pure shock excitation, as predicted by Allen et al. (2008) for a magnetic field of 1 μG, and a range of shock velocities between 100 and 1000 km s−1 for gas densities between 0.1 and 100 cm−3. It is apparent that the diagnostic line ratios both for the bulge and outer disk fall close to the empirical envelope characterizing SF regions and in the locus of composite sources (i.e., between the curves by Kauffmann et al. and Kewley et al.). Lower panel: difference between the r-band magnitude of the observed spectrum and that of the stellar fit to it vs. EW(Hα) (Å) for individual spaxels (dots) and isan (squares). A linear fit (line) indicates that nebular line emission in this composite system enhances the r-band emission by ∼0.7 mag per 103 Å in EW(Hα). |
| In the text | |
|
Fig. 8. Synthetic SBP of a galaxy that consists of a bulge (red; approximated by a Sérsic model) and a more extended disk (blue; approximated by the modexp function; cf. Eq. (4)). Inside the isophotal radius of the bulge at 24 mag/▫″ (RB = 20″), star formation quenching leads to a central dimming of the disk by 0.5 ≤ δμ0 ≤ 2 relative to the exponential fit for R⋆ ≥ RB (orange). The composite bulge+disk SBP for a δμ0 of 0.5 mag and 2 mag is shown with the dark and light gray curves, respectively. |
| In the text | |
|
Fig. 9. Net emission of the bulge, as obtained by subtracting the inwardly extrapolated exponential fit to the visible outer disk at R⋆ > 20″ from the total (Sérsic+modexp) SBP in Fig. 8. |
| In the text | |
|
Fig. 10. Simulation of a seemingly bulgeless galaxy that consists of a faint bulge (red; B/T ratio ∼0.1) and an SF-quenched disk (blue) with δμ0 = 1 mag. The residual bulge emission after subtraction of an exponential model to the outer disk (R⋆ > 20″) is shown in orange. |
| In the text | |
|
Fig. 11. Simulation of the radial surface brightness and color distribution for a centrally SF-quenched LTG. Upper panel: surface brightness profiles in B and R (blue and red, respectively) for the bulge and disk (thin and thick curves, respectively) for a synthetic galaxy with a constant B–R color of 1.54 mag in its bulge and 0.74 mag in its outer disk (R⋆ > RB = 20″). The disk is modeled by modexp profiles with a different central depression parameter ϵ1 in B and R such as to simulate a central SF quenching with a δμ0 = 1 mag in B and a color that smoothly increases inward of RB from 0.74 mag to 1.54 mag (cf. lower panel). Lower panel: true B–R color of the bulge (solid red line), true-color profile of the disk (blue), and observed color profile resulting from the superposition of the bulge and the disk in the case of SFQ (orange) and no SFQ (black). The dashed red curve shows the color profile that would be obtained for the bulge if the correction for the underlying disk were made by assuming a pure exponential (instead of a modexp) profile for it, that is, when SFQ is neglected. |
| In the text | |
|
Fig. 12. Central part of B–R color profiles for the composite (Sérsic+modexp) galaxy model in Fig. 11 for a δμ0 between 0 and 2 mag (solid curves). Dashed curves show disk-corrected color profiles computed on the standard assumption that the disk follows an exponential profile all the way to its center. The true color of the bulge (1.54 mag) and of the outer disk (R⋆ > RB; 0.74 mag) are depicted by the horizontal lines. |
| In the text | |
|
Fig. 13. Mass-dependent SFH of bulges and resulting evolution of δio for a galaxy downsizing scenario. Upper panel: SFR parameterizations simulating a downsizing trend for galaxy bulges by assuming that their age at the peak of their SFR and their SF e-folding timescale inversely with ℳ⋆. High-, intermediate-, and low-mass bulges (iC, iB, and iA, respectively, in the classification by BP18) reach their maximum SFR at 0.47, 1.2, and 2.4 Gyr. Lower panel: evolution of δio (approximated by 2.5 ⋅ log(ψ), as in Fig. 2) in the B and R band (solid and dashed curves, respectively) for the three SFH scenarios for the bulge (upper panel) when a constant SFR for the outer disk is assumed. The shaded gray area depicts the redshift interval 0.76 ≤ z ≤ 2.3 that will be covered both by the MOONS spectrograph at VLT (0.65–1.8 μm) and the B-band filter (∼0.37–0.54 μm). The amplitude of δio at z ∼ 1 (vertical white line) depends on galaxy mass. It is moderate (∼0.85 B mag) for low-mass (< L⋆) galaxies and reaches ∼2 mag for massive LTGs in advanced stages of SF quenching. |
| In the text | |
|
Fig. 14. Schematic sketch of the relation between SMBH mass ℳ∙ and absolute magnitude of the bulge MB, with the solid diagonal line depicting the commonly adopted mean ratio ℳ∙/ℳ⋆ ≈ 0.002 (cf., e.g., Heckman & Best 2014) and the dashed line its expected change after correction for the δio effect. Arrows in the upper part point to the amplitude of δio and the expected fractional under-estimation of the bulge luminosity δLB for the three LTG classes proposed in BP18. Bulgeless, pseudo-bulge, and classical-bulge galaxies may loosely be associated with type iA, iB, and iC LTGs in the mass intervals log(ℳ⋆/M⊙) < 10.3, ∼10.5, and > 10.7, respectively. Whereas δio increases with ℳ⋆, its effect on δLB is likely comparatively small for high-mass LTGs because of the prominence of their bulges, while it is expected to increase for intermediate-mass LTGs that simultaneously show a significant δio and a modest B/D ratio. We expect δLB for low-mass LTGs to show a large scatter around a low median value because of their very low δio and B/D ratio. |
| In the text | |
|
Fig. A.1. Connection between the form of modified exponential (modexp) profiles and the resulting δio for the disk. upper panel: Modified exponential profiles (Eq. (4)) with a central intensity depression ϵ1 of 0.84 and 0.99 (solid and dotted curves, respectively) and a cutoff radius ϵ2 of 0.67, 1.0, and 1.5 α (blue, orange, and red, respectively), with α (20″≡ RB for the synthetic SBP in Fig. 8) denoting the exponential scale length of the disk. lower panel:ϵ1 vs. depression δμ0 of the central surface brightness of a modexp profile relative to a purely exponential profile (dots). Curves show the variation across ϵ1 of the difference δio (mag) between the integrated magnitude within RB of modexp profiles and the value corresponding to a pure exponential profile. For an ϵ2 ≥ 1, the disk dims by between 0.9 mag (ϵ1 = 0.84) and 2.5 mag (ϵ1 = 0.99). |
| In the text | |
|
Fig. A.2. Simulation of the underestimation (in mag) of the apparent magnitude of the bulge inside RB (vertical bar) when applying standard bulge-disk decomposition (into a Sérsic model for the bulge and a pure exponential model for the disk) to a galaxy with a centrally SF-quenched disk. The latter is approximated by a modexp profile with cutoff radii ϵ2 of 0.67, 1.0, and 1.5 (left, central and right panel, respectively; cf. Fig. A.1) and a central surface depression δμ0 = −2.5 log(1 − ϵ1) between 0 and 5 mag. The (extrapolated) central surface brightness μ0 (21.6 mag/▫″) and exponential scale length α (20″) of the disk are identical to those adopted in Fig. 8. The true apparent magnitude mB of the bulge (abscissa) varies between 14.27 mag (the value for the Sérsic profile in Fig. 8) and ∼18 mag. Contours go from 0.5 mag to 9 mag in increments of 0.5 mag. |
| In the text | |
Current usage metrics show cumulative count of Article Views (full-text article views including HTML views, PDF and ePub downloads, according to the available data) and Abstracts Views on Vision4Press platform.
Data correspond to usage on the plateform after 2015. The current usage metrics is available 48-96 hours after online publication and is updated daily on week days.
Initial download of the metrics may take a while.