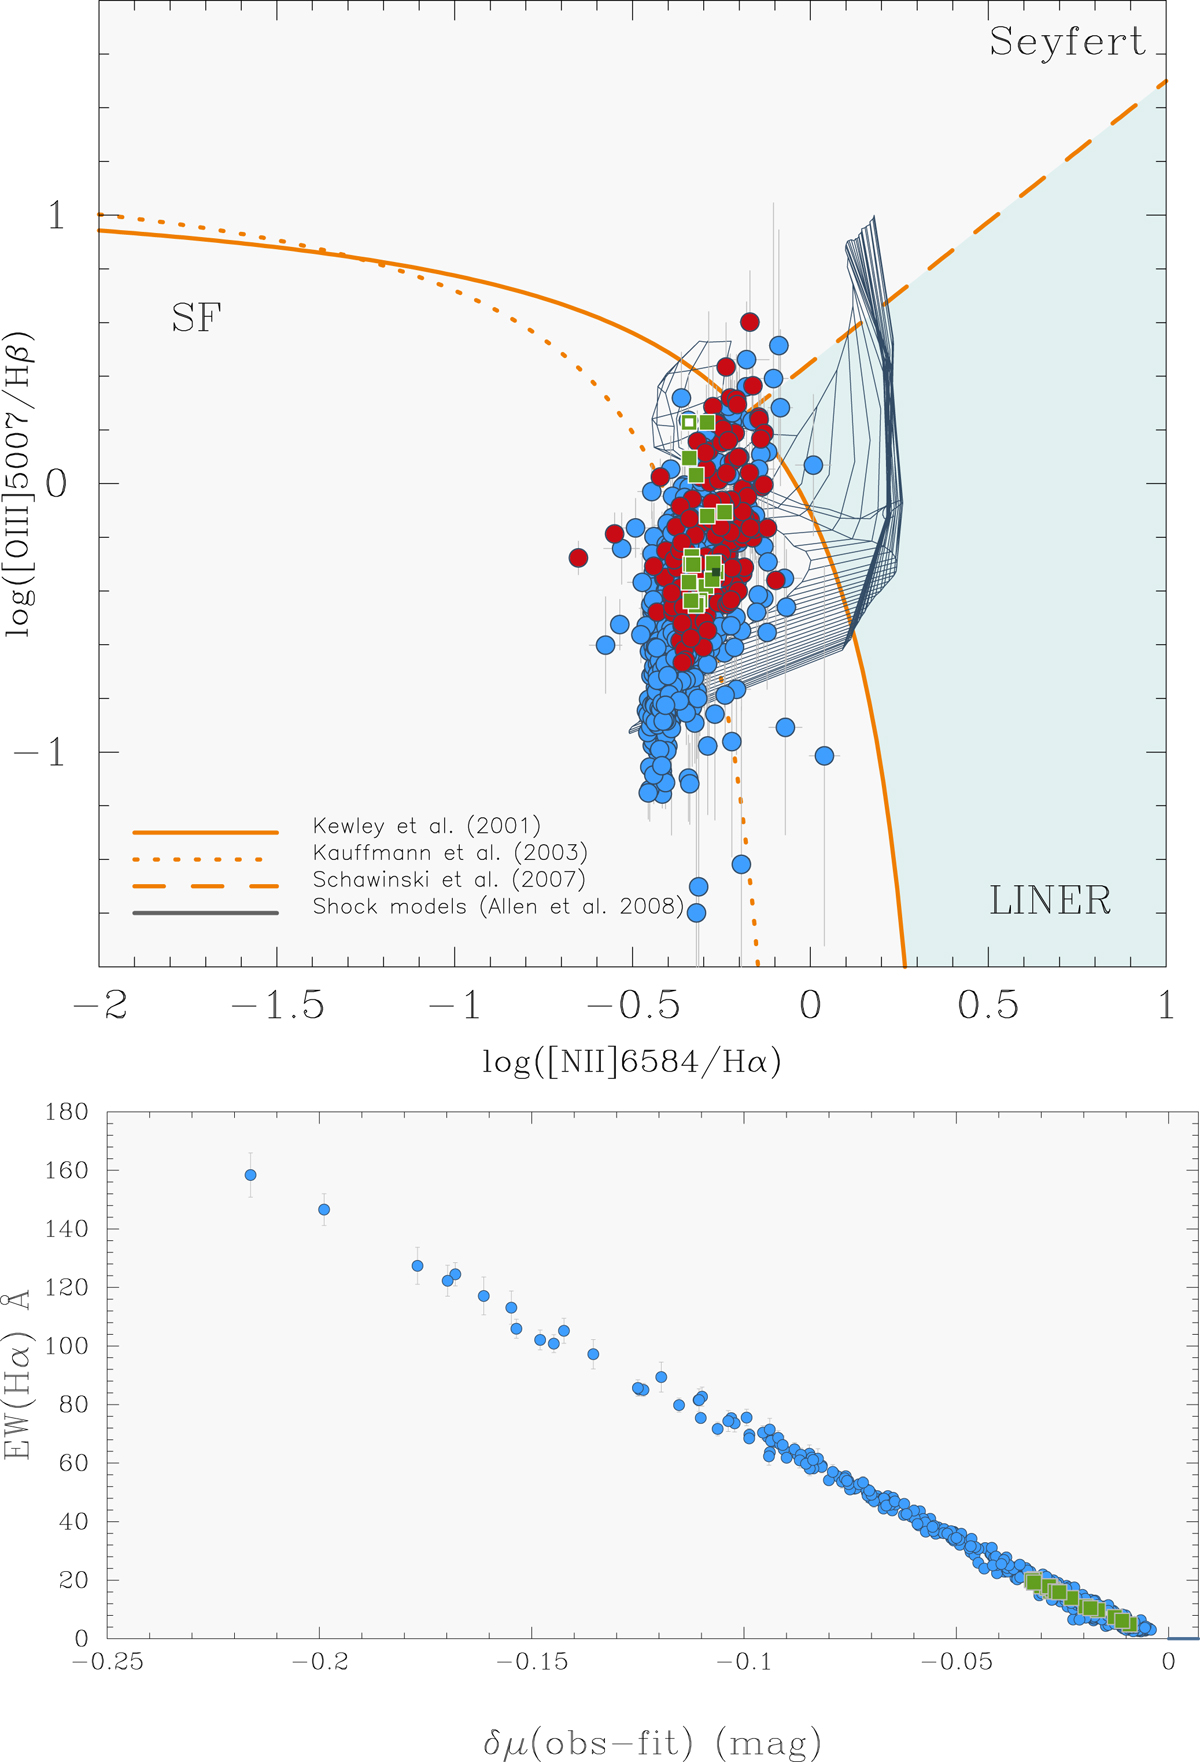
Fig. 7.
Download original image
Diagnostic emission-line ratios and photometric impact of nebular emission in NGC 0776. Upper panel: log([N II]6584/Hα) vs. log([O III]5007/Hβ) diagram. Single-spaxel determinations within RB and in the outer disk (red and blue, respectively) are shown with dots, whereas squares depict average values within isan. The locus that is characteristic of AGN and LINERs and the locus corresponding to photoionization by OB stars in SF regions are indicated with demarcation lines from Kauffmann et al. (2003, dotted curve), Kewley et al. (2001, solid curve), and Schawinski et al. (2007, dashed line). The grid of thin gray lines depicts the parameter space that can be accounted for by pure shock excitation, as predicted by Allen et al. (2008) for a magnetic field of 1 μG, and a range of shock velocities between 100 and 1000 km s−1 for gas densities between 0.1 and 100 cm−3. It is apparent that the diagnostic line ratios both for the bulge and outer disk fall close to the empirical envelope characterizing SF regions and in the locus of composite sources (i.e., between the curves by Kauffmann et al. and Kewley et al.). Lower panel: difference between the r-band magnitude of the observed spectrum and that of the stellar fit to it vs. EW(Hα) (Å) for individual spaxels (dots) and isan (squares). A linear fit (line) indicates that nebular line emission in this composite system enhances the r-band emission by ∼0.7 mag per 103 Å in EW(Hα).
Current usage metrics show cumulative count of Article Views (full-text article views including HTML views, PDF and ePub downloads, according to the available data) and Abstracts Views on Vision4Press platform.
Data correspond to usage on the plateform after 2015. The current usage metrics is available 48-96 hours after online publication and is updated daily on week days.
Initial download of the metrics may take a while.