Fig. 3.
Download original image
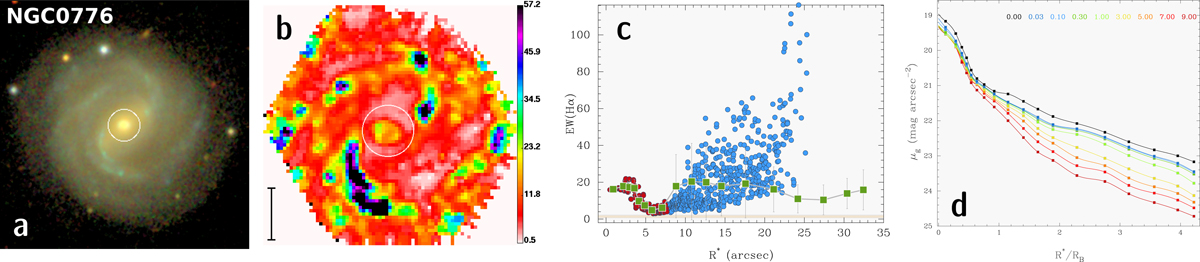
Synopsis of results obtained for the LTG NGC 0776 (D = 65.5 Mpc; log(ℳ⋆/M⊙) = 11.1) from spectral modeling of CALIFA IFS data. (a) True-color SDSS image composite of the galaxy. The circle depicts the isophotal diameter of the bulge (15![]() 3; Breda 2019). (b) EW(Hα) map of the galaxy displayed in the range between 0.5 Å and 57 Å. The vertical bar corresponds to a projected scale of 5 kpc. (c) Radial EW(Hα) profile, with dots showing determinations for single spaxels inside and outside RB (red and blue, respectively) and squares corresponding to the mean EW(Hα) within irregular isophotal annuli (isan) adapted to the morphology of the emission-line-free stellar continuum (see BP18 for details). Error bars show the standard deviation about the mean of single-spaxel determinations within each isan. The shaded gray horizontal stripe between 0.5 and 2.4 Å marks the range in EW(Hα) that can be accounted for by photoionization by the evolved (> 100 Myr) post-AGB stellar component (e.g., Cid Fernandes et al. 2011; Gomes et al. 2016a). (d) g-band SBPs of the galaxy after the suppression of stellar populations with ages younger than 0.03, 0.1, 0.3, 1, 3, 5, 7, and 9 Gyr (cf. the color-coding at the top right) from CALIFA IFS data. The profile for tcut = 0 (black) corresponds to the SBP that would be obtained when nebular line emission alone were removed.
3; Breda 2019). (b) EW(Hα) map of the galaxy displayed in the range between 0.5 Å and 57 Å. The vertical bar corresponds to a projected scale of 5 kpc. (c) Radial EW(Hα) profile, with dots showing determinations for single spaxels inside and outside RB (red and blue, respectively) and squares corresponding to the mean EW(Hα) within irregular isophotal annuli (isan) adapted to the morphology of the emission-line-free stellar continuum (see BP18 for details). Error bars show the standard deviation about the mean of single-spaxel determinations within each isan. The shaded gray horizontal stripe between 0.5 and 2.4 Å marks the range in EW(Hα) that can be accounted for by photoionization by the evolved (> 100 Myr) post-AGB stellar component (e.g., Cid Fernandes et al. 2011; Gomes et al. 2016a). (d) g-band SBPs of the galaxy after the suppression of stellar populations with ages younger than 0.03, 0.1, 0.3, 1, 3, 5, 7, and 9 Gyr (cf. the color-coding at the top right) from CALIFA IFS data. The profile for tcut = 0 (black) corresponds to the SBP that would be obtained when nebular line emission alone were removed.
Current usage metrics show cumulative count of Article Views (full-text article views including HTML views, PDF and ePub downloads, according to the available data) and Abstracts Views on Vision4Press platform.
Data correspond to usage on the plateform after 2015. The current usage metrics is available 48-96 hours after online publication and is updated daily on week days.
Initial download of the metrics may take a while.