| Issue |
A&A
Volume 643, November 2020
|
|
|---|---|---|
| Article Number | A119 | |
| Number of page(s) | 9 | |
| Section | Extragalactic astronomy | |
| DOI | https://doi.org/10.1051/0004-6361/202037932 | |
| Published online | 11 November 2020 | |
Dust and star formation in the centre of NGC 3311⋆
1
Departamento de Astronomía, Universidad de Concepción, Concepción, Chile
e-mail: tom@astro-udec.cl
2
European Southern Observatory, Karl-Schwarzschild-Str.2, 85748 Garching, Germany
3
Universidade de São Paulo, IAG, Departamento de Astronomia, Rua do Matão 1226, São Paulo, SP, Brazil
Received:
11
March
2020
Accepted:
3
August
2020
Context. NGC 3311 is the central galaxy of the Hydra I galaxy cluster. It has a hot interstellar medium and hosts a central dust lane with emission lines. These dust lanes are frequent in elliptical galaxies, but the case of NGC 3311 might be particularly interesting for problems of dust lifetime and the role of cool gas in the central parts.
Aims. We aim to use archival HST images and MUSE data to investigate the central dust structure of NGC 3311.
Methods. We used the tool PyParadise to model the stellar population and extract the emission lines.
Results. The HST/ACS colour map reveals the known dust structures, but also blue spots, which are places of strong line emission. A dusty “mini-jet” emanates from the centre. The distribution of the emission line gas matches the dust silhouette almost exactly. Close to the brightest Hα emission, the ratio [NII]/Hα resembles that of HII-regions; in the outer parts, [NII] gets stronger and is similar to LINERLow-ionization nuclear emission-line region -like spectra. The gas kinematics is consistent with that of a rotating disc. The Doppler shifts of the strongest line emissions, which indicate the areas of highest star formation activity, smoothly fit into the disc symmetry. The metallicity is supersolar. The presence of neutral gas is indicated by the fit residuals of the stellar NaI D absorption line, which we interpret as interstellar absorption. We estimate the mass of the neutral gas to be of the order of the X-ray mass. The dynamical mass infers a stellar population of intermediate age, whose globular clusters have already been identified.
Conclusions. Our findings can be harmonised in a scenario in which the star formation is triggered by the accretion of cold gas onto a pre-existing gas/dust disc or ring. Newly produced dust then contributes to the longevity of the dust.
Key words: galaxies: individual: NGC 3311 / galaxies: kinematics and dynamics / galaxies: star clusters: general
© ESO 2020
1. Introduction
NGC 3311 is the central galaxy of the Hydra I galaxy cluster. Its structural properties are naturally influenced by infall processes. For example, the rich globular cluster system indicate the early dissolution of dwarf galaxies and actual infall processes are morphologically and kinematically visible (Ventimiglia et al. 2010, 2011; Misgeld et al. 2011; Richtler et al. 2011; Coccato et al. 2011; Arnaboldi et al. 2012; Barbosa et al. 2016, 2018; Hilker et al. 2018).
These previous works dealt with the large-scale structure of NGC 3311. However, the central parts are also extremely interesting. NGC 3311 exhibits a central dust lane (Lindblad 1977; Wirth & Gallagher 1980) with a major axis length of about 800 pc, which is aligned with the major axis of the galaxy’s bulge. Vasterberg et al. (1991) performed the first CCD-photometry and spectroscopy of the central region of NGC 3311. They found a blue light excess (which in the present paper appears as the “blue spot”) and ionised gas with a [NII]/Hα-ratio indicating photons from massive stars. Moreover, they used the velocity profile of the gas as a rotation signature and quoted a dust mass of 3 × 10⁴ M⊙. Grillmair et al. (1994) showed the first Hubble Space Telescope (HST) image of the dust structure and quoted 4.6 × 10⁴ M⊙ as a lower limit for the dust mass. Ferrari et al. (1999) estimated a relatively low dust mass of 3100 M⊙, while van Dokkum & Franx (1995) quoted 1.4 × 10⁶ M⊙ for the sum of dust and gas. There is also ionised gas, for which Macchetto et al. (1996) found the HII mass to be of the same order.
This finding of nuclear star formation in a massive elliptical galaxy by Vasterberg et al. (1991) uncovered a phenomenon that until recently was thought to be very rare. Meanwhile, many examples of star formation in central galaxies of galaxy clusters have been found (e.g. Fogarty et al. 2015; Donahue et al. 2015; Bonaventura et al. 2017; Runge & Yan 2018). In the local Universe, NGC 3311 appears to be the nearest example. Although cooling of the hot gas seems to be a self-evident process for providing cold gas for star formation, some authors (Bonaventura et al. 2017; Runge & Yan 2018) argue against cooling flows as an immediate driver for central star formation, because the gas deposition rate by cooling is much higher than the observed star formation rate.
The finding of intermediate-age globular clusters (Hempel et al. 2005) indicates that star formation in NGC 3311 has been ongoing for a long time, which poses interesting questions for the origin and nature of the dust. Dust is found frequently in early-type galaxies (Ebneter & Balick 1985; Sadler & Gerhard 1985; Ebneter et al. 1988; Goudfrooij et al. 1994; van Dokkum & Franx 1995; Tran et al. 2001; Lauer et al. 2005). The variety of dust content and morphological appearance is very large. It ranges from very striking galaxy-wide dust patterns to tiny central dusty discs or rings. The main dust producers are conventionally thought to be winds from supernovae and from asymptotic giant branch (AGB) stars (e.g. Dell’Agli et al. 2017). These young populations are normally lacking in early-type galaxies, so the existence of dust has been thought to testify to the previous infall of dusty material. A further complicating circumstance is the very short timescale of dust grain sputtering by hot gas (typically 1–10 Myr), which would require recent dust injection for which there is no observational evidence. Hirashita et al. (2015) and Sansom et al. (2019) amongst others provide a review of the literature on dust in early-type galaxies. However, recent work suggests the need to significantly change this picture. Michałowski et al. (2019) measure the dust removal time in early-type galaxies by considering the age dependence of the dust mass-to-stellar mass ratio. They arrive at a half-mass lifetime of 1.75 Gyr, so the existence of dust without young populations is normal (while the physical processes of dust removal still remain obscure). They conclude that the dust in their galaxy sample is likely to be of internal origin, but that the dust yields of AGB stars are not high enough to explain the dust masses, so additional processes like grain growth in the metal phase may be important.
The process of dust sputtering is expected to be particularly efficient in NGC 3311 with its high central density of X-ray photons, but apparently this is not the case. The dusty centre of NGC 3311 and its associated ionised gas deserves a detailed investigation, especially by capitalising on the resolution of HST images. Data from the Multi Unit Spectroscopic Explorer (MUSE) of the European Southern Observatory open the possibility of studying the morphology of the dust and gas distribution, the gas metallicity, the ionisation sources, and the kinematical properties of the gas to infer its physics and origin. To be consistent with our previous works, we adopt a distance to NGC 3311 of 50.7 Mpc, corresponding to a scale of 262 pc arcsec−1.
2. Data and data reduction
MUSE is attached to Unit 4 of the Very Large Telescope of the European Southern Observatory (ESO). MUSE is a mosaic of 24 integral field units (IFUs), covering a field of 1 × 1 arcmin2 in the wide field mode. The pixel scale is 0.2 × 0.2 arcsec2. The spectral resolution varies from R = 2000 at 4700 Å to R = 4000 at 9300 Å, which are the extremes of the spectral range covered. The data consist of two exposures centred on NGC 3311 with exposure times 1402s and 1418s, respectively. They were observed on the nights of 27 December 2014 and 15 January 2015. These data (programme 094.B-0711(A); PI: M. Arnaboldi) have already been used by Barbosa et al. (2018) and we refer the reader to this publication for more details.
The ESO Phase 3 concept offers pipeline reduced data products through the ESO science archive. One cube (ADP.2017-03-27T12:49:43.627) combines the two exposures. However, the seeing is worse and because the signal to noise ratio (S/N) is less important than the spatial resolution, we work with the data product ADP.2016-06-20T22:49:26.325.fits (observed on the night of 27 December 2014), which shows a point spread function with a full width at half maximum (FWHM) = 0.7″. The pipeline is described in the manual, version 1.6.2. The basic reduction consists of applying muse_bias and muse_flat (no correction for dark currents), followed by the wavelength calibration with muse_wavecal. The line spread function has been calculated from the arc spectra using muse_lsf. For the instrument geometry, the tables are provided by ESO. Twilight exposures were used for the illumination correction, applying muse_twilight. The previous recipes produce frames/tables that now enter the recipe muse_scibasic that performs bias subtraction, flat field correction, wavelength calibration, and more. The recipe muse_scipost performs flux calibration and calculates the final data cube or as a choice, fully reduced pixtables that are combined by muse_exp_combine to produce a data cube with combined individual exposures. The pipeline also corrects for telluric absorption features. We extract the spectra from the data cube using QFitsView1.
Moreover, we use the following data products from the Hubble Legacy archive: HST_06554_03_wfpc2_f814w_pc_drz.fits and HST_06554_03_wfpc2_f555w_pc_drz.fits (proposal Nr: 6554; PI: J. Brodie) as well as HST_7820_01_NIC_NIC2_F160W (proposal Nr:7820; PI: D. Geisler). These HST/planetary camera images cover the central 30″ × 30″of NGC3311 with a pixel size of 0.05″. The exposure times are 3700 sec for the F555W-filter, 3800 s for the F814W filter, and 10239.5 s for the F160W-filter. The data have already been used for work on globular clusters in Brodie et al. (2000) and Hempel et al. (2005).
3. HST imaging
3.1. Structural properties of the dust lane
The left panel of Fig. 1 shows the central 10″ × 10″ section of the F555W-image (note that the same section has been shown previously by Grillmair et al. 1994, however, with a quality worse than the present HST legacy product). The dust lane appears as a scraggy elliptical structure. The extension of the semi-major axis is about 370 pc. The position angle is 46.3 ° ±3°, the uncertainty being our estimate to define its major axis. This is in excellent agreement with the outer photometric isophotes of the stellar light, which is generally observed for central dusty discs. We employ the IRAF task ellipse to the F555W-image and get a smooth variation between a position angle of 52° at a radius of 50 pix (1310 pc) and a positin angle of 40° at a radius of 200 pix (2600 pc). The photometric centre of the isophotes within this radius interval coincides with an uncertainty of two to three pixels, with the optical brightness maximum near the centre of the dust lane. A bright spot appears at the eastern border of the dust lane, which we will discuss in the next section. Two extensions of the central dust lane are striking: to the south a vertical structure, to the north-north west a straight and narrow dust band, emerging from near the centre and ending in a knot-like feature with a total projected length of about 700 pc. One also observes a population of about a dozen bona fide star clusters, particularly in the southern part. Brodie et al. (2000) used the present images to investigate globular cluster metallicities, but do not comment on this very central population.
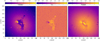 |
Fig. 1. Left panel: central 10″ × 10″ (WFPC2, planetary camera, F555W) of NGC 3311. North is up, east is to the left. The overall symmetry can be described as a disc with a radial feature pointing to the north-north-west that seems to emerge almost exactly from the centre. There is a population of about a dozen bona fide star clusters (little bright dots) fringing the border of the dust structure. Middle panel: V − I colour map. The blue spot is bluer by 0.5 mag than the unreddened galaxy light. Right panel: H-band image of the same field as in the other panels. The blue spot is still the brightest object, but three or four other objects (globular clusters?) become visible. Their integrated light appears as the “middle peak” in the paper. |
The middle panel shows a V − I colour map, constructed by −2.5 × log(F555W/F814W) and transformed approximately to V − I by adding 0.75 mag. This matches the aperture photometry of Prugniel & Heraudeau (1998) who give V − I = 1.33 for an aperture of 12″. The most striking feature in the colour map is the blueish colour of the bright spot, seen previously by Vasterberg et al. (1991). It is bluer than the environmental stellar population by 0.5 mag. The star clusters appear typically a few 0.1 mag bluer than the galaxy light. This is in line with Hempel et al. (2005) who found a significantly high fraction of intermediate-age globular clusters in this central region of NGC 3311.
The right panel shows the same field in the infrared H-band (F160W-filter). One now sees that the blue spot is the least obscured one of a projected chain-like configuration of four clump-like objects within the still visible dusty ring. Their integrated light appears as the “middle peak” in the paper.
3.2. Bright blue spot in the optical
This object appears in the Hubble Source catalogue (HSC) with the identifier ID 4201924376 and with W2-F555W = 22.44 (ABMAG), which is almost identical to the V-magnitude. Because it is on top of the brightest regions in the galaxy, its brightness and colour are subject to the exact definition of the background. To have an independent value, we applied a median filter of 10 × 10 pixels to the planetary camera image and subtracted this filtered image from the original. We performed aperture photometry with a radius of three pixels of selected point sources that are also HSC-objects to establish a zero point. Our result is W2-F555W = 21.2, significantly brighter than the HSC value. This corresponds to an absolute mag of MV = −12.3 to which an extinction correction must still be applied. We estimate the reddening from the Balmer decrement in the extracted spectrum of the blue spot (Eq. (1) and Table 2). In ignorance of the reddening law of the dust, we identify the absorption in the F555W-filter with the absorption in the V-band and apply Eq. (1) to get AF555W = 1.4 ± 0.4 mag, where the adopted uncertainty is simply the uncertainty in the R-band from Table 2. The real uncertainty may be larger. The absolute magnitude is then MF555W = −13.7 with an uncertainty that may exceed 0.5 mag because of the additional distance uncertainty. Therefore the optical properties are not well constrained and in the following we omit to give uncertainties. The reddening is E(V − I) = 1.6 × E(B − V) (Schultz & Wiemer 1975), V − I ≈ 0.8, and (V − I)0 ≈ 0.06. For comparison with recent stellar population models, we employ the webtool CMD (version 3.3) (Marigo et al. 2017). We use standard parameters, a Kroupa IMF, UBVRIJHK as the photometric output, and the option of simulating a stellar population of 104 M⊙. With super solar abundance, as suggested by Fig. 2, Z = 0.04, and an age of 107 yr, the resulting colour is V − I = 0.55. Lowering the age to 5 × 10⁶ yr, the colour is V − I = −0.24. The respective mass-to-light ratios are M/LV = 0.05 and M/LV = 0.026. The masses for the blue spot corresponding to these models are 1.2 × 10⁶ M⊙ and 6.2 × 10⁵ M⊙. The light distribution is not symmetric. Ignoring this, a Gauss fit gives FWHM = 5.5 pixels. The point spread function is about two pixels, so five pixels or 65 pc is the approximate extension.
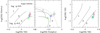 |
Fig. 2. Diagnostic graphs for our four characteristic spectra. Red: total, green: blue spot, blue: middle peak, cyan: the rest (see Table 1). The line ratios from Table 2 are compared to the HII-region models from Dopita et al. (2013) (for a Boltzmann distribution of electrons) with the ionisation parameter log q and three oxygen abundances in solar units (1×, 2×, 3×) as parameters. The solid lines are lines of constant abundance and varying log q. The range of log q values is indicated in the left panel, which is the same for all panels. The dotted line in the middle panel is the line separating HII-regions from AGN-like spectra according to Kauffmann et al. (2003). As noted by Dopita et al. (2013), the right diagnostic graph seems to provide the cleanest separation of log q and oxygen abundance. Spectra 2 and 3 (blue spot and middle peak) show the characteristics of a HII-region and a super solar metallicity in all graphs. The other spectra show contributions from other ionising sources, presumably post-AGB stars. The right panel is apparently insensitive to this circumstance. |
We probably see an extended region of star formation where an unresolved massive star cluster is embedded. This may be a recent example of globular cluster formation in NGC 3311, which has been ongoing for many Gigayears. Within 1″ to the west of the blue spot, some faint loops/filaments are discernible with one point source projected onto a filament. The colour appears not as blue as the blue spot, but distinctly bluer than the galaxy light, which may be a population that originated in earlier star forming events.
3.3. Stellar masses from infrared brightness
In the H-band the blue spot is still the brightest object, but not longer extraordinarily bright. Assuming that there is no obscuration at all, one might derive a lower limit for the stellar mass. The field is too crowded for precision photometry. We cover the blue spot with a window of 5 × 5 pixels and the interior of the dusty ring with three adjacent windows of the same size. Subtracting the flux immediately outside the dust and following the instructions for getting photometry from NICMOS fluxes, we arrive at MH = −14.2 for the blue spot and MH = −15.2 for the total brightness within the dust ring.
The above models that were used for optical photometry also provide the H-band. The interpretational problem is now that the H-luminosity increases strongly within the age interval 5 × 10⁶ to 107 yr. With the above brightnesses, for the blue spot one gets 1.6 × 10⁶ M⊙ for the 5 × 10⁶ yr model and only 5.5 × 10⁴ M⊙ for the 107 yr model (we adopt a solar absolute H-magnitude of 3.32). Corresponding to the difference in magnitude, the stellar masses inside the dust ring for the two model ages are 4 × 10⁶ M⊙ and 1.4 × 10⁵ M⊙, respectively. It is also probable that older populations contribute in an unknown manner to the H-luminosity.
4. Morphology and distribution of ionised and neutral interstellar matter as seen with MUSE
4.1. Separation of stellar light from interstellar emission or absorption
To isolate the emission lines, the spectra of the galaxy light have to be fitted by a population synthesis approach and then subtracted. The interstellar NaI D absorption lines also appear as residuals. This can be done by various methods, for example STARLIGHT (Cid Fernandes et al. 2005) or PPXF (Cappellari 2017), which are publicly available. In this paper, we employ the PyParadise software (Husemann et al. 2016), which is an extended python version of Paradise. Details of the fitting procedure are explained in the appendix of Walcher et al. (2015) to which we refer the reader.
To prepare the cube for the spectral synthesis fit, its pixels are resampled by a Voronoi tessellation to produce areas of equal S/N. In our case the S/N was 15 and the number of bins was 30 279. The tessellation is visible in Figs. 3 and 4.
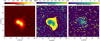 |
Fig. 3. Central 10″ × 10″ of the MUSE maps. North is up and east is to the left. Left panel: Hα-map. The dominant source is the blue spot, the second peak is approximately located near the centre of the dust lane. Middle panel: ratio [NII]/Hα. At the brightest Hα peaks, the ratio resembles an HII-region. In the outer parts, [NII] gets stronger like in LINER-like spectra, indicating the contribution of other ionising sources like the post-AGB stars of the old stellar population. Right panel: map of Balmer decrements mapping the extinction of the emission line region. |
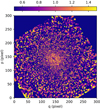 |
Fig. 4. A 1′ × 1′ map of the equivalent width (EW, unit Å) of the residual interstellar NaI absorption lines. North is up, east is to the left, and the MUSE pixel scale is 0.2″. In contrast to Figs. 1 and 3, we want to show the largest area possible. The EWs refer to the sum of both lines of the doublet. Structures in the cold, atomic gas are not visible, except the central dust lane that appears as a shadow. The lowest EWs are already about 0.5 Å, so we expect more cold gas outside the MUSE field. The gas probably has cooled down from the hot X-ray gas. |
4.2. Strong emission lines
The most obvious features in the residual spectra are the strong emission lines, familiar from HII-regions: Hβ, [OIII]5007 Å, [NII]6549 Å, Hα, [NII]6583 Å, [SII]6617 Å, and [SII]6634 Å (see Fig. 5). Moreover, a residual of the stellar NaI D lines remains, which we interpret as an interstellar NaI D absorption (see next section). The most interesting maps are shown in Fig. 3. All emission features are strongly confined to the central region.
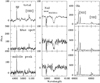 |
Fig. 5. Residual spectra of three characteristic regions after subtracting the galaxy light are shown in those three spectral regions where emission lines are visible. The appearance of the spectra resembles that of a normal HII-region with Hα being much stronger than [NII]. The fluxes are relative fluxes. |
The main observation regarding the distribution of ionised gas is the close spatial coupling to the dust. This even includes the irregular extensions of a presumably central dusty disc or ring-like structure. This finding is not special to NGC 3311, but is observed generally in early-type galaxies, as shown for example in Finkelman et al. (2012).
In the brightest parts, the emission line spectra resemble those of HII-regions. In the outer and fainter parts of the dust structure, the low-ionisation lines get stronger, presumably due to a rising contribution from ionising sources like post-AGB stars and/or Low Mass X-Ray (LMXR)-binaries.
The spatial distribution of the ionised gas, on the other hand, is different from that of typical HII-regions where the dusty parts mark high density peaks in an overall more extended gaseous halo. The close match of the gas extension with the dust extension speaks against the origin of the gas being cooling out from the hot interstellar medium.
4.3. The NaI D absorption lines
The NaI D doublet 5890 Å/5896 Å absorption is one of the strongest stellar lines. In each of the characteristic spectra (see Sect. 5), we observe that the stellar models do not fit the entire deep trough, but that a strong broad residual remains. The reality of this residual would mean the discovery of cold gas in a hot, X-ray bright environment (see the discussion below for literature). While the occurrence of cold gas in the very centre may be plausible through the short cooling times, we also observe the NaI D residual as a quite extended feature. Figure 4 shows a map of the equivalent widths of the NaI residuals. This map has been constructed by division by the model continuum and integration of the normalised flux over an interval of 40 Å.
Because the stellar line is so strong, one could suspect a slight fitting defect of the stellar component (Concas et al. 2017). An argument for its reality is that in the region of the blue spot, the D1 and D2 lines get marginally resolved. The velocities of the component agree well with the NII velocity of the same spectrum, which would not be expected if the residuum was artificial. And finally, we have another MUSE example (NGC1316) where there is no doubt that the residual NaI D absorption traces atomic gas. More remarks are made on this in Sect. 7.1.
5. Characteristic spectra and line fluxes
We define four characteristic spectra: a grand total with an extraction radius of 2.4″ around the galaxy centre, the blue spot, the middle peak, and a spectrum with the blue spot and middle peak subtracted. Figure 5 shows three of them.
5.1. Line ratios and oxygen abundances
Flux values are measured with splot under IRAF in the continuum subtracted spectra. In order to avoid reddening corrections, we only consider line ratios constructed by neighbouring lines. Table 1 lists the measurements. The comparison with photoionisation models that predict strong line fluxes depending on the ionisation rate q2 and oxygen abundance, is appropriate. Dopita et al. (2013) give a summary of the history of strong line diagnostics and a series of diagnostic graphs of which only a few are interesting for us because of the restricted wavelength range. They recommend in particular the graphs [OIII]/Hβ versus [NII/][SII] and [OIII]/[SII] versus [NII/[SII], which permit the cleanest separation between ionisation rate and oxygen abundance. Here, the measurements refer to the sum of both [SII]-lines and the [NII]-line at 6584 Å, respectively. In addition we show the graph [OIII]/Hβ versus [NII]/Hα to demonstrate that the line ratios are still in the range expected for HII-regions.
Absolute line fluxes in units of 10−16 erg s−1 cm−2 for our four characteristic spectra.
A new feature in the models of Dopita et al. (2013) is that the electron energies follow a κ-distribution, which in the case κ = ∞ is equal to a Boltzmann distribution. According to Ferland et al. (2016), the thermalisation of electrons with a finite κ-value occurs on shorter timescales than heating or cooling, which makes κ = ∞ the preferred choice. For a Boltzmann-distribution of electron energies, Fig. 2 shows HII-region models of three different oxygen abundances (1, 2, 3; in solar units). The ionisation rates range from log(q) = 6.5 to log(q) = 8.5. The good separation of log(q) and oxygen abundance z in the left and right panel is obvious. Moreover, both graphs appear to be insensitive to the LINER-contribution because of the good agreement of abundances in spite of the large spread in [NII]/Hα.
5.2. Hα-flux
We calculate the total Hα using spectrum 1 in Table 1. The observed intensity within 12 pixels is 51.9 × 10⁻¹⁶ erg s−1 cm−2, corresponding to a flux of 1.5 × 1039 erg s−1, in very good agreement with Macchetto et al. (1996), who give 51.9 × 10⁻¹⁶ erg s−1 cm−2. This flux must be corrected for extinction. We estimate the reddening by using the Balmer decrements from Table 2. The reddening is calculated adopting the standard relation

Diagnostic line ratios for our four characteristic spectra.
(e.g. Momcheva et al. 2013). Then we adopt the reddening law of Rieke & Lebofsky (1985) (this may be incorrect, but there is no way of deriving the correct reddening law) and use the R-absorption as the absorption in Hα: AHα = 2.3 × E(B − V). These values are listed as the last column in Table 2. At our adopted distance, the total flux of spectrum 1 is (3.3 ± 0.7)×1039 erg s−1, where the distance uncertainty is estimated to be 10%. Macchetto et al. (1996) give an HII mass of 2100 M⊙. However, to estimate the mass of HII from our data appears problematic. The normal procedure is to use the Hα-flux, the electron density, and the electron temperature to calculate the HII-mass, for example employing Eq. (10) of Kulkarni et al. (2014; see also Goudfrooij et al. 1994; Macchetto et al. 1996). The electron density correlates with the ratio of the [SII] lines, 6717/6731. Proxauf et al. (2014) give an updated relation (their Eq. (3)). However, the line ratios in Table 1 are too high and the corresponding electron densities much too low to fit in the interval covered by the calibration relation. One reason can be that the subtraction on the synthesised galaxy spectrum leaves a residual at the short-wavelength base of the S[II]6717-line. Stretching the uncertainties, a line ratio of 1.4 for the total spectrum is a one-sigma deviation. Adopting this value and applying the respective formulas of Kulkarni et al. (2014) and Proxauf et al. (2014), one gets an HII-mass of 4.8 × 10⁵ M⊙ for an electron temperature of 10 000 K, much higher than given by Macchetto et al. (1996).
5.3. HI mass
We estimate the mass of HI derived from the equivalent widths (EWs) of the residual NaI absorption. The residual nature without any calibration makes it impossible to assess the robustness of such an estimate.
For a relation between EW and hydrogen column density, we use Eq. (1) of Murga et al. (2015) for the sum EW(D1+D2). With a reasonable precision (about 10% for the interval 0.5 < EW(D1 + D2) < 2.0), one can simply write
![$$ \begin{aligned} N(\mathrm{HI})/[10^{21}\, \mathrm{cm}^2] = 2\times \mathrm{EW}\mathrm{(D1+D2)}. \end{aligned} $$](/articles/aa/full_html/2020/11/aa37932-20/aa37932-20-eq2.gif)
Murga et al. (2015) emphasise that the relation already starts to saturate at EW = 0.5 Å. Therefore we can only estimate a lower limit. On the other hand, the metal abundance is higher than in the Milky Way, which gives less HI per unit sodium. The mean EW in the MUSE field (14.5 × 14.5 kpc2) is 0.96 Å. With the above formula this results in a mass of 3 × 10⁹ M⊙, which, however is strongly concentrated towards the centre. Whatever the exact number, the HI mass within the MUSE field appears to be of the same order as the X-ray mass, which according to Hayakawa et al. (2006) is 2.2 × 10⁹ M⊙ within a radius of 14.5 kpc. This is not much in comparison with the molecular gas mass found in cooling flows (Castignani et al. 2020). The fact that the dynamical mass derived from X-rays using the assumption of hydrostatical equilibrium is lower than the baryonic mass alone (Richtler et al. 2011), now has an interpretation in that the X-ray gas alone does not provide hydrostatic equilibrium. More remarks on this are offered in Sect. 7.1.
6. Kinematics
We measure the velocity field with Qfitsview on the residual frame of PyParadise for Hα. Figure 6 shows the velocity field. The first observation is that the kinematical symmetry resembles the spatial symmetry, which gives strong support for the interpretation of a rotating disc. Adopting 4.9 ± 0.2″ and 3.3 ± 0.2″ for the major and minor axis, respectively, the cosine of the inclination angle is 0.74 ± 0.07. We measure a projected rotation velocity of 45 ± 10 km s−1. A deprojection gives 61 ± 15 km s−1 for the rotational velocity at a radial distance of 570 pc. The enclosed mass is  with G = 0.0043 with the units km s−1, years, and solar masses, which for R = 570 pc gives 4.93 × 10⁸ M⊙. The model of Richtler et al. (2011) for the stellar light with a stellar M/LR = 6 and a distance of 48 Mpc encloses a mass of 1.87 × 10⁹ M⊙. This is clearly not a good agreement, which would need a circular velocity of about 120 km s−1. Possible explanations are an underestimated inclination angle and/or an intrinsic geometry that deviates from a circular disc. A further possibility is that the stellar M/L value is too high. A kinematical mass of 8.6 × 10⁸ M⊙ would still be consistent with our measurement (the mass of the supermassive black hole enters as a further unknown parameter, but see the remarks in Sect. 7.2.4). This would require a mean M/LR value of around three in order to agree with the photometric model. In other words, it demands a population mix equivalent to an intermediate-age population of about 2.5 Gyr as a single stellar population (SSP). This is very interesting in view of the findings of Hempel et al. (2005). They studied the central globular cluster population of NGC 3311 using HST infrared imaging (see Sect. 2) and identified a surprisingly large fraction of young- and intermediate-age globular clusters. This makes the existence of a field population of an intermediate age highly plausible and fits our proposed scenario well (see Sect. 7.3).
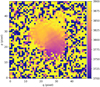 |
Fig. 6. Velocity map in Hα. The size is 10″ × 10″. North is up, east is to the left. The appearance suggests an inclined rotating disc, but the derived circular velocity is too low for a good agreement with dynamical models for the stellar body. We note that the mini-jet has a higher velocity than the systemic velocity, which is consistent with being expelled from the centre. |
The “mini-jet” has a radial velocity of 3900 km s−1, higher than the velocities in the dust structure. That is consistent with being expelled from the centre. If we assume the velocity relative to the systemic velocity to be 120 km s−1, and the extension to be 2.8″, the kinematic age (extension divided by velocity) is about 5 × 10⁶ yr, under the assumption that the emission lines trace the dust kinematics. Also the southern extension shows a velocity that smoothly connects with the disc.
We also note that there is no striking interruption in the smooth velocity map that can be related to the blue spot, although its light contribution is dominant. That indicates that star formation is an integral part of the rotating gaseous disc or ring.
7. Discussion: A unifying scenario
The old and new findings to be explained are: the mere existence of dust (old), alignment of the dusty disc or ring with the bulge of the galaxy (old), supermetallicity (new), HII-regions from star formation (new), smooth HII-kinematics (new), the spatial match of dust and emission lines (new), and the existence of atomic gas (new). In the following, we discuss these findings in the light of the current literature.
7.1. Cold gas in the hot halo of NGC 3311
The existence of cold atomic gas within a hot gaseous background is of course no surprise. Cooling flows in the central parts of galaxy clusters even show star formation at a much higher rate than is observed in our case (e.g. McDonald et al. 2015). While the multi-phase nature of the hot gas is expected (Gaspari et al. 2013, 2017), the interpretation of the residual NaI D absorption as being of an interstellar nature is not commonly accepted, although the identifications of cold gas traced by sodium in M87 (Carter et al. 1997) and NGC 4696 (Sparks et al. 1997) are robust. Jeong et al. (2013) and Park et al. (2015) investigate “sodium excess objects” in the Sloan Digital Sky Survey (SDSS) and conclude that the sodium in early-type galaxies is indeed of a stellar nature in early-type galaxies, but of an interstellar nature in galaxies with active star formation. Concas et al. (2017), on the other hand, use the NaI D absorption as a tracer of cold gas kinematics in a large sample of SDSS galaxies. Smith & Edge (2017) identified excess NaI D absorption in the central galaxy of the galaxy cluster Abell 3716. A further interesting case is NGC 6166, the central galaxy of Abell 2199. Bender et al. (2015) noted the narrowness of the NaI D lines with respect to other strong absorption lines. Without further analysis they attributed that line to an interstellar medium.
Cold atomic gas in NGC 3311 is observed outside the central region, while the emission lines are strictly confined to the dust structure. Star formation needs molecular gas, but we do not know if molecules coexist like in other central galaxies (Castignani et al. 2020; Olivares et al. 2019). Because molecules mainly form on the surface of dust grains (e.g. Cazaux & Tielens 2004), it is plausible that the dusty region provides the molecular gas needed for star formation once the cold gas comes into contact with dust.
7.2. Dust
In the following, we discuss several aspects regarding the occurence of dust in NGC 3311.
7.2.1. Sputtering
The mere existence of dust in the centre of NGC 3311 (and other elliptical galaxies) would be difficult to understand if the sputtering timescale due to the exposition of dust grains to a hot interstellar medium, as it exists in NGC3311, were indeed extremely short. Following Hirashita & Nozawa (2017; their Eq. (10)) and adopting a central electron density of 11.7 (Hayakawa et al. 2006), a grain size of 1 μm, and a molecular weight of μ = 0.6, the sputtering timescale is about 104 yr. At larger radii, the timescales are longer, the densities are lower, and in reality dust grains may be shielded, but sputtering of dust must be a very rapid process, as has been assumed in recent simulations of intergalactic dust in galaxy clusters (Vogelsberger et al. 2019). However, a dust removal timescale of 1.75 Gyr for early-type galaxies, as found empirically by Michałowski et al. (2019), contradicts strongly the sputttering timescale, but the physical processes that control the dust removal are still unknown and the origin of the dust is elusive. In the next sections, we will comment on different possibilities.
7.2.2. Infall
The alignment of the dusty disc with the major axis of the bulge in NGC 3311 (and many other cases) argues against the dust being donated by an infalling dusty galaxy, because there is no physical reason for the angular momentum vector of the dust being parallel to the angular momentum of the much older stellar body. Moreover, the close spatial match of ionised gas and dust suggests that the HII-gas also contradicts this kind of scenario. The low dust masses involved correspond to dwarf galaxy masses, while the high metallicity would demand a massive galaxy. As Michałowski et al. (2019) showed, dust can be old. It is therefore a plausible assumption that the present dust is the debris of a larger gaseous and dusty structure that formed with the stellar body. Central dusty discs are relatively frequent in elliptical galaxies without any signs of a merger remnant. Such a scenario would predict the intermediate-age globular cluster population found by Hempel et al. (2005) to have a disc-like distribution, which could be easily tested.
7.2.3. Dust from young stars
This possibility demands that the dust has been produced by the young stellar population through supernovae and/or AGB winds. At these high metallicities, dust formation is very effective. Figure 2 of Ginolfi et al. (2017) shows that at even lower metallicities, a dust mass of 103 M⊙ may be produced by a stellar mass of 107 M⊙ (this dust mass does not respect a probably clumpy structure of the dust below the resolution limit, in which case the mass can be much higher). This would be in at least partial agreement with a standard relation between Hα-fluxes and stellar mass. For the star formation rate, Kewley & Dopita (2002) give
![$$ \begin{aligned} \mathrm{SFR} [M_\odot /\mathrm{y}] = 4.5\times 10^{-42} L(\mathrm{H}\alpha )\mathrm{[erg\,s^{-1}]}, \end{aligned} $$](/articles/aa/full_html/2020/11/aa37932-20/aa37932-20-eq4.gif)
which with our numbers translates into 1.7 × 10⁻³ M⊙ yr−1. A stellar mass of 107 M⊙ can hardly be produced with this low star formation rate, but it could have been higher in the past. The probable existence of intermediate-age populations (Hempel et al. 2005) opens this possibility. The irregular shape of the dusty disc, on the other hand, may have been caused by stellar winds and supernovae from the young stellar population.
7.2.4. Dust from nuclear winds
The dusty mini-jet emanates from the nucleus. Dusty outflows from AGNs have been discussed for some time (Konigl & Kartje 1994). In these models, accretion from the dusty torus is subject to radiative and hydrodynamic pressure and results in a bipolar outflow. Modern parsec-scale IR interferometric observations of the active nuclei of nearby Seyfert galaxies show the mid-IR emission coming mainly from the polar region of the supposed dusty torus (e.g. Hönig et al. 2013). Outflow models with dusty winds have been presented that claim a much better agreement with the morphology of highly resolved nuclear regions of nearby Seyfert galaxies (Hönig & Kishimoto 2017).
Could a nuclear dusty torus be the source for the dusty jet feature? NGC 3311 is too distant for a precise mass determination of its supermassive black hole (SMBH). We adopt σc = 180 km s−1 as the central velocity dispersion (e.g. Hilker et al. 2018) and use Eq. (2) of Graham et al. (2011) to estimate the black hole mass, for which one gets 108 M⊙ with a scatter in dex of 0.37. For the relation between the mass of the dusty torus and the SMBH mass, we refer to Fig. 11 of Mor et al. (2009), where a loose correlation of the torus mass with the SMBH mass is visible. A SMBH of 108 M⊙ corresponds to a torus mass of a few times 104 M⊙ of dust. The dust mass of the jet feature therefore might easily be provided by a dusty torus.
If the dust has its origin in the nucleus of NGC 3311, one should also expect to see similar features in other galaxies. One can indeed easily verify by simply looking at HST archival images that in many nearby dusty early-type galaxies, dust filaments emerge from the nuclear region. A particularly nice example is NGC 5102. Surprisingly, there is hardly any literature on this phenomenon. A spectacular object in that respect is NGC 1316 (Fornax A), where the NaI D lines precisely trace the dust structures (Richtler et al. 2020). It is found not only in absorption, but also in emission, indicative of a galactic wind. There is much evidence that this wind is powered by a nuclear dusty outflow.
7.3. Unifying scenario
Given the above points, the following scenario emerges. Cooling of the local hot gas provides a source for material that becomes suitable for star formation only after mixing with the dusty disc, where dust cooling and molecule formation (e.g. Cazaux & Tielens 2004; Vogelsberger et al. 2019) promote the formation of high density peaks (a variation of “cold accretion”). Analogously to the cold accretion in galaxy formation models (Sancisi et al. 2008; Kleiner et al. 2017), such accretion could also alter the dynamics of a disc, being the cause of warps. The star formation rate is controlled by the deposition rate of dense, molecular gas, which might be lower than the cooling rate of the X-ray gas. Moreover, new young stellar populations provide dust and thus contribute to the longevity of dust structures. The current star formation, which is evident from the HII emission line ratios, was not a singular event in the history of NGC 3311. The existence of a stellar population component of intermediate age in the central regions of NGC 3311 is made manifest by its associated globular clusters (Hempel et al. 2005).
8. Summary and conclusions
On the basis of HST/ACS and NICMOS imaging as well as MUSE data cubes, we investigated the central region (< 1 kpc) of NGC 3311, the central galaxy of the Hydra I cluster, focusing on the central dust lane and emission lines. Our results are the following. The dust lane is a dusty ring-like feature that obscures an extended central star forming region. The brightest spot in the V-band appears strikingly blue on a HST/ACS V − I colour map. As the H-band image shows, it is the less obscured part of this region. The stellar mass involved in star formation amounts to a few times 106 solar masses. The line emission of the gas traces the shape of the dust pattern precisely. There is no ionised gas outside the dust features, which makes an external origin improbable. Therefore the dust must be old, which contradicts short sputtering timescales.
The emission line ratios are typical for HII-regions, which is proof that OB-stars are the main ionisation sources. The oxygen abundances that are derived from strong line ratios are supersolar. The velocity pattern of the gas indicates a rotating disc. The rotation parameters demand a low stellar M/L, the SSP age inside 500 pc being about 2.5 Gyr. This can be seen as a confirmation of the existence of an intermediate-age population that has previously been identified through globular cluster ages (Hempel et al. 2005). This moreover speaks for the longevity of the dust. We observe a dusty mini-jet with a projected length of 730 pc and a kinematical age of 5 × 10⁶, which is kinematically distinct from the dust pattern and emanates from the centre.
Residual interstellar NaI D-absorption is visible in the entire MUSE field, although strongly concentrated in the centre. This is one of the very few cases where cold gas in early-type galaxies becomes manifest through the sodium lines.
All these findings are best understood within a scenario that describes the cooling of hot X-ray gas in the inner halo that mixes with the dusty disc, experiences further cooling, and molecule formation. The subsequent existing young stars provide more dust, which contributes to the longevity of the dust patterns.
Acknowledgments
We thank the anonymous referee for a constructive and helpful report. Bernd Husemann provided PyParadise. His assistance was essential for this work. We further thank the language editor for her careful work. T. R. acknowledges support from the BASAL Centro de Astrofísica y Tecnologias Afines (CATA) PFB-06/2007. This work has strongly benefitted from TR’s visit at ESO/Garching under the ESO science visitor programme. TR cordially thanks the Astronomisches Institut der Ruhr-Universität Bochum for hospitality.
References
- Arnaboldi, M., Ventimiglia, G., Iodice, E., Gerhard, O., & Coccato, L. 2012, A&A, 545, A37 [NASA ADS] [CrossRef] [EDP Sciences] [Google Scholar]
- Barbosa, C. E., Arnaboldi, M., Coccato, L., et al. 2016, A&A, 589, A139 [NASA ADS] [CrossRef] [EDP Sciences] [Google Scholar]
- Barbosa, C. E., Arnaboldi, M., Coccato, L., et al. 2018, A&A, 609, A78 [NASA ADS] [CrossRef] [EDP Sciences] [Google Scholar]
- Bender, R., Kormendy, J., Cornell, M. E., & Fisher, D. B. 2015, ApJ, 807, 56 [NASA ADS] [CrossRef] [Google Scholar]
- Bonaventura, N. R., Webb, T. M. A., Muzzin, A., et al. 2017, MNRAS, 469, 1259 [NASA ADS] [CrossRef] [Google Scholar]
- Brodie, J. P., Larsen, S. S., & Kissler-Patig, M. 2000, ApJ, 543, L19 [NASA ADS] [CrossRef] [Google Scholar]
- Cappellari, M. 2017, MNRAS, 466, 798 [NASA ADS] [CrossRef] [Google Scholar]
- Carter, D., Johnstone, R. M., & Fabian, A. C. 1997, MNRAS, 285, L20 [CrossRef] [Google Scholar]
- Castignani, G., Combes, F., Salomé, P., & Freundlich, J. 2020, A&A, 635, A32 [CrossRef] [EDP Sciences] [Google Scholar]
- Cazaux, S., & Tielens, A. G. G. M. 2004, ApJ, 604, 222 [NASA ADS] [CrossRef] [Google Scholar]
- Cid Fernandes, R., Mateus, A., Sodré, L., Stasińska, G., & Gomes, J. M. 2005, MNRAS, 358, 363 [NASA ADS] [CrossRef] [Google Scholar]
- Coccato, L., Gerhard, O., Arnaboldi, M., & Ventimiglia, G. 2011, A&A, 533, A138 [NASA ADS] [CrossRef] [EDP Sciences] [Google Scholar]
- Concas, A., Popesso, P., Brusa, M., Mainieri, V., & Thomas, D. 2017, A&A, 606, A36 [NASA ADS] [CrossRef] [EDP Sciences] [Google Scholar]
- Dell’Agli, F., García-Hernández, D. A., Schneider, R., et al. 2017, MNRAS, 467, 4431 [NASA ADS] [CrossRef] [Google Scholar]
- Donahue, M., Connor, T., Fogarty, K., et al. 2015, ApJ, 805, 177 [NASA ADS] [CrossRef] [Google Scholar]
- Dopita, M. A., Sutherland, R. S., Nicholls, D. C., Kewley, L. J., & Vogt, F. P. A. 2013, ApJS, 208, 10 [NASA ADS] [CrossRef] [Google Scholar]
- Ebneter, K., & Balick, B. 1985, AJ, 90, 183 [NASA ADS] [CrossRef] [Google Scholar]
- Ebneter, K., Djorgovski, S., & Davis, M. 1988, AJ, 95, 422 [NASA ADS] [CrossRef] [Google Scholar]
- Ferland, G. J., Henney, W. J., O’Dell, C. R., & Peimbert, M. 2016, Rev. Mex. Astron. Astrofis., 52, 261 [Google Scholar]
- Ferrari, F., Pastoriza, M. G., Macchetto, F., & Caon, N. 1999, A&AS, 136, 269 [NASA ADS] [CrossRef] [EDP Sciences] [Google Scholar]
- Finkelman, I., Brosch, N., Funes, J. G., et al. 2012, MNRAS, 422, 1384 [NASA ADS] [CrossRef] [Google Scholar]
- Fogarty, K., Postman, M., Connor, T., Donahue, M., & Moustakas, J. 2015, ApJ, 813, 117 [CrossRef] [Google Scholar]
- Gaspari, M., Ruszkowski, M., & Oh, S. P. 2013, MNRAS, 432, 3401 [NASA ADS] [CrossRef] [Google Scholar]
- Gaspari, M., Temi, P., & Brighenti, F. 2017, MNRAS, 466, 677 [NASA ADS] [CrossRef] [Google Scholar]
- Ginolfi, M., Maiolino, R., Nagao, T., et al. 2017, MNRAS, 468, 3468 [NASA ADS] [CrossRef] [Google Scholar]
- Goudfrooij, P., Hansen, L., Jorgensen, H. E., & Norgaard-Nielsen, H. U. 1994, A&AS, 105, 341 [NASA ADS] [Google Scholar]
- Graham, A. W., Onken, C. A., Athanassoula, E., & Combes, F. 2011, MNRAS, 412, 2211 [NASA ADS] [CrossRef] [Google Scholar]
- Grillmair, C. J., Faber, S. M., Lauer, T. R., et al. 1994, AJ, 108, 102 [NASA ADS] [CrossRef] [Google Scholar]
- Hayakawa, A., Hoshino, A., Ishida, M., et al. 2006, PASJ, 58, 695 [NASA ADS] [Google Scholar]
- Hempel, M., Geisler, D., Hoard, D. W., & Harris, W. E. 2005, A&A, 439, 59 [NASA ADS] [CrossRef] [EDP Sciences] [Google Scholar]
- Hilker, M., Richtler, T., Barbosa, C. E., et al. 2018, A&A, 619, A70 [NASA ADS] [CrossRef] [EDP Sciences] [Google Scholar]
- Hirashita, H., & Nozawa, T. 2017, Planet. Space Sci., 149, 45 [CrossRef] [Google Scholar]
- Hirashita, H., Nozawa, T., Villaume, A., & Srinivasan, S. 2015, MNRAS, 454, 1620 [NASA ADS] [CrossRef] [Google Scholar]
- Hönig, S. F., & Kishimoto, M. 2017, ApJ, 838, L20 [NASA ADS] [CrossRef] [Google Scholar]
- Hönig, S. F., Kishimoto, M., Tristram, K. R. W., et al. 2013, ApJ, 771, 87 [NASA ADS] [CrossRef] [Google Scholar]
- Husemann, B., Scharwächter, J., Bennert, V. N., et al. 2016, A&A, 594, A44 [NASA ADS] [CrossRef] [EDP Sciences] [Google Scholar]
- Jeong, H., Yi, S. K., Kyeong, J., et al. 2013, ApJS, 208, 7 [NASA ADS] [CrossRef] [Google Scholar]
- Kauffmann, G., Heckman, T. M., Tremonti, C., et al. 2003, MNRAS, 346, 1055 [Google Scholar]
- Kewley, L. J., & Dopita, M. A. 2002, ApJS, 142, 35 [NASA ADS] [CrossRef] [Google Scholar]
- Kleiner, D., Pimbblet, K. A., Jones, D. H., Koribalski, B. S., & Serra, P. 2017, MNRAS, 466, 4692 [Google Scholar]
- Konigl, A., & Kartje, J. F. 1994, ApJ, 434, 446 [NASA ADS] [CrossRef] [Google Scholar]
- Kulkarni, S., Sahu, D. K., Chaware, L., Chakradhari, N. K., & Pandey, S. K. 2014, New A, 30, 51 [NASA ADS] [CrossRef] [Google Scholar]
- Lauer, T. R., Faber, S. M., Gebhardt, K., et al. 2005, AJ, 129, 2138 [NASA ADS] [CrossRef] [Google Scholar]
- Lindblad, P. O. 1977, Messenger, 10, 20 [Google Scholar]
- Macchetto, F., Pastoriza, M., Caon, N., et al. 1996, A&AS, 120, 463 [NASA ADS] [CrossRef] [EDP Sciences] [Google Scholar]
- Marigo, P., Girardi, L., Bressan, A., et al. 2017, ApJ, 835, 77 [NASA ADS] [CrossRef] [Google Scholar]
- McDonald, M., McNamara, B. R., van Weeren, R. J., et al. 2015, ApJ, 811, 111 [CrossRef] [Google Scholar]
- Michałowski, M. J., Hjorth, J., Gall, C., et al. 2019, A&A, 632, A43 [CrossRef] [EDP Sciences] [Google Scholar]
- Misgeld, I., Mieske, S., Hilker, M., et al. 2011, A&A, 531, A4 [NASA ADS] [CrossRef] [EDP Sciences] [Google Scholar]
- Momcheva, I. G., Lee, J. C., Ly, C., et al. 2013, AJ, 145, 47 [NASA ADS] [CrossRef] [Google Scholar]
- Mor, R., Netzer, H., & Elitzur, M. 2009, ApJ, 705, 298 [NASA ADS] [CrossRef] [Google Scholar]
- Murga, M., Zhu, G., Ménard, B., & Lan, T.-W. 2015, MNRAS, 452, 511 [NASA ADS] [CrossRef] [Google Scholar]
- Olivares, V., Salome, P., Combes, F., et al. 2019, A&A, 631, A22 [NASA ADS] [CrossRef] [EDP Sciences] [Google Scholar]
- Park, J., Jeong, H., & Yi, S. K. 2015, ApJ, 809, 91 [NASA ADS] [CrossRef] [Google Scholar]
- Proxauf, B., Öttl, S., & Kimeswenger, S. 2014, A&A, 561, A10 [NASA ADS] [CrossRef] [EDP Sciences] [Google Scholar]
- Prugniel, P., & Heraudeau, P. 1998, A&AS, 128, 299 [NASA ADS] [CrossRef] [EDP Sciences] [Google Scholar]
- Richtler, T., Salinas, R., Misgeld, I., et al. 2011, A&A, 531, A119 [NASA ADS] [CrossRef] [EDP Sciences] [Google Scholar]
- Richtler, T., Hilker, M., & Iodice, E. 2020, A&A, 643, A120 [CrossRef] [EDP Sciences] [Google Scholar]
- Rieke, G. H., & Lebofsky, M. J. 1985, ApJ, 288, 618 [NASA ADS] [CrossRef] [Google Scholar]
- Runge, J., & Yan, H. 2018, ApJ, 853, 47 [CrossRef] [Google Scholar]
- Sadler, E. M., & Gerhard, O. E. 1985, MNRAS, 214, 177 [NASA ADS] [Google Scholar]
- Sancisi, R., Fraternali, F., Oosterloo, T., & van der Hulst, T. 2008, A&ARv, 15, 189 [NASA ADS] [CrossRef] [EDP Sciences] [Google Scholar]
- Sansom, A. E., Glass, D. H. W., Bendo, G. J., et al. 2019, MNRAS, 482, 4617 [NASA ADS] [CrossRef] [Google Scholar]
- Schultz, G. V., & Wiemer, W. 1975, A&A, 43, 133 [NASA ADS] [Google Scholar]
- Smith, R. J., & Edge, A. C. 2017, MNRAS, 471, L66 [NASA ADS] [CrossRef] [Google Scholar]
- Sparks, W. B., Marcella Carollo, C., & Macchetto, F. O. 1997, ApJ, 486, 253 [NASA ADS] [CrossRef] [Google Scholar]
- Tran, H. D., Tsvetanov, Z., Ford, H. C., et al. 2001, AJ, 121, 2928 [NASA ADS] [CrossRef] [Google Scholar]
- van Dokkum, P. G., & Franx, M. 1995, AJ, 110, 2027 [NASA ADS] [CrossRef] [Google Scholar]
- Vasterberg, A. R., Jorsater, S., & Lindblad, P. O. 1991, A&A, 247, 335 [Google Scholar]
- Ventimiglia, G., Gerhard, O., Arnaboldi, M., & Coccato, L. 2010, A&A, 520, L9 [NASA ADS] [CrossRef] [EDP Sciences] [Google Scholar]
- Ventimiglia, G., Arnaboldi, M., & Gerhard, O. 2011, A&A, 528, A24 [NASA ADS] [CrossRef] [EDP Sciences] [Google Scholar]
- Vogelsberger, M., McKinnon, R., O’Neil, S., et al. 2019, MNRAS, 487, 4870 [NASA ADS] [CrossRef] [Google Scholar]
- Walcher, C. J., Coelho, P. R. T., Gallazzi, A., et al. 2015, A&A, 582, A46 [NASA ADS] [CrossRef] [EDP Sciences] [Google Scholar]
- Wirth, A., & Gallagher, J. S. 1980, ApJ, 242, 469 [CrossRef] [Google Scholar]
All Tables
Absolute line fluxes in units of 10−16 erg s−1 cm−2 for our four characteristic spectra.
All Figures
|
Fig. 1. Left panel: central 10″ × 10″ (WFPC2, planetary camera, F555W) of NGC 3311. North is up, east is to the left. The overall symmetry can be described as a disc with a radial feature pointing to the north-north-west that seems to emerge almost exactly from the centre. There is a population of about a dozen bona fide star clusters (little bright dots) fringing the border of the dust structure. Middle panel: V − I colour map. The blue spot is bluer by 0.5 mag than the unreddened galaxy light. Right panel: H-band image of the same field as in the other panels. The blue spot is still the brightest object, but three or four other objects (globular clusters?) become visible. Their integrated light appears as the “middle peak” in the paper. |
| In the text | |
|
Fig. 2. Diagnostic graphs for our four characteristic spectra. Red: total, green: blue spot, blue: middle peak, cyan: the rest (see Table 1). The line ratios from Table 2 are compared to the HII-region models from Dopita et al. (2013) (for a Boltzmann distribution of electrons) with the ionisation parameter log q and three oxygen abundances in solar units (1×, 2×, 3×) as parameters. The solid lines are lines of constant abundance and varying log q. The range of log q values is indicated in the left panel, which is the same for all panels. The dotted line in the middle panel is the line separating HII-regions from AGN-like spectra according to Kauffmann et al. (2003). As noted by Dopita et al. (2013), the right diagnostic graph seems to provide the cleanest separation of log q and oxygen abundance. Spectra 2 and 3 (blue spot and middle peak) show the characteristics of a HII-region and a super solar metallicity in all graphs. The other spectra show contributions from other ionising sources, presumably post-AGB stars. The right panel is apparently insensitive to this circumstance. |
| In the text | |
|
Fig. 3. Central 10″ × 10″ of the MUSE maps. North is up and east is to the left. Left panel: Hα-map. The dominant source is the blue spot, the second peak is approximately located near the centre of the dust lane. Middle panel: ratio [NII]/Hα. At the brightest Hα peaks, the ratio resembles an HII-region. In the outer parts, [NII] gets stronger like in LINER-like spectra, indicating the contribution of other ionising sources like the post-AGB stars of the old stellar population. Right panel: map of Balmer decrements mapping the extinction of the emission line region. |
| In the text | |
|
Fig. 4. A 1′ × 1′ map of the equivalent width (EW, unit Å) of the residual interstellar NaI absorption lines. North is up, east is to the left, and the MUSE pixel scale is 0.2″. In contrast to Figs. 1 and 3, we want to show the largest area possible. The EWs refer to the sum of both lines of the doublet. Structures in the cold, atomic gas are not visible, except the central dust lane that appears as a shadow. The lowest EWs are already about 0.5 Å, so we expect more cold gas outside the MUSE field. The gas probably has cooled down from the hot X-ray gas. |
| In the text | |
|
Fig. 5. Residual spectra of three characteristic regions after subtracting the galaxy light are shown in those three spectral regions where emission lines are visible. The appearance of the spectra resembles that of a normal HII-region with Hα being much stronger than [NII]. The fluxes are relative fluxes. |
| In the text | |
|
Fig. 6. Velocity map in Hα. The size is 10″ × 10″. North is up, east is to the left. The appearance suggests an inclined rotating disc, but the derived circular velocity is too low for a good agreement with dynamical models for the stellar body. We note that the mini-jet has a higher velocity than the systemic velocity, which is consistent with being expelled from the centre. |
| In the text | |
Current usage metrics show cumulative count of Article Views (full-text article views including HTML views, PDF and ePub downloads, according to the available data) and Abstracts Views on Vision4Press platform.
Data correspond to usage on the plateform after 2015. The current usage metrics is available 48-96 hours after online publication and is updated daily on week days.
Initial download of the metrics may take a while.