Fig. 3.
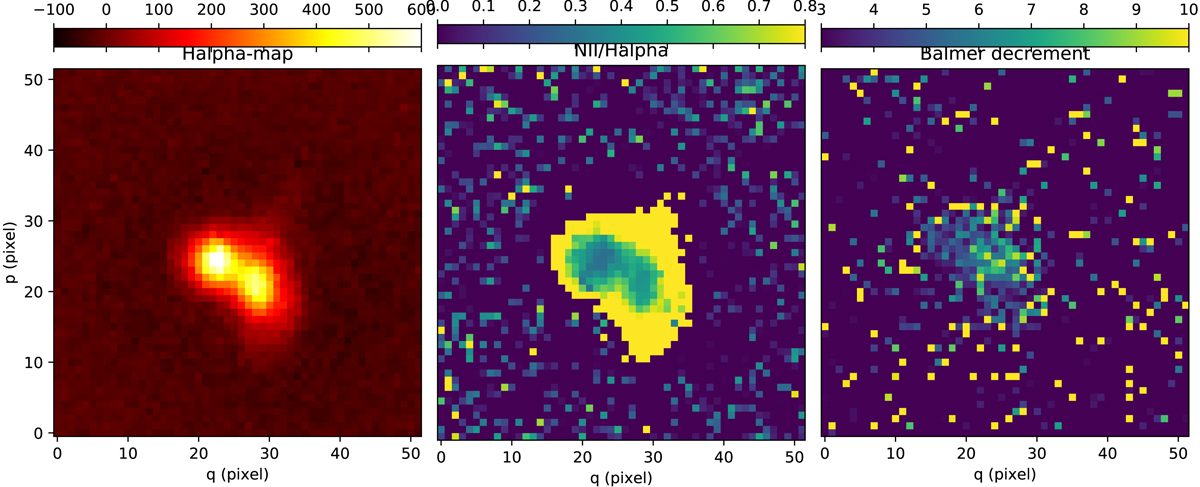
Central 10″ × 10″ of the MUSE maps. North is up and east is to the left. Left panel: Hα-map. The dominant source is the blue spot, the second peak is approximately located near the centre of the dust lane. Middle panel: ratio [NII]/Hα. At the brightest Hα peaks, the ratio resembles an HII-region. In the outer parts, [NII] gets stronger like in LINER-like spectra, indicating the contribution of other ionising sources like the post-AGB stars of the old stellar population. Right panel: map of Balmer decrements mapping the extinction of the emission line region.
Current usage metrics show cumulative count of Article Views (full-text article views including HTML views, PDF and ePub downloads, according to the available data) and Abstracts Views on Vision4Press platform.
Data correspond to usage on the plateform after 2015. The current usage metrics is available 48-96 hours after online publication and is updated daily on week days.
Initial download of the metrics may take a while.